Bankruptcies Higher Across Farm Country
TOPICS
Farm Economy
photo credit: Alabama Farmers Federation, Used with Permission
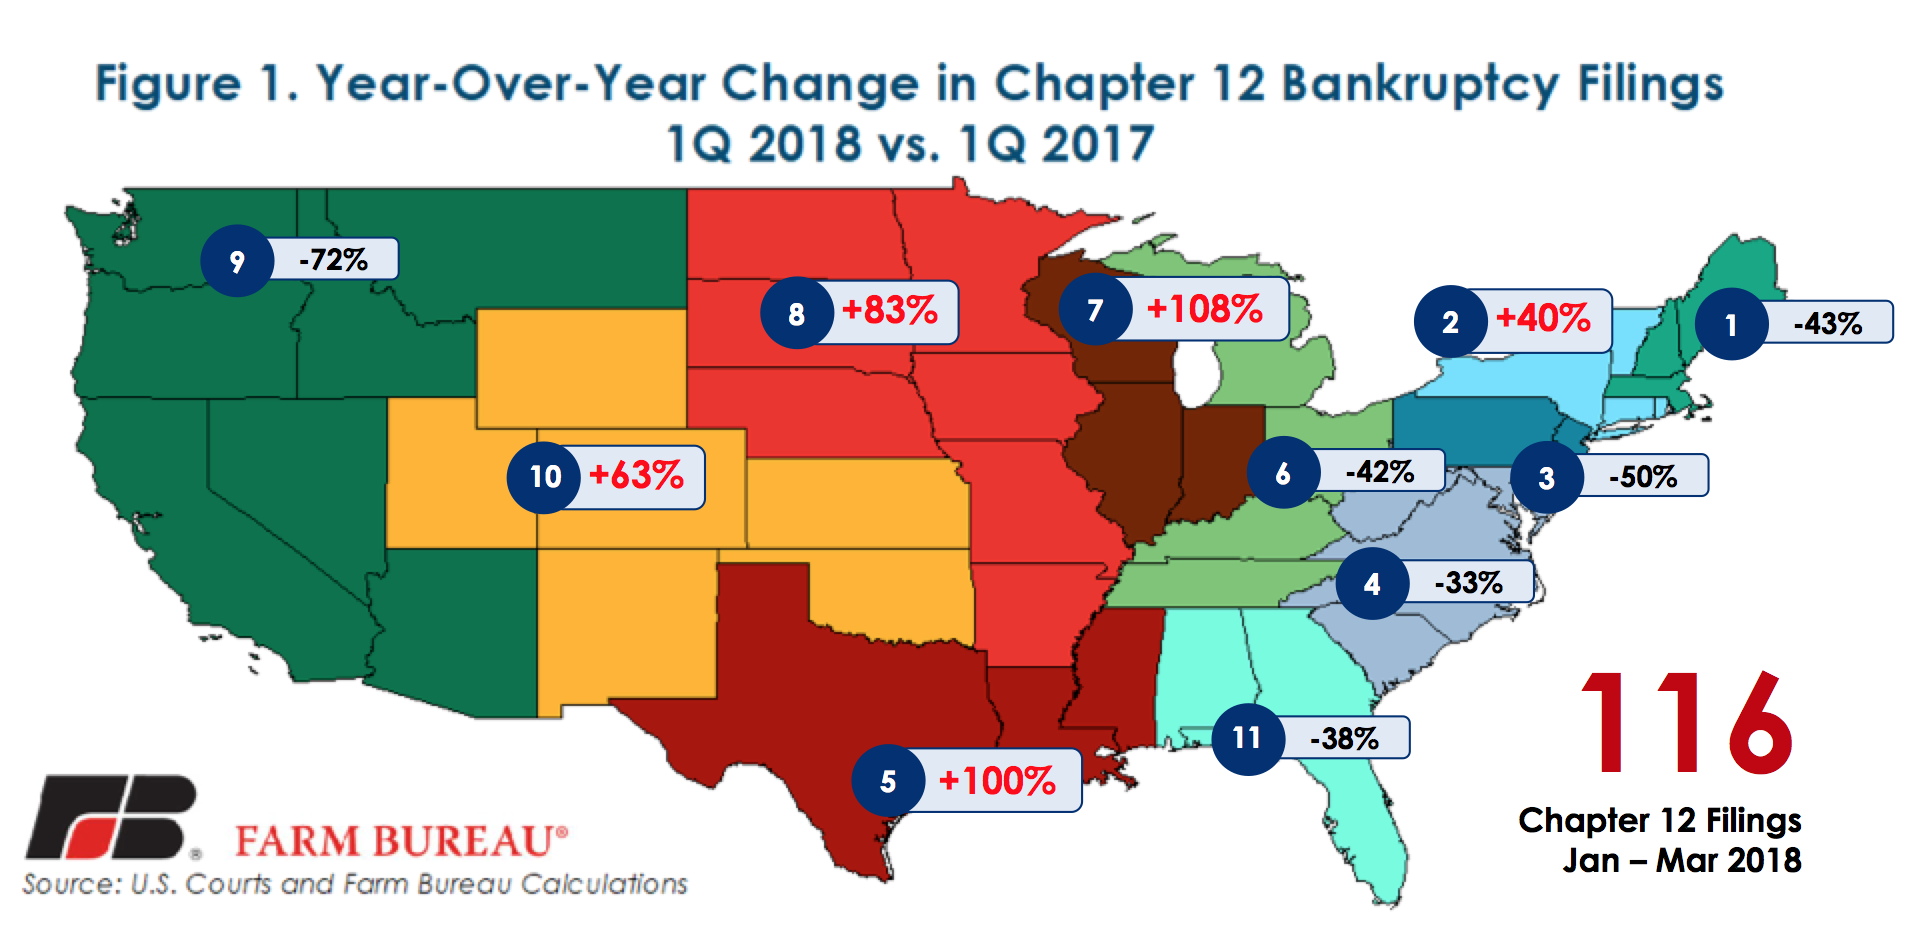
Caseload statistics from the United States Courts indicate that for the three-month period ending March 31, 2018, there were 116 Chapter 12 bankruptcy filings in the U.S. These Chapter 12 bankruptcies are designed for "family farmers" or "family fishermen" with "regular annual income". While down slightly from the first quarter of 2017, during which 118 Chapter 12 bankruptcies were filed, the March data highlights the tough financial conditions across much of rural America. From the Northeast, into the western Corn Belt and Upper Midwest, down into the Southwest and into the West, farm bankruptcies are higher than year-ago levels.
Of the 116 filings in the first quarter of 2018, nearly 70 percent of the bankruptcies were in farm country, i.e. dairy, corn, cotton, soybean and wheat producing areas. In these areas, year-over-year increases in Chapter 12 filings ranged from up 63 percent to up 108 percent, Figure 1. The higher bankruptcy levels in these areas are likely attributable to continued declines in cash receipts for dairy, wheat, corn and cotton, as projected by USDA.
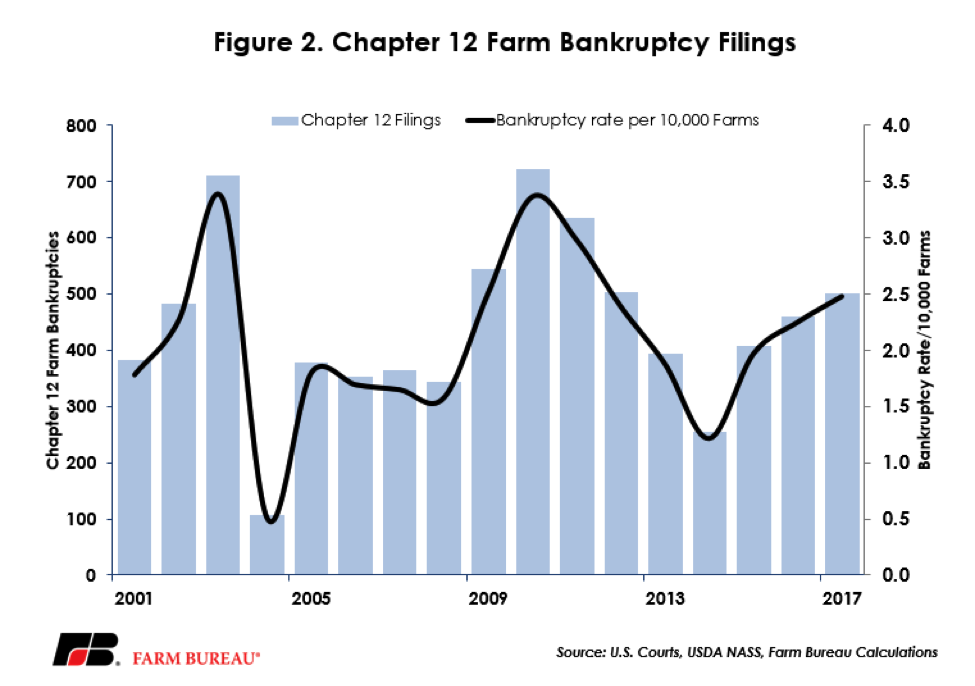
There were 501 Chapter 12 bankruptcy filings during 2017 – the highest level since 2012. Higher bankruptcy levels were anticipated given the financial stress in agriculture. Since 2013, net farm income, a broad measure of farm profitability, has declined by 52 percent, and in 2018 is projected to be at a 12-year low. In fact, bankruptcies have climbed each year since 2014; and since 2014, farm bankruptcies have increased nearly 100 percent, Figure 2.
The bankruptcy rate per 10,000 farmers is also at a multi-year high. In 2017, there were estimated to be slightly more than 2 million farmers, and the bankruptcy rate per 10,000 farms was approximately 2.5 farms – the highest level since 2011.
While bankruptcy levels are rising, USDA does project improvements in solvency and liquidity ratios. The debt-to-asset ratio is projected to decline to 12.6 percent from 12.7 percent and the debt-to-equity ratio is projected to decline to 14.4 percent from 14.5 percent. The debt service ratio, which measures the share of farm production needed to service debt, is projected to remain mostly unchanged in 2018 at 27 percent. Despite these ratios, real estate debt is projected at $239 billion in 2018, and non-real estate debt is projected at $150 billion – both record highs.
While there are a variety of ways to measure the health of the farm economy, Chapter 12 farm bankruptcies are one of the better indicators. These bankruptcies represent financially distressed family farmers who had to restructure financials to avoid a liquidation of assets or foreclosure. For many farmers, this is not the end of the line, but an opportunity to identify a path forward that involves a repayment plan of outstanding debt.
While USDA does project modest price improvements for the current crop being planted, without meaningful and long-lasting price recovery in the very near future, many in the industry expect farm bankruptcies to continue to accelerate. (For more on the current crop, see USDA Projects Lower U.S. Stocks, Higher Prices for Corn and Soybeans.)
Given these financial challenges, passing a farm bill on time is one way to ensure that farmers and ranchers continue to have access to important risk management, conservation and market access and development programs, as well as the many other programs authorized by the legislation.