Certainty and Stability for AEWR
TOPICS
H-2A
photo credit: Mark Stebnicki, North Carolina Farm Bureau; used with permission.
Today’s Market Intel reviews how the Department of Labor’s final rule amending the methodology for determining the H-2A program’s adverse effect wage rate provides stability and predictability in labor costs and also ensures wage rates under the program continue to increase and keep pace with wage growth observed across the broader U.S. economy.
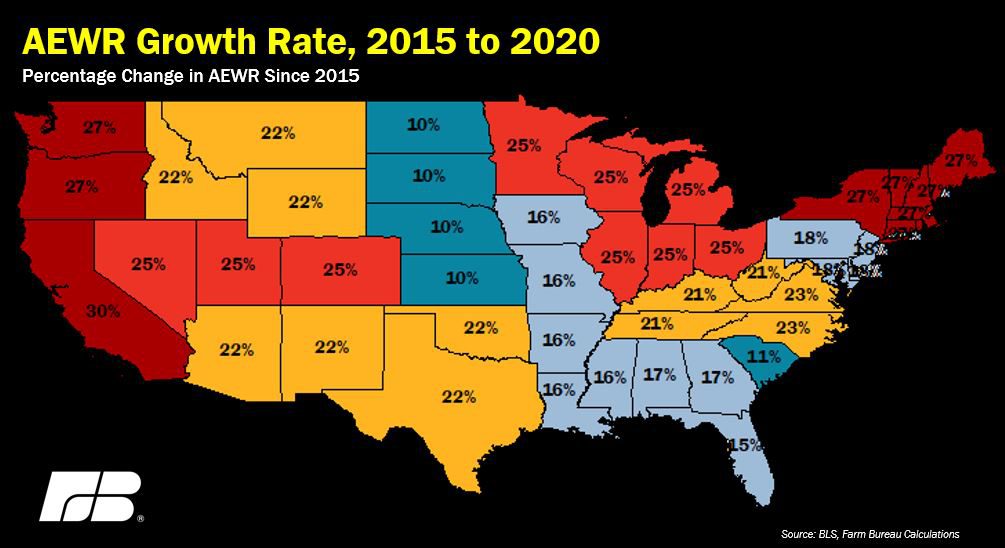
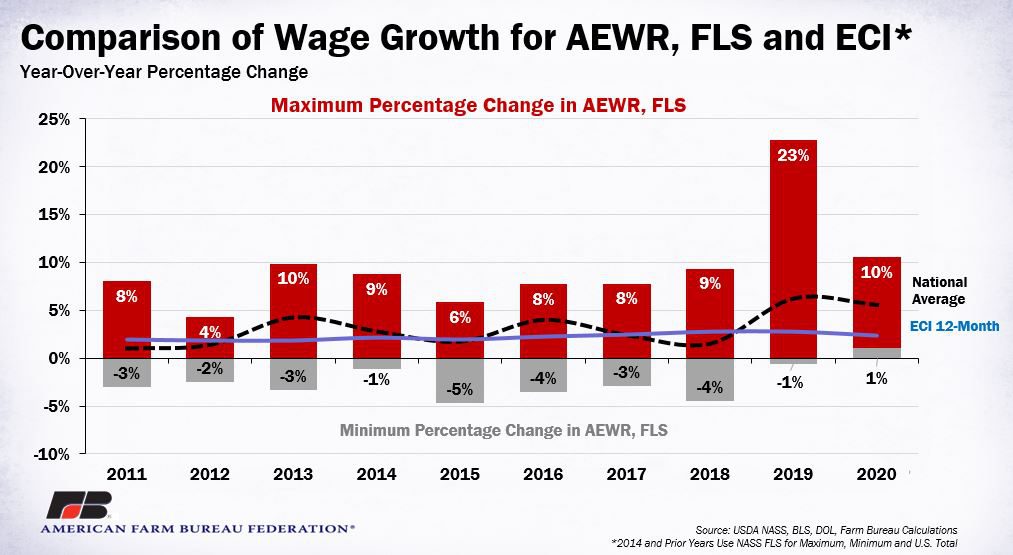
Significant increases and variability in wage rates for the DOL’s H-2A temporary agricultural guest worker program have long been a problem for farmers. For example, during 2019, wage rates under the H-2A program increased by more than 20% in Colorado, Nevada and Utah. In California, wage rates have increased by more than 30% since 2015, and in 32 states the wage rate has increased by more than 20% since 2015. The national average H-2A wage rate increased by 21.2% from 2015, and by nearly 6% in a single year from 2019 to 2020, e.g., 2019 H-2A Sets Records, While a 2020 AEWR Wage Increase Approaches.
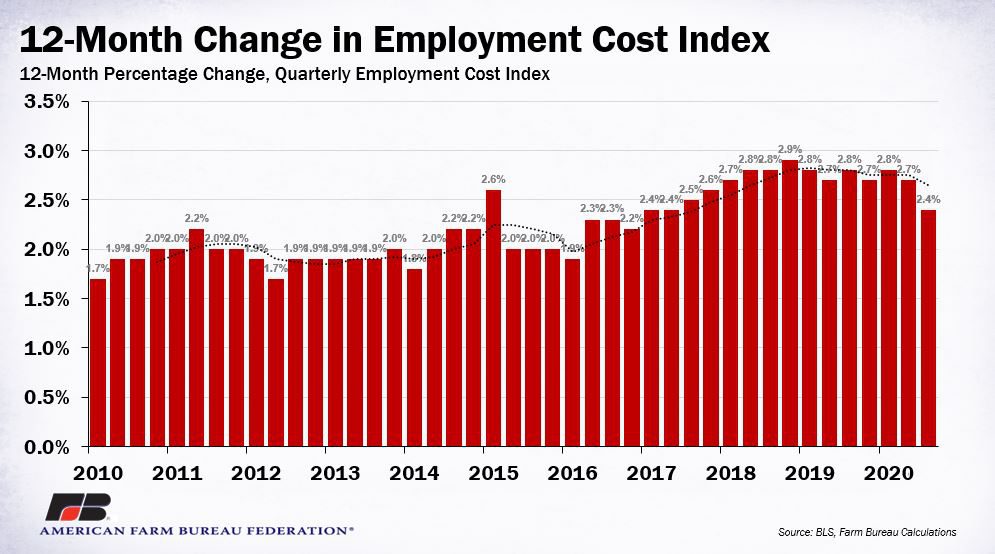
Meanwhile, data from the Bureau of Labor Statistics indicates that since 2015 labor costs across the broader U.S. economy rose by 13.5%, and from 2019 to 2020 the Employment Cost Index rose by less than 3% -- both well below the increase in wage rates in DOL’s H-2A program. For U.S. employers, including crop and livestock farmers, the volatility and rapid increase in H-2A wage rates has significantly increased labor costs.
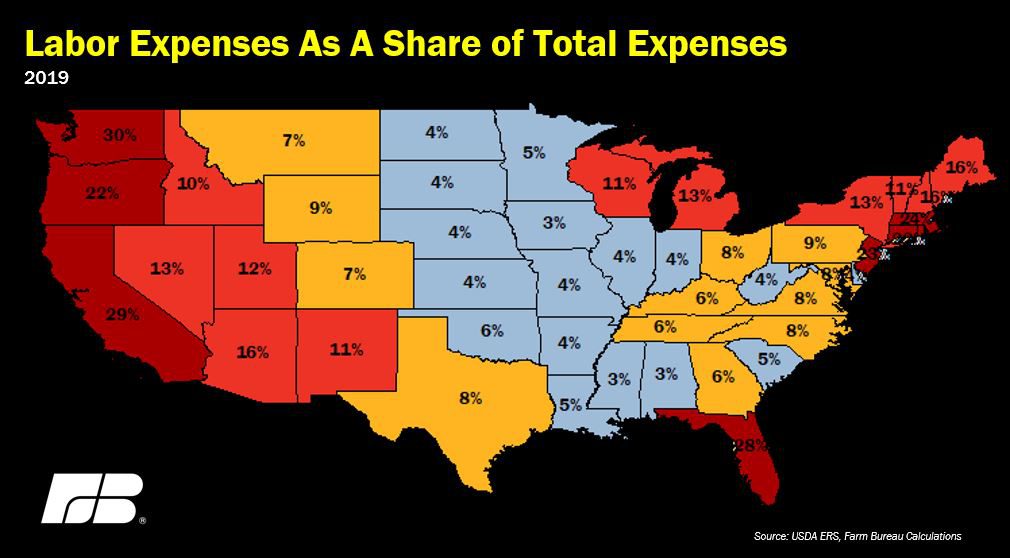
During 2020, according to USDA’s Farm Income and Wealth Statistics, farmers and ranchers are expected to spend more than $36 billion on labor expenses – the second-highest labor expenditure on record. Now consider that in many labor-intensive specialty crop farming areas, such as in California, Florida and Washington, and many portions of the Northeast, labor expenses represent more than 20% of total production costs. For farmers in these states, a rapid and unforeseen increase in labor costs cannot be easily absorbed given that farmers are price takers and cannot pass higher costs down the supply chain to retailers or consumers.
Background
The H-2A program allows U.S. employers, such as farmers and ranchers, to bring foreign nationals into the United States to fill temporary agricultural jobs. Wage rates under the H-2A program are based on the higher of the following: federal or state minimum wage; the prevailing wage as determined by the Department of Labor using a special methodology to conduct wage surveys for each particular task in very local areas; or the adverse effect wage rate, defined as the regional weighted average hourly wage rate for crop and livestock workers reported in USDA-National Agricultural Statistics Service’s annual Farm Labor Survey of non-supervisory farm and ranch workers.
Since 2015, the nationwide monthly wage rate under the H-2A program has increased nationally by more than 20%. Areas with the highest increase in wage rates, on a percentage basis, include California at more than 30%, the Pacific Northwest at nearly 28% and portions of the Northeast at nearly 27%. The wage rate in Western states such as Colorado, Nevada and Utah, the Great Lakes region and the Corn Belt have all jumped more than 25% in the past five years. The slowest wage growth since 2015, 10%, occurred in the northern Plains.
Changes in the AEWR Methodology
To provide stability and predictability in the H-2A wage rates, and wage rates for most labor codes under the Standard Occupational Classification System, the DOL’s new wage methodology replaces the labor costs reported by NASS in the Farm Labor Survey with an annually adjusted wage rate based on the BLS Employment Cost Index.
Beginning in 2023 and annually thereafter, the H-2A AEWR will be indexed to the percent change in the ECI for the preceding 12 months. For example, in 2023, if the ECI for the previous 12 months increased by 3%, then all H-2A AEWRs nationwide will be increased by 3% from the prior-year’s level. The applicable SOC codes impacted by this new methodology include 45-2041 – Graders and Sorters, Agricultural Products; 45-2091 – Agricultural Equipment Operators; 45-2092 – Farmworkers and Laborers, Crop, Nursery and Greenhouse; 45-2093 – Farmworkers, Farm, Ranch, and Aquacultural Animals; 53-7064 – Packers and Packagers, Hand; and 45-2099 – Agricultural Workers, All Other.
Importantly, as a principal economic indicator, the ECI is the only measure of labor costs that treats wages and salaries and total compensation consistently. Because the ECI includes not only wages and salaries but also employer costs for employee benefits, covers nearly all employees in the civilian economy and is not affected by changes in relative employment of industries and occupations with different wage and compensation levels, the ECI ensures that adjustments to the AEWR will keep pace with wage growth nationwide.
Over the last five years, the ECI has increased by 13.5%. Since 2010, the ECI has increased on average by more than 2% per quarter on a 12-month basis. On a quarter-by-quarter basis, the ECI increased by approximately 0.6% per quarter. And it has not decreased over the past decade. Cumulatively, since 2010 the ECI has increased by 25%. Replacing the USDA FLS labor costs with an AEWR indexed to the ECI ensures not only that wage growth is predictable, but that wages continue to increase and keep pace with wage growth in the overall civilian economy.
Moving forward, the wage rate under the H-2A program will be based on the higher of the following: federal or state minimum wage; the prevailing wage as determined by the Department of Labor using a special methodology to conduct wage surveys for each particular task in very local areas; or the ECI-adjusted adverse effect wage rate (which is not in effect until 2023). For example, should the federal or state minimum wage exceed the current AEWR, the state or federal minimum wage will serve as the wage rate under the H-2A program. Thus, while the ECI-adjusted AEWR does not become effective until 2023, H-2A wage rates will increase should any of the other two wage rate criteria exceed the current AEWR.
For H-2A workers who do not fall into one of the above-mentioned categories, the DOL will annually set the AEWRs based on the statewide, or national, annual average gross hourly wage reported by the BLS Occupational Employment Survey. Job examples for these categories include high- or unique-skill agricultural truck drivers, managers, supervisors and construction workers. Wage rates for these occupations will change immediately beginning in 2021 and will likely be higher than the current H-2A wage rates.
Stability and Certainty Provided by New Rule
Over the last decade, wage rates under the DOL’s H-2A visa program have been highly variable and uncertain. Cumulatively, since 2010, labor costs reported by USDA’s FLS – which underpins the H-2A AEWR -- have increased by nearly 40% nationwide. In the Pacific Northwest, labor costs have increased by nearly 50%, and in California, labor costs have increased by 43% since 2010. According to USDA’s Economic Research Service, total farm labor expenses have increased by $8.7 billion, or 31%, since 2010. Contrast that to the 25% wage growth across the broader U.S. economy since 2010 and it is clear that farm labor costs have outpaced wage growth elsewhere in the economy.
Indexing AEWR to the ECI will stabilize wage rates, while providing H-2A workers certainty their pay will continue to increase. That hasn’t always been the case with the FLS. In some years the AEWR would move in the opposite direction of wage growth in the economy and decline year-over-year. For example, in USDA’s Mountain II region, which includes Colorado, Nevada and Utah, labor costs declined for three consecutive years between 2015 and 2017 before increasing by 23% in 2019. For agricultural employers and workers in these areas, their wage rates were disconnected from economic conditions and wage growth nationwide. DOL’s new wage methodology fixes that disconnect and also ensures wage rates remain predictable and stable.
This final rule is the first installment of a broader update to the H-2A program. The second portion of the final rule which pertains to other non-wage aspects of the H-2A program is forthcoming.