Congressional Budget Office Updates Farm Bill Math
TOPICS
Farm Bill
photo credit: AFBF Photo, Philip Gerlach
On April 12, 2018, the House Agricultural Committee released text of the 2018 Farm Bill. One of the key components of the farm bill negotiations is often what’s called farm bill math. The math underlying the 2018 farm bill was released in early April by the Congressional Budget Office. On April 9, 2018, CBO released projections on expected spending for selected programs for the current budget year plus 10 years, i.e. the 10-year baseline. These baseline projections identify expected outlays associated with a number of programs important to farmers and ranchers including the Supplemental Nutrition Assistance Program and USDA Mandatory Farm Programs such as crop insurance, conservation and farm programs.
CBO’s most recent projections are for total farm bill spending for all titles from 2018 to 2028 to be $867 billion. This total is down nearly $90 billion from when the farm bill was passed in January 2014; at that time CBO projected total farm bill outlays at $956 billion. Today’s Market Intel compares the most recent April 2018 baseline to the January 2014 baseline, which was estimated following the 2014 farm bill. These most recent cost projections are important because they will be used to score policy changes proposed during the 2018 farm bill debate in the House and Senate.
Projected Farm Bill Spending
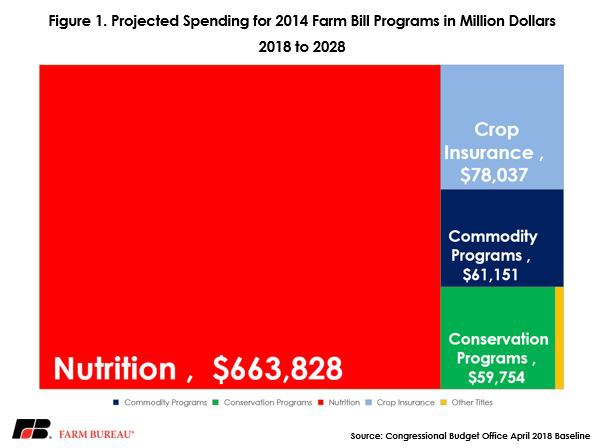
As evidenced in Figure 1, the largest share of projected farm bill expenditures belongs to the nutrition title. Projected spending on nutrition programs is $664 billion, and represents nearly 76.5 percent of all farm bill spending. When the 2014 farm bill was passed, nutrition programs were expected to cost $756 billion, and represented 79 percent of total farm bill spending.
The remaining 23 percent of farm bill spending is found in the other titles including crop insurance, conservation and commodity programs. At $199 billion, the three titles represent 22.9 percent of total farm bill spending from 2018 to 2028 – up from 20 percent and $192 billion when the 2014 farm bill was passed. The remaining titles, including trade, credit, rural development, research, forestry, energy and horticulture, currently represent less than on half of one percent of farm bill spending at $4.4 billion – $3.7 billion lower than the 2014 estimates. Figure 1 highlights the share of projected farm bill spending by title based on the April 2018 CBO baseline.
Farm Bill Costs $90 Billion Less Today
Based on the most recent projections the farm bill will cost nearly $90 billion less over the next 10 years than when it was passed into law in 2014. The savings can be attributable to several titles, as well as a number of economic changes in the U.S. and farm economies.
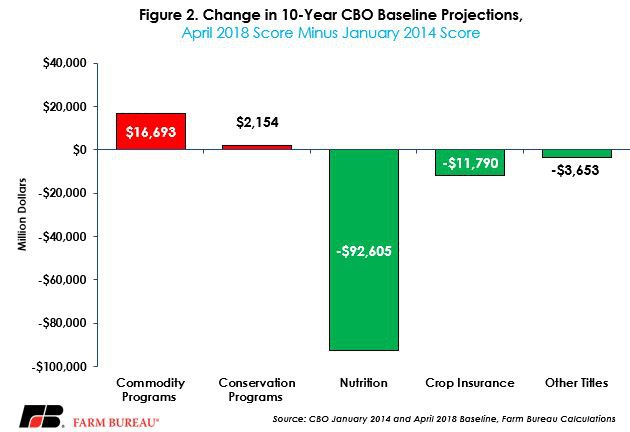
First, while nutrition programs represent the largest title of the farm bill, SNAP outlays are projected to be $93 billion lower from when the 2014 farm bill was signed into law, Figure 2. CBO’s projection for a reduction in nutrition outlays is anticipated due to the strength of the U.S. economy, a 17-year low unemployment rate and projections for continued tightness in the labor market. CBO projects unemployment to remain below 5 percent over the next decade, and for overall SNAP participation to drop by 8.8 million people by 2028. While SNAP benefits per person are expected to pace with inflation, from $125 to $158 dollars per person, overall expenditures are less because fewer Americans are expected to need access to nutrition programs. By 2025, SNAP participation is projected to be below recessionary levels experienced in 2009.
The second-largest title of the farm bill is federal crop insurance. Projected spending on crop insurance programs is $78 billion over 10 years, representing 9 percent of total farm bill dollars. Nearly $12 billion less is projected to go toward crop insurance than when the 2014 farm bill was passed. The reduction in crop insurance outlays was also anticipated. Crop prices have fallen by double-digit percentage points in recent years, and as a result total liability for crop insurance policies sold has also decreased. For example, for corn, soybeans and wheat, total crop insurance liabilities fell by 9 percent from the 2014 to 2017 reinsurance years. Expenses related to crop insurance are a function of the liabilities and the risk environment, thus with lower liabilities farm bill crop insurance outlays should decline.
The third-largest title is the commodity title (Title I), which includes programs such as Agriculture Risk Coverage, Price Loss Coverage, the Dairy Margin Protection Program and Marketing Loan Assistance programs. This is the only major farm bill title, other than conservation, that is expected to cost more than originally anticipated. With farm income at a 12-year low and commodity prices declining since the 2014 farm bill was enacted, farmers and ranchers had to rely on the safety net protection provided by Title I programs. As a result, spending on commodity programs is now expected to be higher than when the farm bill was originally passed. Commodity title outlays are projected at $61 billion, up $17 billion from the January 2014 baseline.
However, not all the additional outlays are directly attributable to lower-than-anticipated commodity prices. First, the Bipartisan Budget Act of 2018’s improvements to the cotton and dairy safety nets are now included in the CBO baseline projection. Second, CBO projects for a majority of base acreage to switch out of ARC and into the PLC program beginning with the 2019 crop year (2021 fiscal year). Specifically, CBO anticipates in 2019 for 85 percent of corn base acres to enroll in PLC, up from 7 percent in the 2014 farm bill, and for 82 percent of wheat base acres to enroll in PLC, up from 43 percent during the last farm bill. The improvements to cotton and dairy programs combined with the switch to PLC from ARC have resulted in higher outlays for these critical farm safety net programs.
Summary
This most recent CBO baseline on farm program outlays is an important indicator of the budget outlook for farm programs and sets the table for the 2018 farm bill debate. From now through the farm bill’s passage, any proposed change in policy will require an estimate of the budgetary impact relative to this April 2018 baseline. Current expectations are for the House-released farm bill to be budget neutral, meaning any new amendments that increase spending in one title are likely to require a decrease in spending elsewhere in the same title.
With farm bill math now updated, all eyes will turn to the respective committees and to the members of Congress to get a farm bill passed on time that provides the important safety net protection, technical and financial assistance for conservation efforts, foreign market development and nutritional assistance to both farm and non-farm families.