Farm Bankruptcies in 2018 – The Truth is Out There
TOPICS
Market Intel
photo credit: Texas Farm Bureau
Here’s what we know: Caseload statistics from the United States Courts indicate that in 2018 Chapter 12 family farmer and family fisherman bankruptcies nationwide were down from prior-year levels. Chapter 12 farm bankruptcy provides a flexible and seasonal repayment schedule, and at times may provide lower interest rates and reduce the overall debt burden.
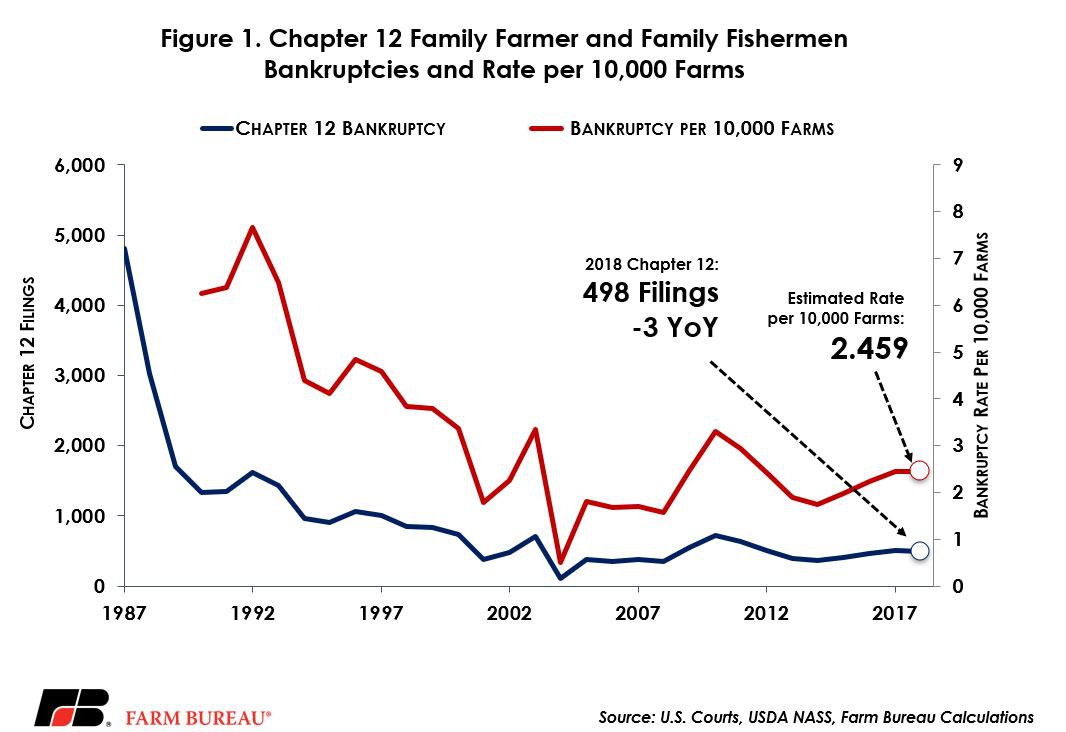
Chapter 12 filings in 2018 totaled 498 and were down 1 percent, or three filings, from the 2017 calendar year. This echoes recent Farm Bureau analysis that revealed that Chapter 12 bankruptcy filings were lower when comparing filings from fiscal year 2017 to fiscal year 2018 (Chapter 12 Bankruptcies Lower Across Farm Country). Statistics from the U.S. Courts also show Chapter 12 filings during 2018 were down slightly from the 10-year average of 504 bankruptcies per year.
We also know, however, that Chapter 12 bankruptcy filings in 19 states were higher than prior-year levels. In these states there were 303 bankruptcy filings, up from 204 filings the year before. In the Midwest, for example, bankruptcies totaled 223 filings and were up 19 percent from prior-year levels. Bankruptcies in the Midwest were also double what they were in 2008 and at the highest level in more than a decade. So, farm bankruptcies are both up and down. Today’s Market Intel seeks to provide perspective on 2018 farm bankruptcies by reviewing historical trends and year-over-year changes.
Bankruptcy Rate Across Agriculture
We had fewer farm bankruptcies in 2018 than the year before. We also likely had fewer farms in the United States in 2018 relative to 2017. Therefore, while the total number of farm bankruptcies was lower in 2018, it’s possible the number of farm bankruptcies as a share of total farm operations was higher. To evaluate this possibility, the bankruptcy rate per 10,000 farms was calculated from 1987 to 2018. Farm numbers in 2018 are not available from USDA, so a trend estimate of farm numbers was implied based on historical farm numbers.
Using data implied from USDA’s Farm Production Expenditures survey, in 2017 there were 2.04 million farms in the U.S. Based on the 501 Chapter 12 bankruptcies, the bankruptcy rate per 10,000 farms was 2.456 in 2017. The U.S. has lost an average of 1 percent of U.S. farms annually during the last decade, putting the 2018 trend estimate for farm numbers at 2.025 million. When we put that 2.025 million farms up against the 498 farm bankruptcy filings, the bankruptcy rate per 10,000 farms is estimated to have climbed slightly in 2018 to approximately 2.459. This is the highest level since 2011 and the fourth consecutive year of rising bankruptcy rates as a proportion of the farm population. Figure 1 highlights the annual Chapter 12 bankruptcy filings and the bankruptcy rate per 10,000 farms.
State-Level Farm Bankruptcies
Reviewing farm bankruptcies at the national level does not tell the full story. Certain sectors of the farm economy have suffered several consecutive years of low prices and revenue. For example, cash receipts for dairy farms fell by nearly 30 percent from 2014 to 2015 and have remained at depressed levels, and below the 10-year average. Similarly, cash receipts from wheat have fallen by 45 percent since the 2013 high and have remained below $10 billion for four consecutive years. (The 10-year average was $11.5 billion) Corn cash receipts are down 33 percent from 2012 and have been below the 10-year average for four consecutive years.
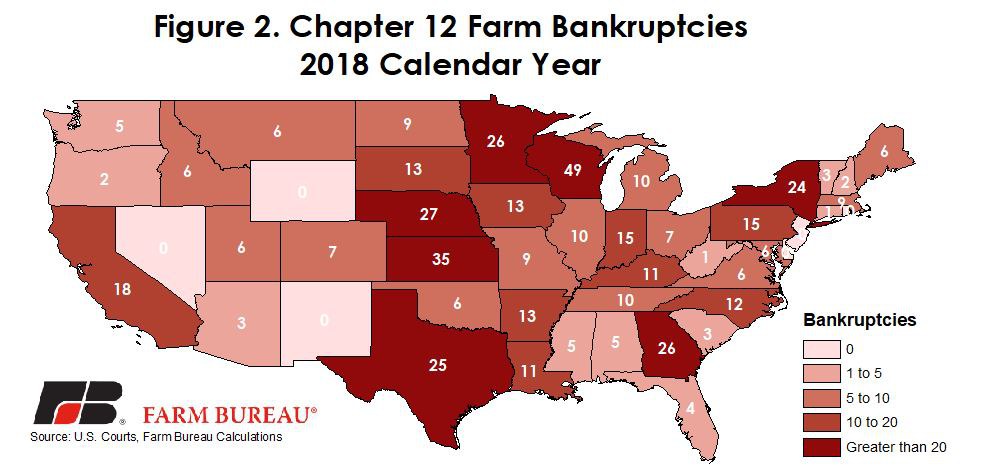
The net effect is that growers in states with high concentrations of these agricultural products have likely faced increased financial pressure in recent years. Farm bankruptcies in Wisconsin, the second largest dairy state, totaled 49 filings in 2018 – the highest in the nation. Chapter 12 bankruptcy filings in Wisconsin were the highest in over a decade and were more than double the level experienced in 2009. Other states also saw bankruptcy levels reach decade-high levels. These states include Indiana, Kansas, Minnesota, North Dakota, South Dakota and Utah. Combined, these six states had 153 bankruptcy filings in 2018 – up from 108 filings the year before and 64 filings a decade ago. Figure 2 identifies Chapter 12 bankruptcy filings by state for 2018.
Year-Over-Year Changes in Bankruptcy
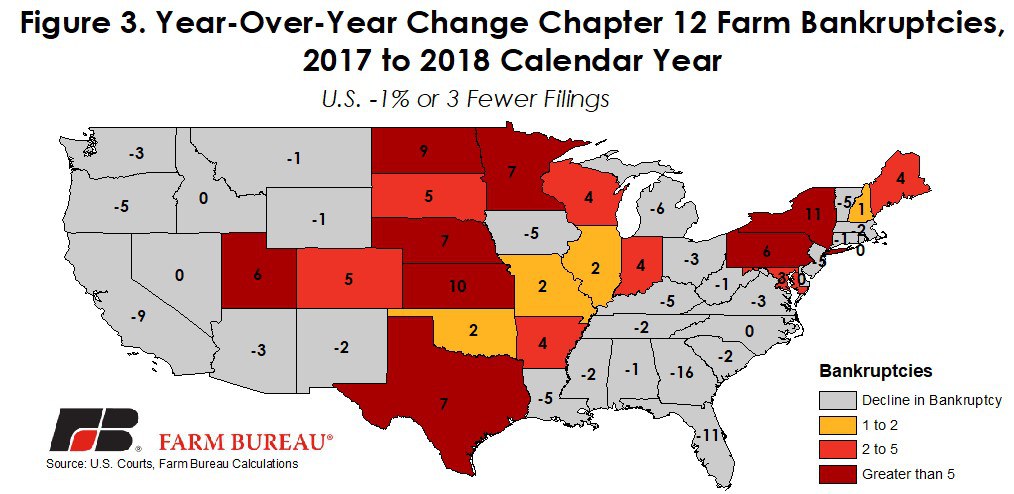
Nineteen states saw Chapter 12 bankruptcy filings increase in 2018. Increases in bankruptcy levels were highest in New York, followed by Kansas, North Dakota, Minnesota and Nebraska among others. In many of these states, the climb in bankruptcies experienced in 2018 is the largest or second-largest increase experienced over the last decade. Furthermore, all of these states have high concentrations of dairy, corn and wheat producers – helping to explain the rise in farm bankruptcies. Figure 3 identifies the year-over-year change in farm bankruptcy filings.
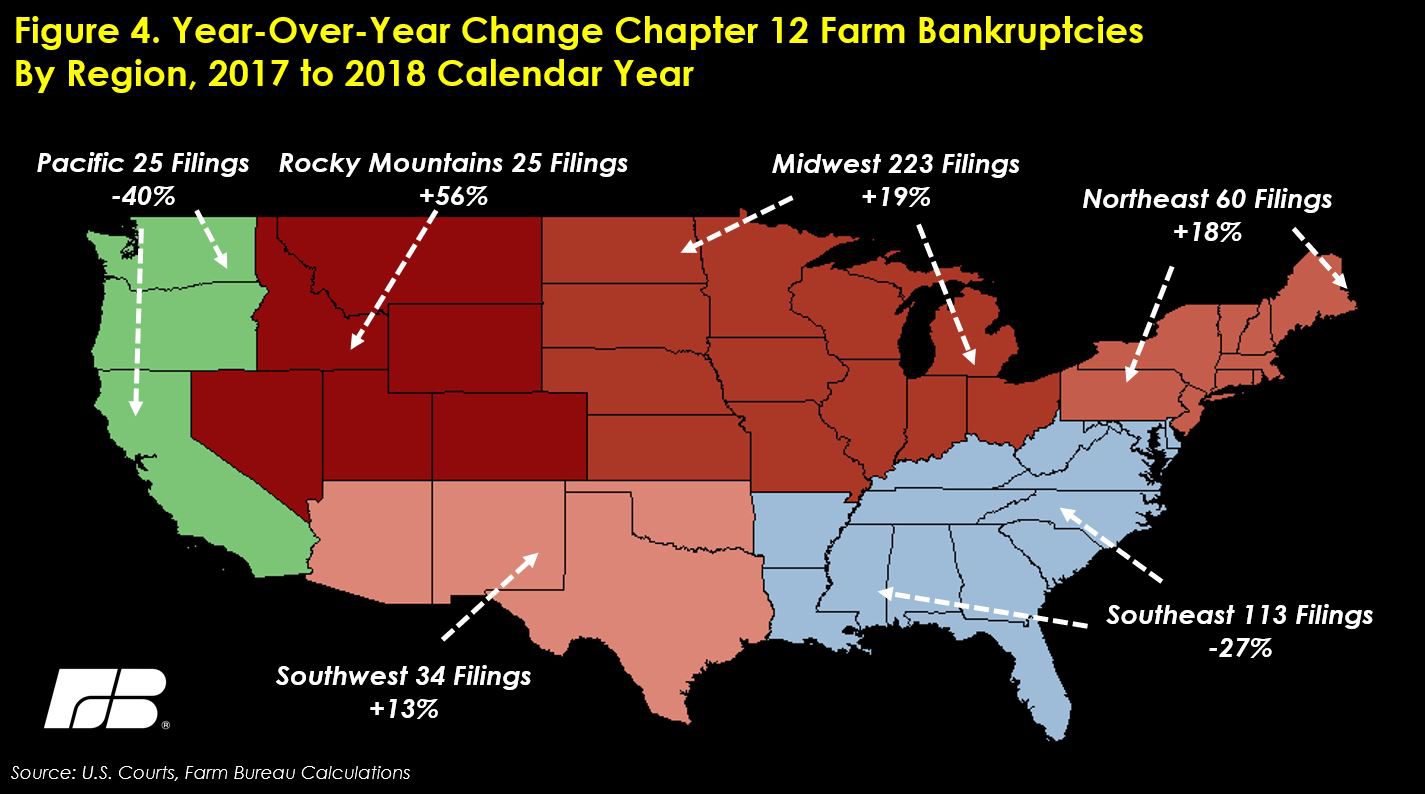
When grouped by region, farm bankruptcies were the highest in the Midwest, with 223 filings in 2018. The 223 filings in the Midwest were the most in that region in the last decade, and nearly 60 percent higher than the 10-year average of 141 filings. Following the Midwest, bankruptcies were also higher in the Rockies, the Southwest and Northeast. Only the Pacific and Southeast saw fewer bankruptcies in 2018 than in 2017. In the Pacific, bankruptcies were the lowest in the last decade, and in the Southeast bankruptcies were the lowest since 2013. Figure 4 shows the year-over-year percentage change in farm bankruptcies by region (Note: percentage changes reflect the small denominator associated with Chapter 12 filings.)
Summary
Chapter 12 farm bankruptcies in the U.S. were down in 2018 compared to prior-year levels. While total bankruptcies were lower, as a proportion of farms in the U.S., bankruptcies were higher. Then, in some portions of the U.S., farm bankruptcies were at decade-high levels – likely reflecting poor commodity prices and cash receipts associated with dairy and row crop production.
This situation is likely to worsen. Farm debt is record-high, the debt-to-asset ratio has climbed for six consecutive years, and farm debt as a proportion of annual farm income is at 97 percent—a 32-year high. In addition, lending standards are tighter and the cost of credit is rising. There are options before bankruptcy relief, and certainly many farmers have liquidated assets to discharge debt. How much longer can many others endure remains a question.
The capacity to repay debt will be further challenged in 2019 if farm commodity prices do not improve. Continued retaliatory tariffs on U.S. agricultural commodities will only make it harder for farmers to service debt as another, i.e. third, round of trade mitigation payments is not expected.
Finally, while the trends are concerning, bankruptcy does not mean the loss of the family farm. Through a successful Chapter 12 bankruptcy a farmer may have an opportunity to retain assets and continue the farm operation in some capacity.