Soybeans Finally Crowned King
TOPICS
Wheat
photo credit: AFBF Photo, Morgan Walker
On June 29, USDA released its annual June Acreage Report. This report updates planted acreage estimates from the March planting intentions report and is among the most anticipated of the year. This is one of several key reports that have historically resulted in substantial price swings in Chicago-traded futures. This release indicates that U.S. growers planted 322 million acres of principal crops, the highest level since 2014 and up nearly 3 percent from 2017. One key takeaway is that producers will plant about 1 percent fewer corn and soybean acres in 2018, and will instead diversify into other crops such as spring wheat, hay, cotton, sorghum and rice.
National Summary
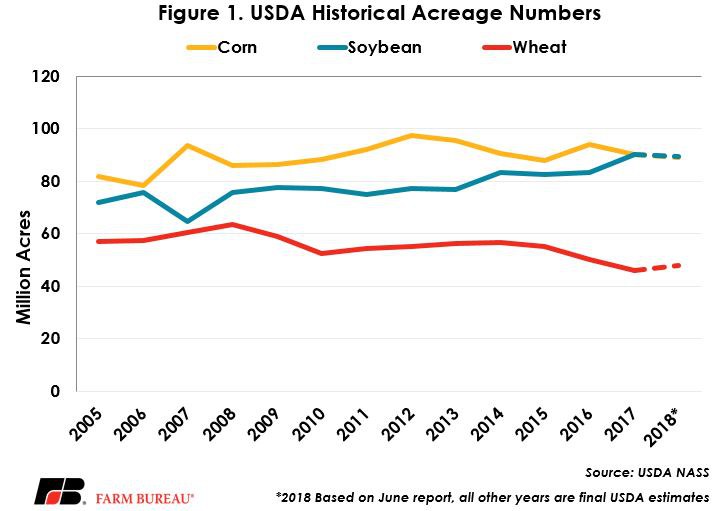
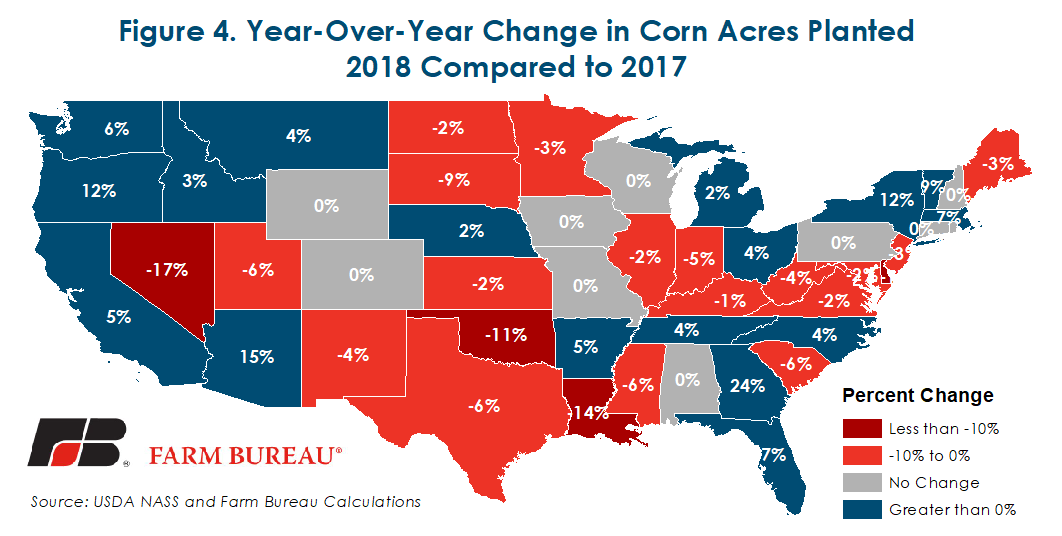
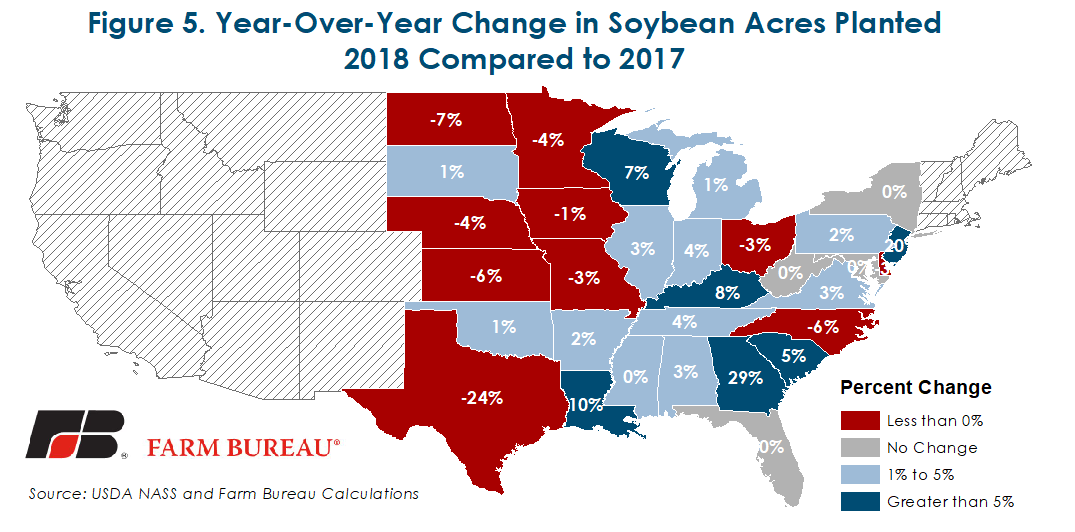
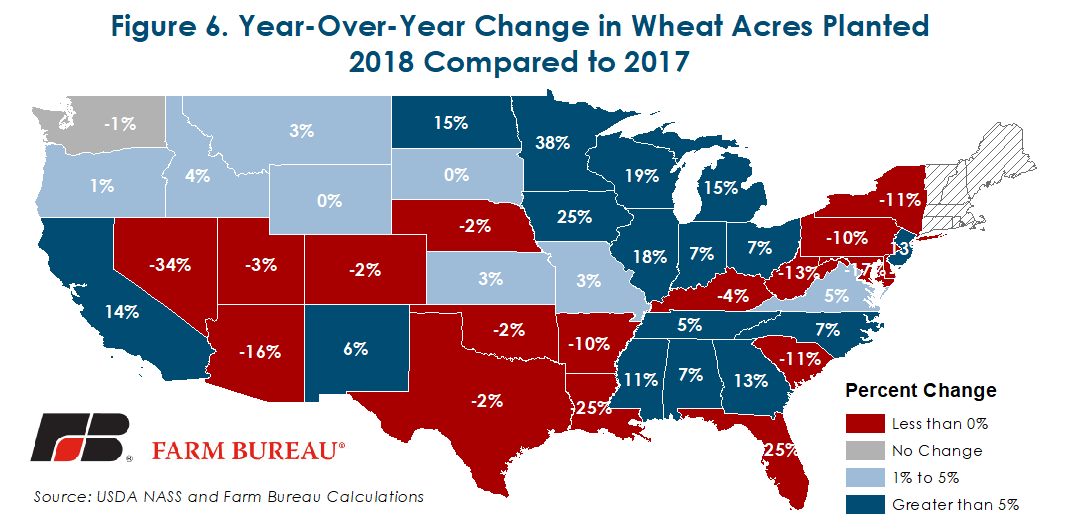
For soybeans, the June planted acres estimate came in at 89.56 million acres, down 1 percent from last year and falling just short of analysts’ expectations of a projected increase to 89.69 million acres. For the first time since 1983, farmers in the U.S. planted more soybean acres than corn acres. In corn, USDA pegged area at 89.13 million acres, down 1 percent from last year and over half a million acres more than the analyst projected 88.56 million acres. Wheat stopped its three-year slide, with USDA projecting area at 47.82 million acres. This is the first upturn in wheat area since 2014 when 56.84 million acres were planted and is above analyst expectations of 47.1 million acres. All wheat acres increased 4 percent from 2017.
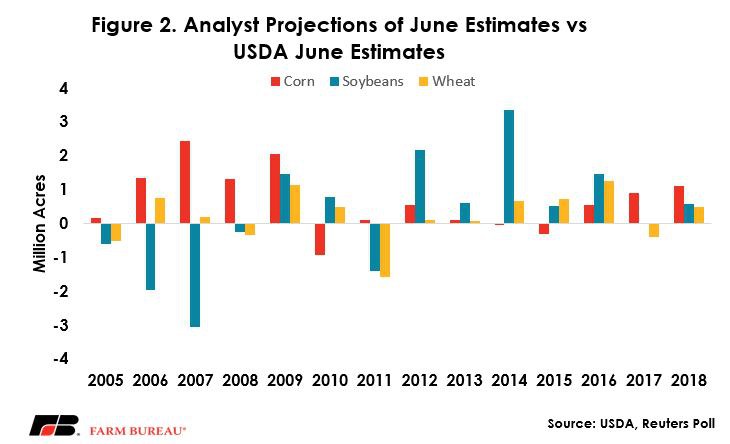
Historically, analysts in the Reuters Poll tend to overestimate the June reported acreage (Figure 2). Since 2005, the overestimation of corn has averaged 665,000 acres, although the largest instance of that error was prior to 2010. Soybeans have been overestimated in the June report by an average of 260,000 acres since 2005, with most overestimation occurring post-2010. Wheat has had the smallest forecast error by the analysts, with an overestimated average of 215,000 acres since 2005.
Changes from March to June
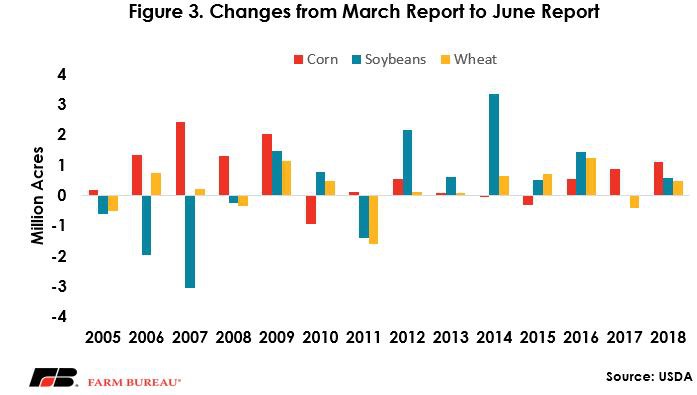
These latest numbers are mostly increased from USDA’s planting intentions report issued in late March. Historically, USDA tends to revise planted acres upward from the March report, with 2018 seeing an increase of 1.1 million acres in corn, 575,000 acres in soybeans and 480,000 acres in wheat. On average, since 2005, USDA has increased the acres from the March report to the June report by approximately 670,000 acres in corn, 250,000 acres in soybeans and 215,000 acres in wheat. However, in the last five years soybeans have been revised by an average of nearly 1.2 million acres.
State-by-State Comparison
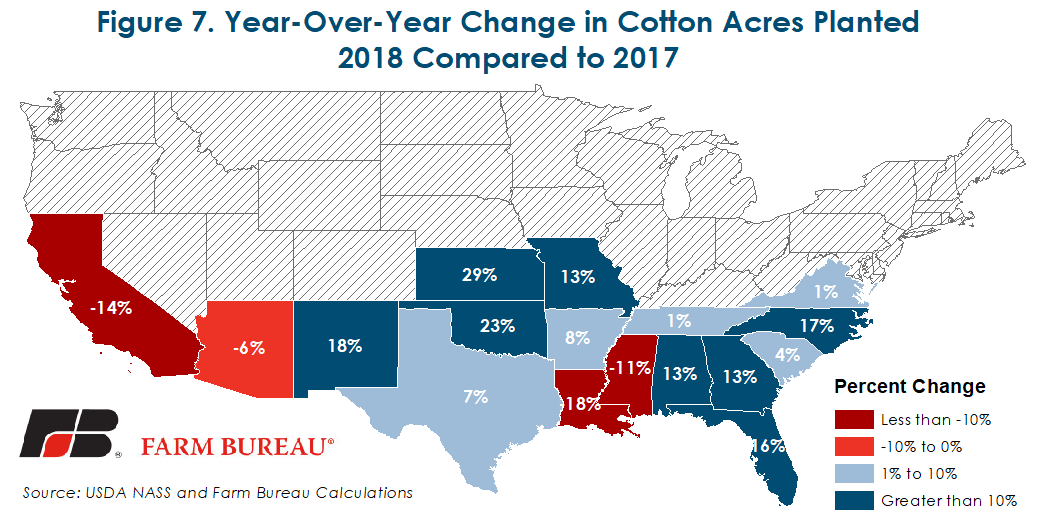
Compared with last year, planted acres in corn are down or unchanged in 31 of the 48 states, down 1 percent overall. For soybeans, planted acres are down or unchanged in 14 of the 31 estimating states and down 1 percent overall. All wheat planted area is up 4 percent from 2017. Of the 47.8 million acres, 32.7 million acres are winter wheat, 13.2 million acres are other spring wheat and 1.9 million acres are Durum. All cotton planted area for 2018 is up 7 percent over last year.