The Dairy Case Is More Competitive Than Ever

photo credit: AFBF
According to USDA’s Economic Research Service, per capita consumption of fluid milk was a record-low 18 gallons per person in 2016, and it’s expected to remain low with fluid milk sales in June 2018 down 4 percent from prior-year levels and down 2 percent year-to-date. At the same time, household scanner data from Information Resources Inc. suggest that sales of plant- and nut-based beverages will reach a record high in 2018.
A recent analysis by USDA using IRI data revealed that the market share of plant-based milk analogs, i.e. imitation milk made from almonds, coconut or soy, rose from 5.7 percent in 2013 to 7.6 percent in 2015. USDA, however, has not recently updated the market share information of these plant- and nut-based beverages. To provide insight on sales trends for these products since 2015, IRI scanner data from 2015 to July 2018 was used to estimate market shares of dairy and plant- and nut-based beverages, review regional trends in plant- and nut-based beverage consumption and estimate the prices of the competing products.
The Rising Share of Plant- and Nut-Based Beverages.
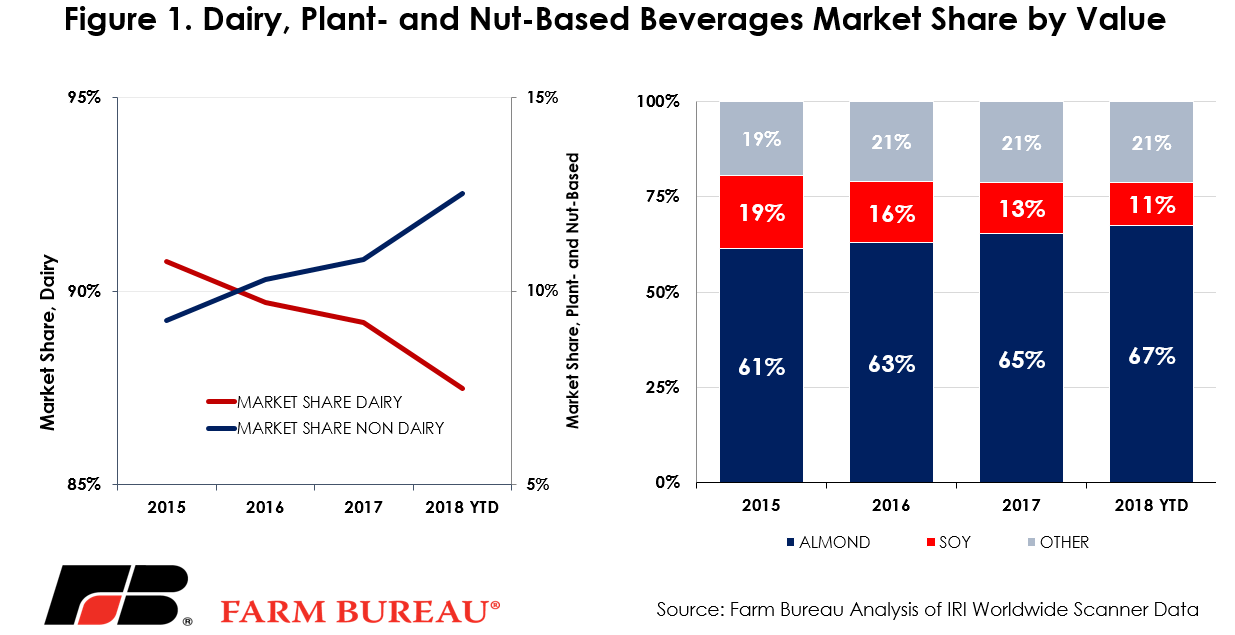
According to Farm Bureau analysis of IRI household scanner data, in 2017, over $1.6 billion dollars of plant- and nut-based beverages were sold in the milk case. These sales were up $141 million, or 9 percent, from 2015 levels. On a value basis, the market share of nut- and plant-based beverages has increased from under 10 percent in 2015 to over 13 percent through July 2018. During this same time, the market share of traditional milk beverages has dropped from over 90 percent in 2015 to under 87 percent in 2018.
These market shares include only nut- and plant-based beverages that are sold in the dairy case right alongside, and directly competing with, refrigerated milk. There are also nut- and plant-based beverages that are shelf-stable and labeled “ready to drink.” When including those additional beverages, the market share grew from 13 percent in 2015 to 16 percent through July 2018, with over $2.1 billion in annual sales in 2017.
Within the category of plant-and nut-based beverages, almond beverages represented 67 percent of the market through July of 2018, up from a 61 percent market share in 2015. The growth in almond beverages has likely come at the expense of soy-based beverages and traditional milk. The market share for soy-based beverages has declined from 19 percent in 2015 to approximately 11 percent through July of 2018. Figure 1 highlights the market shares of dairy, plant- and nut-based beverages from 2015 to July of 2018.
Where Have These Products Been Catching On?
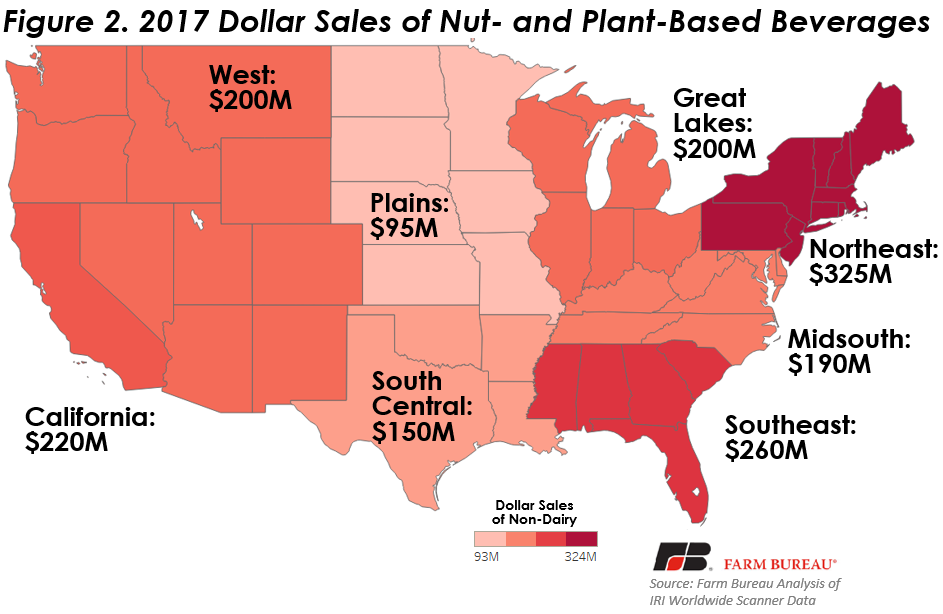
Regionally, sales of nut- and plant-based beverages tend to be concentrated more where urban populations are centered. The Northeast region leads the way, with $325 million in sales, followed by the Southeast and California at $260 million and $220 million, respectively. The Plains region and the South-Central region see the lowest sales at $95 million and $150 million, respectively. Figure 2 highlights the sales of refrigerated plant- and nut-based beverages by region using household scanner data.
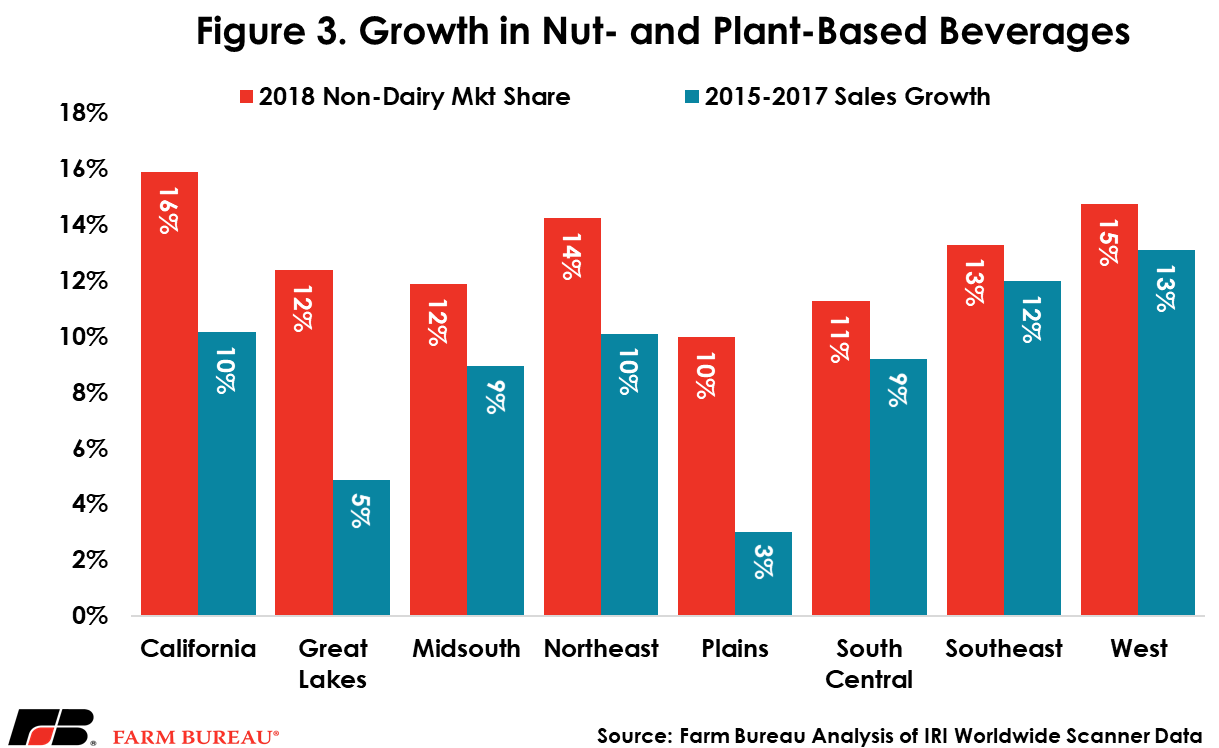
In terms of market share, these products enjoy the highest share in California, at 16 percent. This is followed by the West and the Northeast at 15 percent and 14 percent, respectively. Like the U.S. average, in all these regions almond-based beverages have the largest market share. For the first half of 2018, almond-beverage market shares ranged from a low of 66.2 percent in California to a high of 69.1 percent in the Southeast. Sales growth from 2015 to 2017 was highest in the West and Southeast. The lowest growth was seen in the Great Lakes and the Plains. Figure 3 highlights the market share and sales growth of plant- and nut-based beverages by region.
Plant- and Nut-Based Beverages Command Large Premiums
IRI scanner data includes the sales volume in units as well as the sales in total dollars. Using the sales volume and value a per-unit value was calculated. It should be noted that the per-unit value is a calculated value across all different product container sizes. They do not represent the cost of, say, a gallon of milk. The per-unit values were then compared to approximate relative prices and premiums. During 2017, IRI scanner data and Farm Bureau analysis revealed that nut- and plant-based beverages were sold at a substantial premium to traditional whole-fat dairy milk.
During the first half of 2018, the per-unit value of refrigerated plant- and nut-based beverages was 75 cents per pint for almond beverages, 78 cents per pint for soy beverages and 84 cents per pint for coconut beverages. Comparatively, skim and low-fat milks were 43 cents per pint, flavored milks were 73 cents per pint and whole milk was 44 cents per pint. As evidenced, these nut- and plant-based beverages carry premiums well above the prices for traditional milk.
Figure 4 shows the relative prices of several of these beverages, as well as traditional milk as a percentage of whole milk prices for the U.S. For example, in 2017, almond beverages in the dairy case sold at a 71 percent premium to traditional whole milk. This means that if a consumer were to spend $1 on whole milk, they would pay $1.71 for the same amount of almond beverage. It is a similar story for many of the nut- and plant-based beverages, with the premium ranging from 71 percent to 113 percent for other milk substitutes.
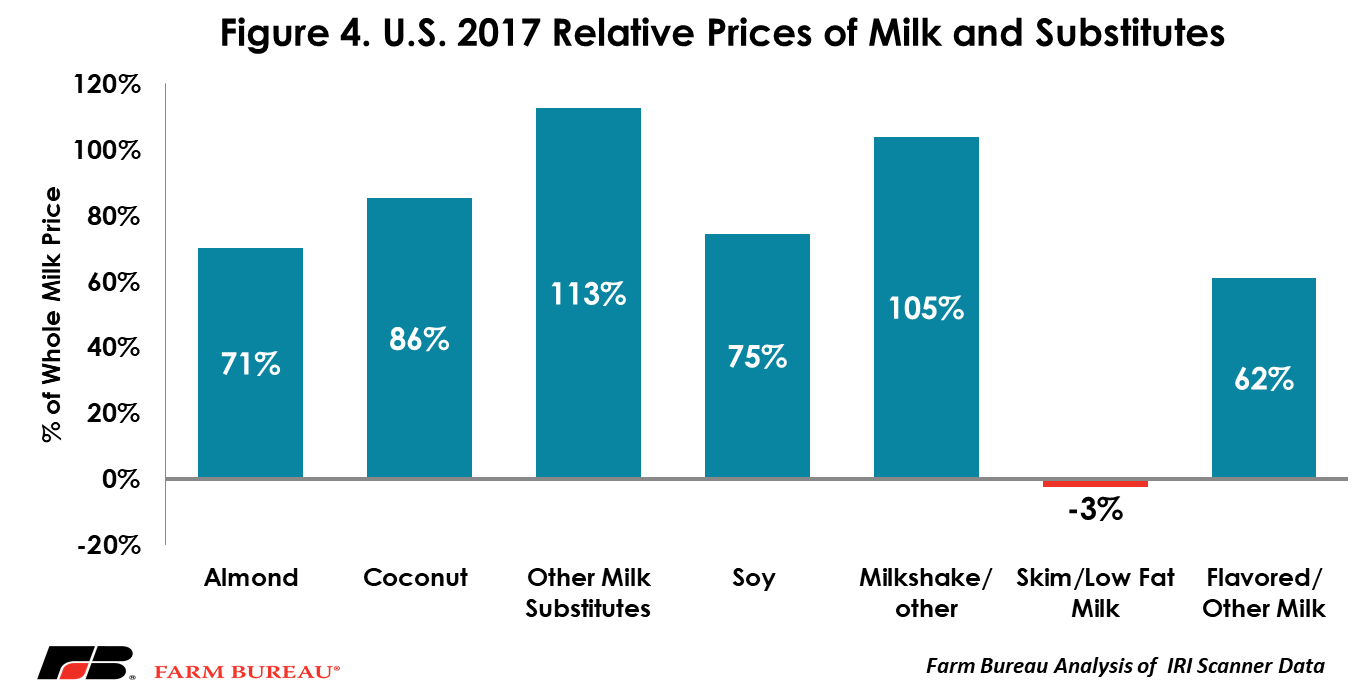
These substitutes are not the only products selling at a premium, with flavored and other milk (such as buttermilk) fetching a 62 percent premium to whole milk. Skim and low-fat milk are the only products to be sold at a discount to whole milk – likely due to the lower fat content and lower demand by consumers (Trends in Beverage Milk Consumption).
Importantly, while these products carry a substantial premium over conventional dairy beverages, they also have similar price co-movement, meaning lower fluid prices are correlated with lower prices for plant- and nut-based beverages. While supply conditions in these markets are independent, since they are co-located in the dairy case alongside traditional milks these products must remain somewhat price competitive. Thus, as milk prices have declined in recent years, so too have the prices for nut- and plant-based beverages.
Since 2015, the calculated per unit value of traditional milk has declined by an average of 8 percent. Over this same period, the calculated per unit value of almond beverages has declined by 5 percent, the value of soy beverages has fallen by 2 percent. Coconut beverages have increased in value by 13 percent since 2015.
Summary
Nut- and plant-based beverages have experienced rapid sales growth in recent years and now represent over $2 billion in annual sales volume. When including shelf-stable beverages, the market share of these nut- and plant-based products now exceeds 16 percent and is expected to grow in the coming years. For dairy farmers and processors monitoring this trend, the key takeaway is that the refrigerated dairy case is more competitive than ever before.