What the Transportation Plan Could Mean to Rural America
TOPICS
Transportation
photo credit: Mark Stebnicki, North Carolina Farm Bureau, Used with Permission
Infrastructure was a significant topic of discussion during the president’s 2018 State of the Union address. The administration has been teasing an infrastructure plan for over a year, but this year’s SOTU, as well as documents released and leaked from the White House, add some meat to the bone, and begin to tell us what an infrastructure plan might ultimately mean for rural America. Based on the outline, rural America should perk up.
During the SOTU the president acknowledged the poor state of infrastructure in the United States and promised to help advance a plan that would generate at least a $1.5 trillion investment to rebuild and repair basically all things that move America. The speech was limited in detail, it was the SOTU after all, but immediately following the speech the White House released a two-page press document that gave a few more details.
The release highlighted that one out of every five miles of U.S. highway pavement is in poor condition. And in rural America don’t we know it. According to the Department of Transportation’s latest Status of the Nation’s Highways, Bridges and Transit report, 74% of the nation’s bridges, 73% of the 4 million miles of public roads, and 33% of all vehicle miles traveled are in rural areas. When our roads and bridges are in disrepair, we feel it.
The latest figures floating put federal funds for infrastructure upgrades at $200 billion. While $200 billion is a lot of money, it doesn’t take a math whiz to realize that it’s a far cry from the $1.5 trillion investment mentioned during the SOTU. That means states will be incentivized to work with local and private investment partners for completion and operation of projects under this program. Many transportation experts have highlighted over the years that public-private partnerships are most attractive in large population centers with lots of vehicle miles. In other words, perhaps not a great fit, by and large, for addressing rural transportation issues.
However, the release also laid out the president’s plan to dedicate 25 percent of the federal funds for rural infrastructure needs, prioritized by state and local leaders. These funds will go toward rebuilding roads, providing clean water to rural families and businesses, expanding broadband access, and supplying affordable, reliable power. If we assume the federal funds available will indeed be $200 billion, rural America could see a $50 billion infrastructure injection.
The above are the elements that the official release cemented. However two weeks ago a leaked six-page document purportedly gave more details about the funding principles envisioned for the infrastructure plan. The next few paragraphs and maps draw from details contained in that document and carry the significant caveat that the document is not an official one. However, it is worth discussing briefly to see what the implications could be if the official plan follows the same parameters.
According to the funding principles document, funding for the Rural Infrastructure Program would fall along the following parameters:
- 80 percent of funds made available for states would be provided to the governor of each state via the following formula
- Ratio based on total rural lane miles in a state in relation to total rural lane miles in all states and a ratio based on the total adjusted rural population of a State in relation to the total adjusted rural population of all states.
- 20 percent reserved for rural performance grants
- States encouraged to do so within 2 years of enactment
- Grants available for up to 10 years after enactment or until funds run out.
- To qualify, states must publish a comprehensive rural infrastructure investment plan (RIIP) within 180 days of receipt of formula funds.
- Funds made available would be distributed as block grants without Federal requirements, but must be used for projects in rural areas with a population of less than 50,000.
- Provides investment designed to address infrastructure needs on tribal lands and U.S. Territories
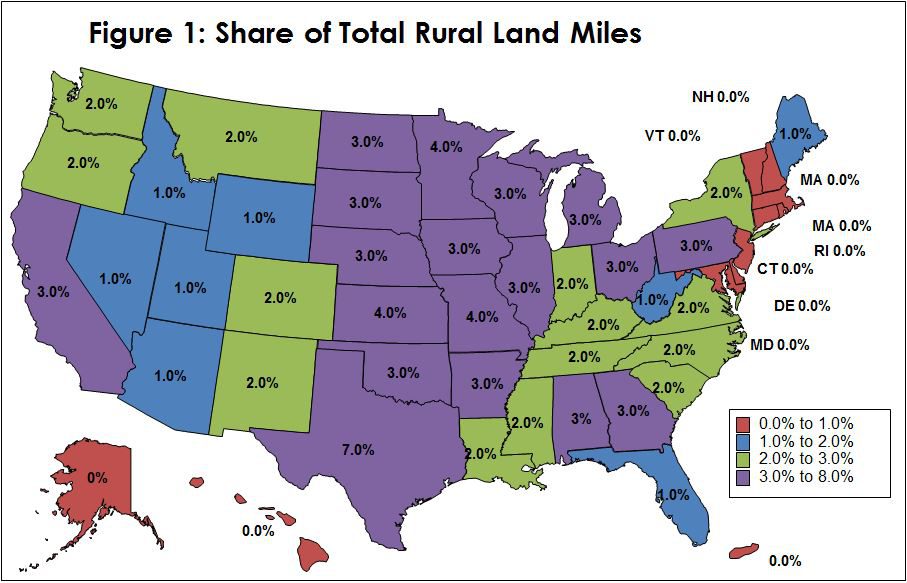
Given these description in the first point, $40 billion in Federal funds would be delivered to the Governors of each state based upon the share of total rural lane miles each state has in relation to the total number of rural lane miles as well as the share of the total U.S. rural population living in each state.
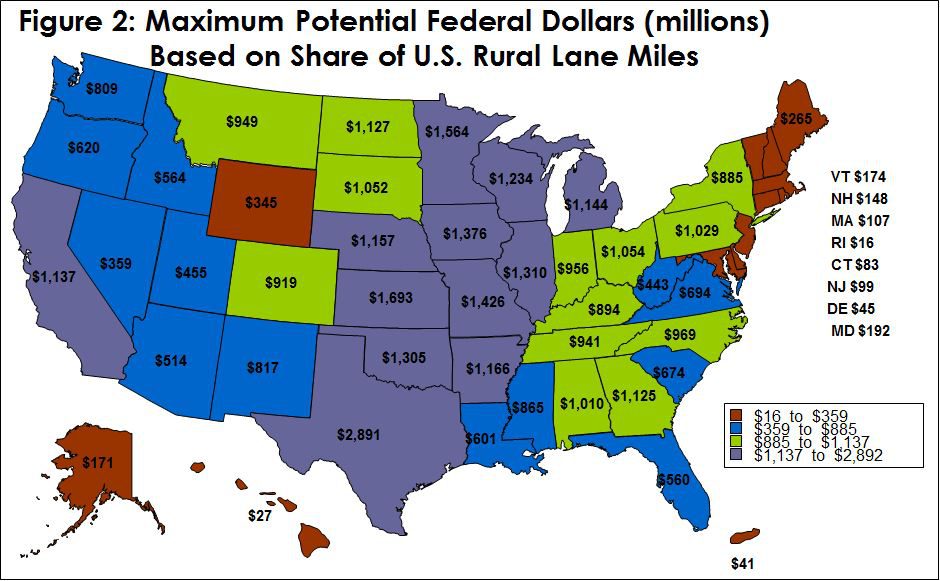
How many total rural lane miles does your state have? Well according to the U.S. Department of Transportation, Federal Highway Administration there are nearly 6.1 million rural lane miles in the United States. The state with the lowest number of rural lane miles is Rhode Island with 2,499. Texas has the most with more than 440,000 miles. Figure 1 gives the percentage share of total rural lane miles in each state according to DOT. Figure 2 is a calculation of the share of the $40 billion in Federal funds that would be available to each state based solely on rural road miles.
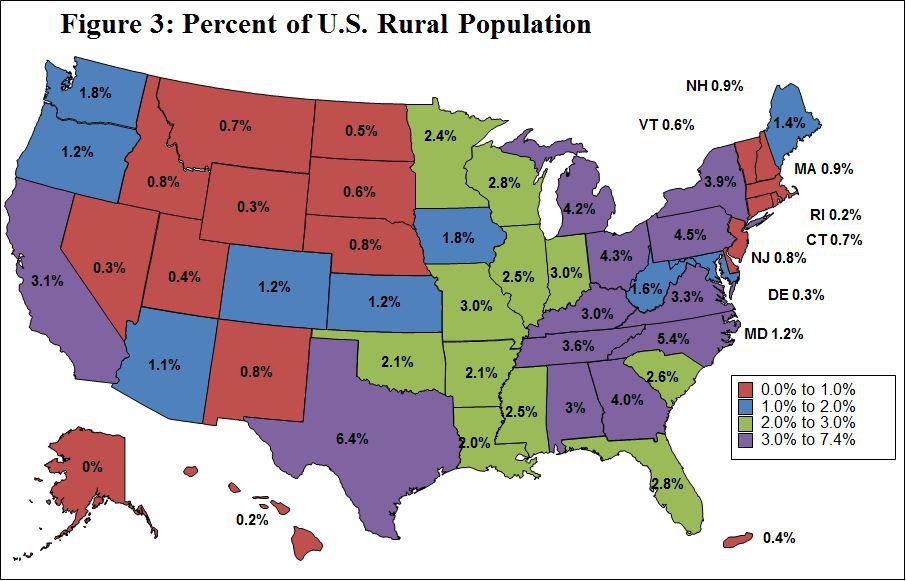
What share of the U.S. rural population lives in your state? According to the 2010 U.S. Census there were 59.7 million people living in rural areas. Once again the state with the smallest rural population was Rhode Island with 97,524 rural residents. Texas again had the largest number of rural residents with more than 3.8 million. Figure 3 gives the percentage share of total rural population in each state according to Census Bureau. Figure 4 is a calculation of the share of the $40 billion in Federal funds that would be available to each state based solely on population.
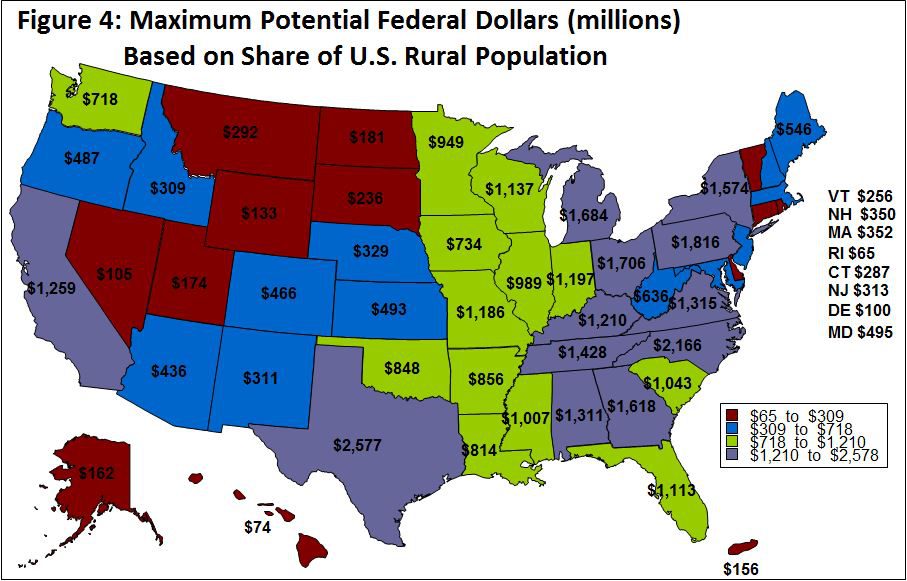
What we see from these four maps is that when you simply compare the percentage of rural miles as a share of total miles and the percentage of rural population to the total number of rural residents the shares are pretty similar. However, when we compare figures 2 and 4, we see that the dollar implications of a decimal point can be pretty significant. For example, using one metric over the other results in a nearly $1.2 billion difference for the state of Kansas. How the administration chooses to use these two calculations will matter quite a bit for our members.
We’re still eagerly awaiting the official details of the plan, but analyzing the leaked funding proposal at least gives us some idea of what we should be looking for. Once again, details (and decimal points) matter.