Dairy Products Pricing Report Captures Small Portion of Sales Volumes

photo credit: AFBF Photo
Daniel Munch
Economist
On August 23, USDA began hearing testimony on proposals to amend the Federal Milk Marketing Order system. The 21 submitted proposals have been categorized under six different subjects by USDA. The second subject, Surveyed Commodity Products, will consider changes and updates to the National Dairy Products Sales Report (NDPSR). Current data reveals the percentage of product volume and number of processing plants captured in the NDPSR remains a small portion of total product sales volumes and total number of plants.
The Federal Milk Marketing Order system establishes provisions under which dairy processors purchase milk from dairy farmers supplying specific marketing areas. One of the primary functions of the federal order structure is the calculation of minimum uniform prices paid to farmers. Prices calculated are intended to reflect fair market prices based on current supply and demand for a variety of dairy products. To accomplish this, USDA surveys the weekly sales price, quantity and moisture content of certain dairy commodities sold by processors who sell 1 million pounds or more of those dairy commodities. The average prices collected from these surveys are then used as the basis for the first step in calculating minimum prices paid to farmers. Higher prices captured in the marketplace for surveyed products would generally lead to a higher price paid to farmers while the opposite is true of lower prices. If the prices of the surveyed products do not adequately reflect the mix and value of products purchased by consumers, the price being paid to farmers may not be reflective of the market and could lead to the undervaluing of farmers’ milk.
Currently, the NDPSR collects data on the products listed below. The data is released no later than 3:00 p.m. EST each Wednesday (unless affected by a federal holiday).
- Salted butter (80% butterfat), fresh or storage, in 25-kilogram and 68-pound boxes meeting USDA Grade AA standards.
- Cheddar cheese in 40-pound blocks, colored between 6 and 8 on the National Cheese Institute color chart, meeting Wisconsin State Brand, USDA Grade A or better standards. Sales of cheddar cheese 4 to 30 days of age.
- Cheddar cheese in 500-pound barrels, white, meeting Wisconsin State Brand, USDA Grade A or better standards. Sales of cheddar cheese 4 to 30 days of age.
- Edible non-hygroscopic dry whey in 25-kilogram bags, 50-pound bags, totes and tankers meeting USDA Extra Grade standards. Dry whey must be less than 180 days old and must not be certified organic.
- Non-fortified, nonfat dry milk in 25-kilogram bags, 50-pound bags, totes and tankers meeting USDA Extra Grade or USPH Grade A standards. Nonfat dry milk must be less than 180 days old.
In addition to these product specifications on packaging and color, USDA also requests that manufacturers exclude product sold under the terms of a forward contract negotiated 30 or more days prior to the transaction, as well as any product sold for export and receiving export assistance payments, e.g., Cooperatives Working Together. Other value-added attributes such as supervised faith-based production or certified organic are also not captured.
Current price reporting does not authorize USDA to survey prices and sales volumes for any other dairy products including protein concentrate, whole milk powder, 640-pound cheddar blocks, unsalted butter, casein, buttermilk powder or lactose. Other dairy products are not authorized because they do not directly contribute to USDA’s current FMMO end-product pricing formulas.
Milk and Dairy Products Captured in the Survey
To determine the volume of milk and dairy products captured by USDA’s mandatory price reporting survey, NDPSR sales volumes were compared to USDA estimates of dairy product production. Figure 1 compares and displays the percentage of dairy product volume captured in the NDPSR in 2000 (when end-product pricing began), 2011 and 2022.
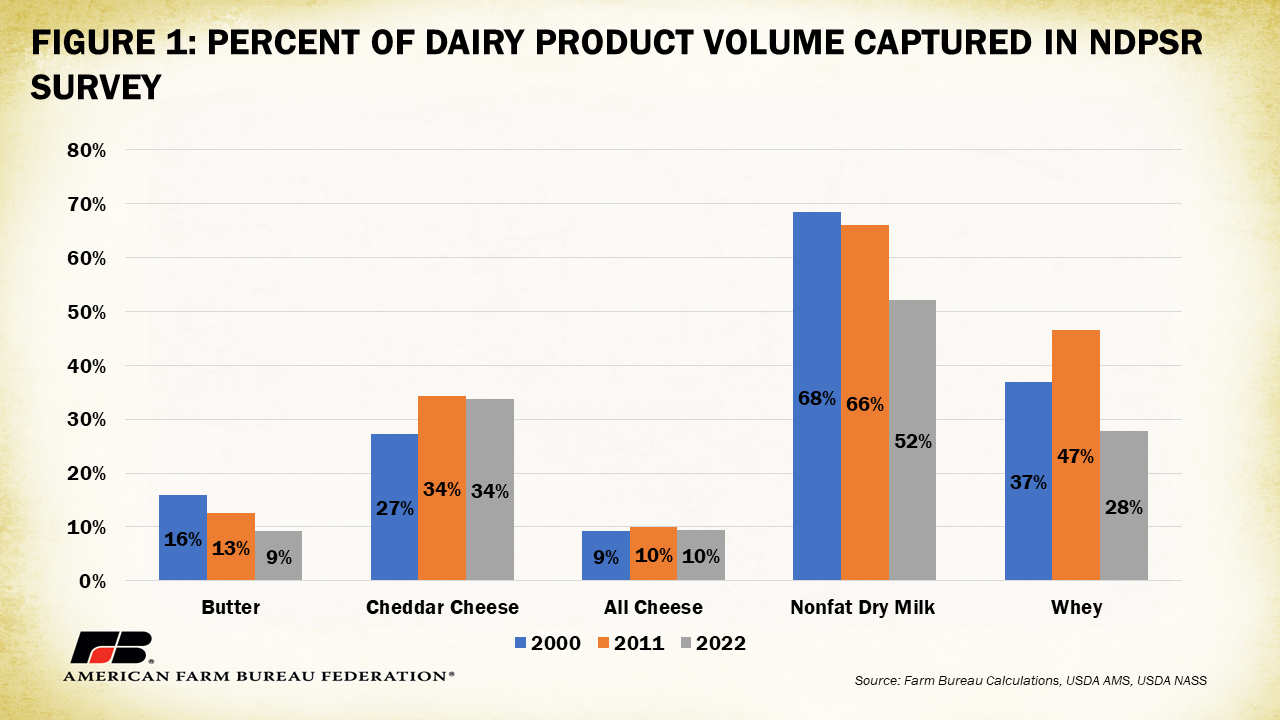
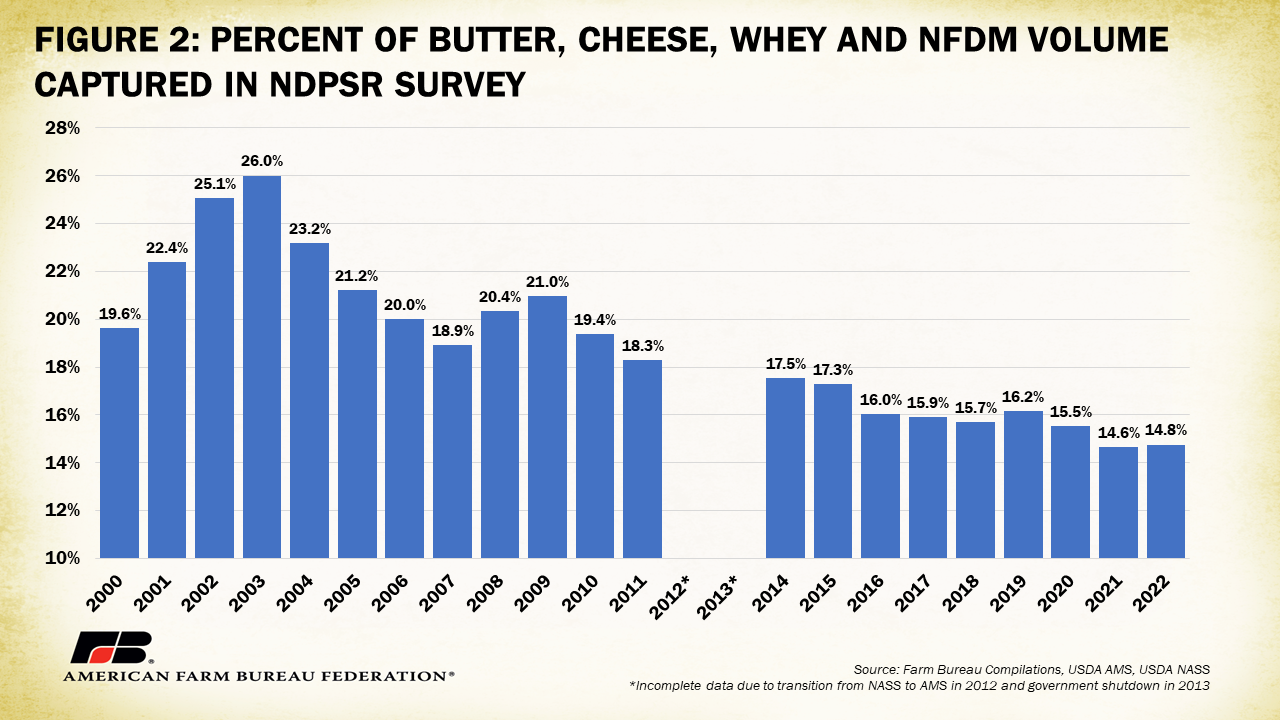
Between 2000 and 2022, the volume of butter captured by the NDPSR dropped from 16% of total production to 9% of total production; the volume of cheddar cheese captured increased from 27% to 34% of total production; the volume of all cheese captured hovered around 10% of total production; the volume of nonfat dry milk captured dropped from 68% to 52% of total production; and the volume of whey captured dropped from 37% to 28% of total production. Combined, for the presented commodities, the NDPSR captured 19.6% of total production in 2000, 18.3% of total production in 2011 and 14.8% of total production in 2022 for an average annual decline of 1.1% in total production captured. On average, less than 20% of the total production of cheese, butter, nonfat dry milk and whey have been captured in the NDPSR survey, with a clear decline in the percentage of butter, whey and nonfat dry milk captured. Considering the various other dairy products that are sold and not included in the NDPSR, the true volume of dairy products captured by the NDPSR is likely much lower than 14.8%. Prior to the Agricultural Marketing Service collecting and reporting the information it was released by USDA’s National Agricultural Statistics Service.
Number of Manufacturers in Survey
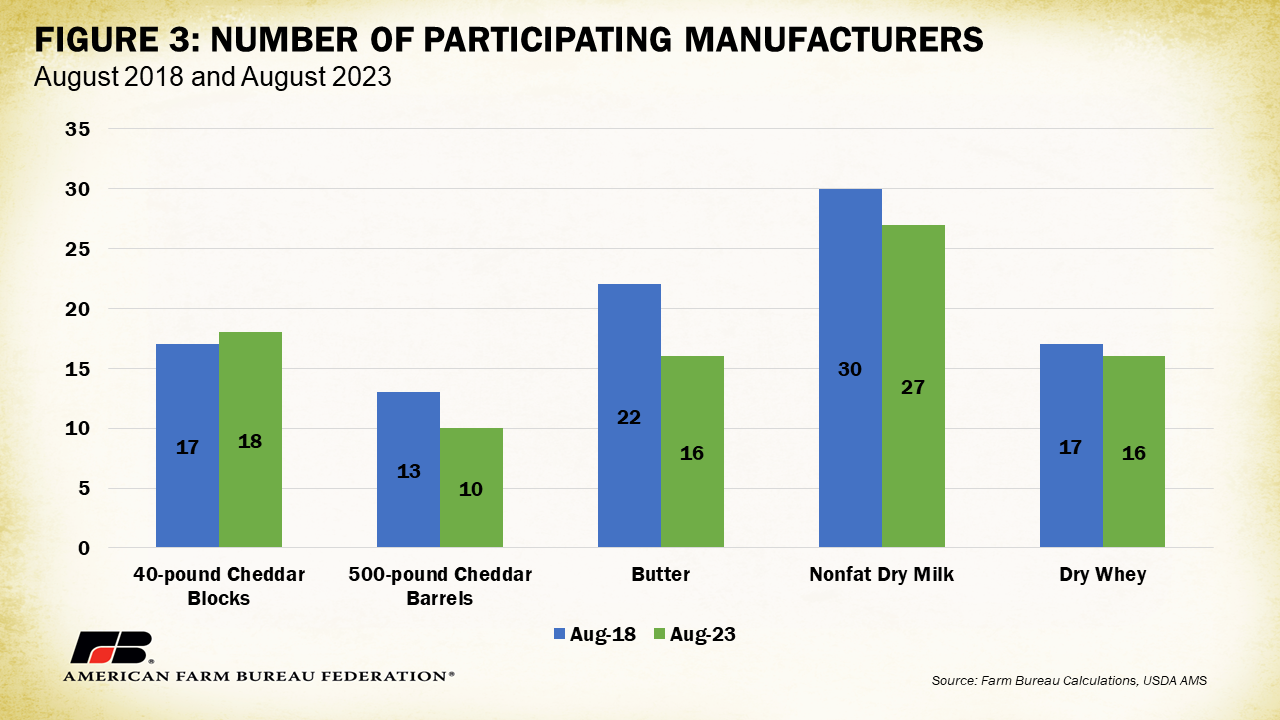
Based on the August 29, 2018, NDPSR, there were 99 reporting entities selling 1 million pounds or more of dairy products as defined by the existing federal order statute. In the August 23, 2023, NDPSR, there were 87 entities that fit the same definition, a 12% decline from 2018, due to closures and industry consolidation. Except for manufacturers reporting on 40-pound cheddar blocks, which increased from 17 to 18, between 2018 and 2023 the number of NDPSR participating manufacturers dropped across the board: those reporting on 500-pound cheddar barrels decreased from 13 to 10, while the number of participating manufacturers reporting on salted butter decreased from 22 to 16 and the number of participating manufacturers reporting on nonfat dry milk dropped from 30 to 27. Those reporting on dry whey dropped from 17 to 16 plants.
According to USDA’s annual Dairy Products report, in 2023 there are 1,201 manufacturers that produced one or more dairy products. Breaking this number down further, there are 93 butter plants, 515 cheese plants, 44 nonfat dry milk plants, 30 dry whey plants and 285 other plants producing dairy products.
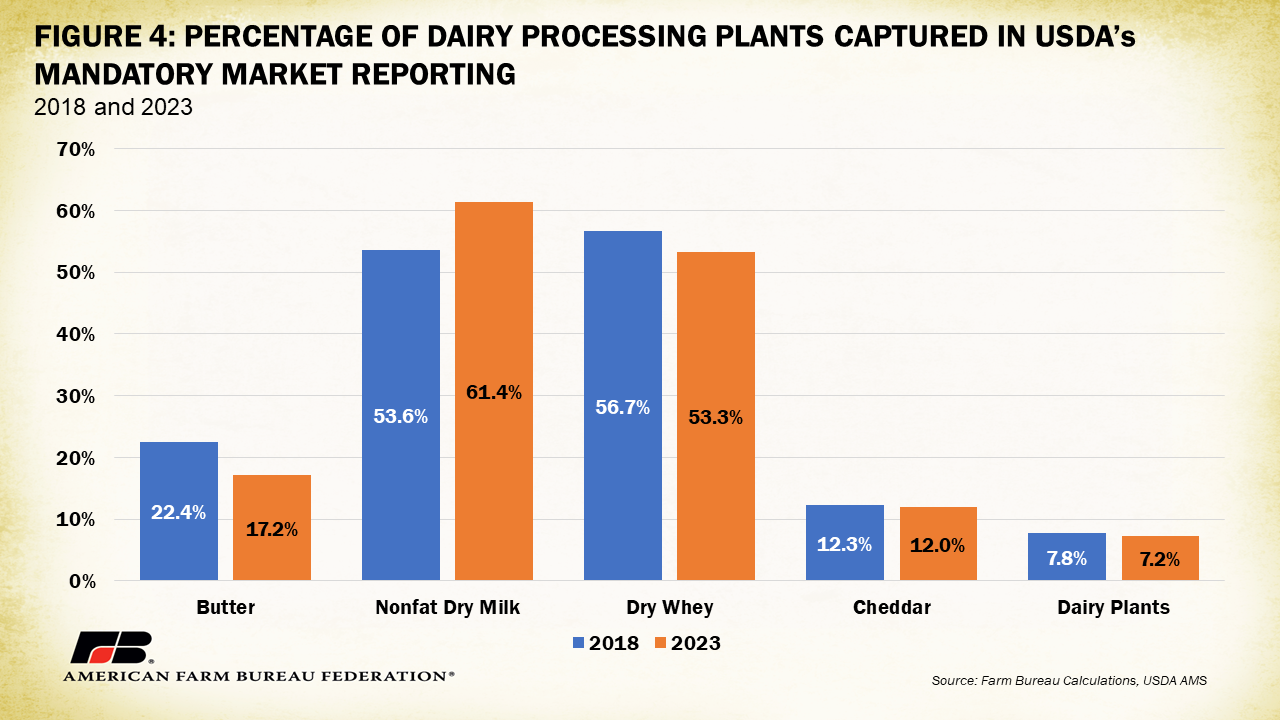
A comparison of the 2023 NDPSR survey to the latest NASS dairy products survey reveals that 17.2% of butter processing plants, 61.4% of nonfat dry milk plants, 53.3% of dry whey plants and 12% of cheddar cheese plants are captured by the NDPSR survey. In total, 7.2% (a drop from 7.8% in 2018) of all manufacturers that produced one or more dairy products are captured in USDA’s mandatory price reporting. This implies that more than 92% of dairy processing plants are not required to report the prices for the dairy products they manufacture and sell.
Data from USDA reveals that a small percentage of the dairy plants in the U.S., and a small percentage of the milk solids and dairy products produced, are captured by USDA’s mandatory pricing survey that is used to determine the regulated value of milk and milk components. Data also reveals that, on average, the portion of production volume captured and total number of plants participating in the survey has decreased over the analyzed period, meaning that the sample size used to reflect market prices has gotten smaller in recent years.
The small share of products captured in USDA’s surveys has led many farmer groups, including the American Farm Bureau Federation (AFBF), to pursue changes to the NDPSR through the current Federal Milk Marketing Order hearing, the usual method for amending milk formula-related rules. For example, AFBF will be testifying on its proposals, 4 and 5, in the federal order hearing notice to add 640-pound blocks and unsalted butter to the NDPSR and associated Class price calculations. The addition of these products is expected to strengthen price discovery, contributing to a broader, more market-reflective basket of products being surveyed. The collection and publication of the prices and volumes would also improve market transparency, which is a key to farmers’ understanding how their milk is marketed.
AFBF is also advocating dropping 500-pound barrels from the survey. This may seem counterintuitive, though currently 500-lb barrels are overrepresented, skewing the cheese price downward. For example, approximately 90% of natural cheese produced in the United States is sold using the CME 40-pound block price as a pricing index, with the remaining 10% indexed to barrel cheese. Barrel cheese represents only an estimated 7% of U.S. manufactured natural cheese meaning its current weight in the NDPSR survey is overrepresented.
Conclusion
The National Dairy Products Sales Report has been an integral part of establishing minimum pricing for dairy farmers since end-product pricing began in 2000. Over this period, less than 20% of the total production of cheese, butter, nonfat dry milk and whey have been captured, with a clear decline in the percent of butter, whey and nonfat dry milk captured by the survey. Additionally, only 7.2% of all manufacturers that produced one or more dairy products are reflected in USDA’s mandatory price reporting as of the latest NDPSR survey. Given these statistics, it is no surprise that farmers have expressed concerns over how the NDPSR may be impacting their milk checks. Survey samples that do not accurately reflect the value of dairy products sold in the market can mean farmers are not receiving the full value of the milk they are producing. These dynamics have also contributed to arguments surrounding make allowances, or the credit within the milk pricing to reflect the cost to process raw milk into value-added products. Though processors have maintained they cannot increase prices without those prices being reflected in the NDPSR, and arguably not retain any hypothetical increase in price, the small fraction of dairy products included in the survey should mean processors can retain value from the numerous products and plants not currently surveyed. In either case, it is important to understand how the NDPSR functions to understand milk pricing under the federal order system.
AFBF’s Federal Milk Marketing Order policy priorities stem from the grassroots policy development process maintained by its many active dairy farmer members. Many of these priorities were also consensus items out of last year’s Federal Milk Marketing Order Forum hosted by AFBF in Kansas City, Missouri.
This article serves as an update to a previous AFBF background document on the NDPSR survey, which can be found here.
Top Issues
VIEW ALL