Enrollment in MPP-Dairy Slips in 2017

photo credit: Right Eye Digital, Used with Permission
John Newton, Ph.D.
Vice President of Public Policy and Economic Analysis
On May 26, 2017, USDA’s Farm Service Agency released Results of 2017 MPP-Dairy Enrollment statistics highlighting state-level participation in the farm bill’s Margin Protection Program for Dairy Producers. For the 2017 calendar year, 20,314 dairy operations covering 138 billion pounds of milk are enrolled in MPP. These totals represent approximately 49 percent of licensed dairy operations and 64 percent of U.S. milk production in 2017. Covered milk and buy-up enrollment in MPP for 2017 is at the lowest level since the program was introduced.
What is the Margin Protection Program?
The 2014 farm bill eliminated milk price safety net programs and introduced the Margin Protection Program for Dairy Producers, MPP. MPP is an insurance-style safety net program designed to protect dairy farmers against declines in the income-over-feed-cost margin, i.e. the difference between milk price and the cost of feed on a dairy.
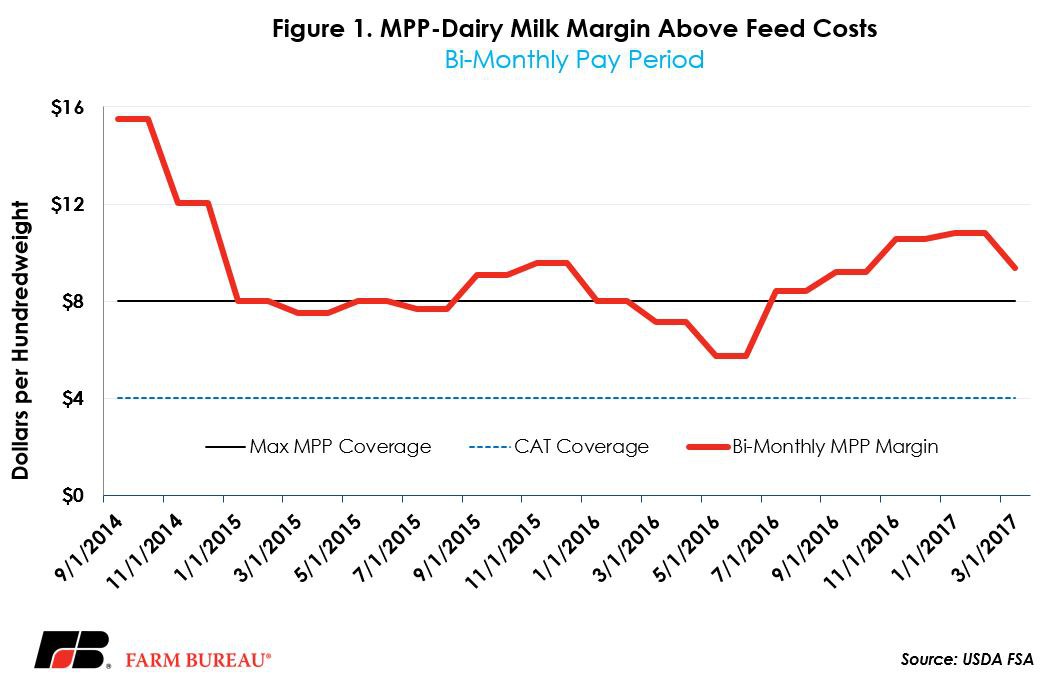
MPP makes payments equal to the difference between the national average margin and a farmer’s selected coverage level. Coverage is available from $4 to $8 per hundredweight and farmers may cover up to 90 percent of their historical milk production history. Figure 1 highlights the MPP margin and the range of coverage options.
Participating dairy operations pay a $100 administrative fee each year, and then pay premiums for coverage above $4. Premiums are lower for farmers covering lower volumes of milk and range from 1 cent per hundredweight to $1.36 per hundredweight for farms covering large volumes of milk.
Once a dairy farmer is enrolled in MPP, he/she may not exit the program for the life of the farm bill (expiration in December 2018). However, each year USDA provides an opportunity for dairy operations to modify their coverage for the upcoming calendar year. For more information on MPP and how it’s working visit AFBF’s Farm Bill Resources page.
2017 MPP-Dairy Enrollment
USDA’s May 10, 2017, World Agricultural Supply and Demand Estimates project 2017 U.S. milk production to total 216.9 billion pounds. Milk enrolled in MPP for 2017 totaled 138 billion pounds of milk and represents 64 percent of U.S. milk production. Milk covered under MPP is down 13 percent from 2016 when 159 billion pounds of milk was enrolled.
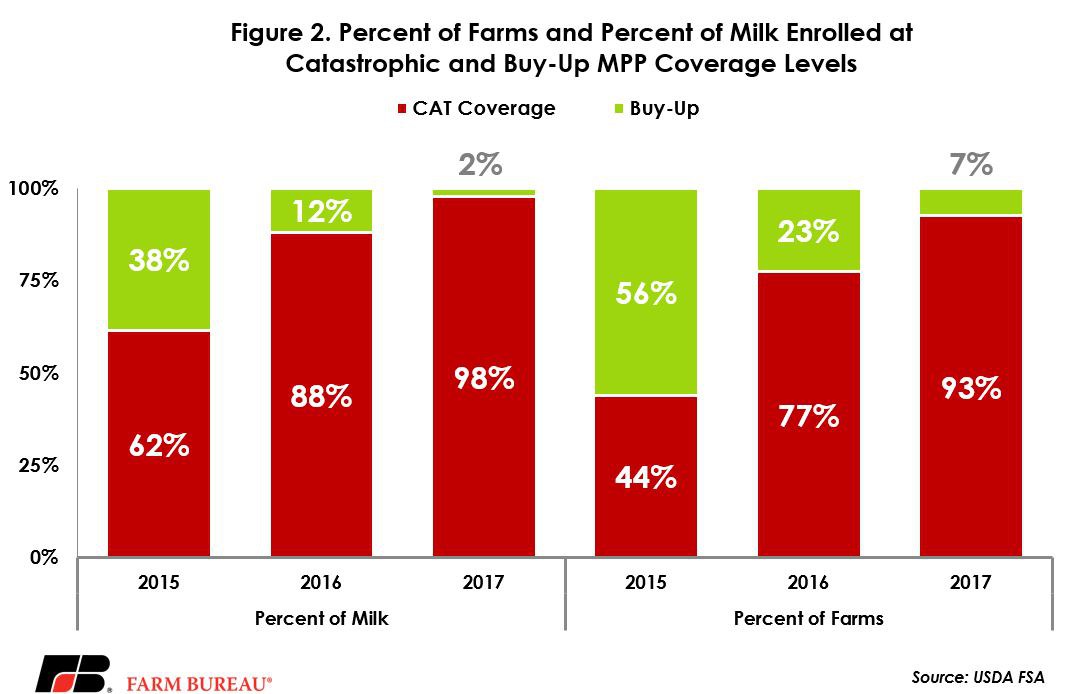
Much of the milk enrolled in MPP for the 2017 coverage year is at the catastrophic coverage level only. Approximately 2 percent of the milk enrolled in MPP is at buy-up coverage levels, i.e. $4.50 per hundredweight and above. This total is down from 2015 and 2016, when 38 percent and 12 percent of the milk was enrolled at buy-up coverage levels, respectively. Of the 3.1 billion pounds of milk with buy-up coverage, 62 percent is enrolled at the $6 or $6.50 per hundredweight coverage levels. Figure 2 highlights the distribution of MPP enrollment at the catastrophic and buy-up coverage levels.
In 2016, USDA reported that there were 41,809 licensed dairy operations in the U.S. USDA’s MPP enrollment data indicates that 20,314 dairy operations have MPP coverage for 2017. This total represents approximately 49 percent of licensed dairy operations. Farms enrolled in MPP during 2017 is down 5,349 operations from 2016, a decline of 21 percent. The decline in enrollment is likely due to farms that have yet to make a coverage election as of May 19, 2017, when the data was compiled, or dairy farm operations that have gone out of business.
Similar to the enrollment of milk, a majority of the farms enrolled in MPP for 2017 are enrolled at the catastrophic $4 coverage level only. Only 1,507 operations, approximately 7 percent of enrolled operations, elected to purchase coverage above $4 per hundredweight. 2017 enrollment at buy-up levels is down from 2015 and 2016 when 56 percent and 23 percent of the farms had coverage above $4.50 per hundredweight, respectively.
Regional MPP Participation Patterns
The distribution of farms and milk in MPP follows closely the distribution of milk production in the U.S. California, the leading milk producing state in the U.S., covered 31 billion pounds of milk in MPP and represents 22 percent of the milk that is enrolled. Wisconsin, the second largest milk producing state, covered 19 billion pounds of milk in MPP and represents 14 percent of the enrolled milk. The top five states in terms of MPP milk pounds covered (California, Wisconsin, Idaho, New York and Texas) represented 43 percent of the milk in MPP. At the farm-level, the top five states are Wisconsin, Minnesota, New York, Pennsylvania and California. They represent 60 percent of the enrolled dairy operations.
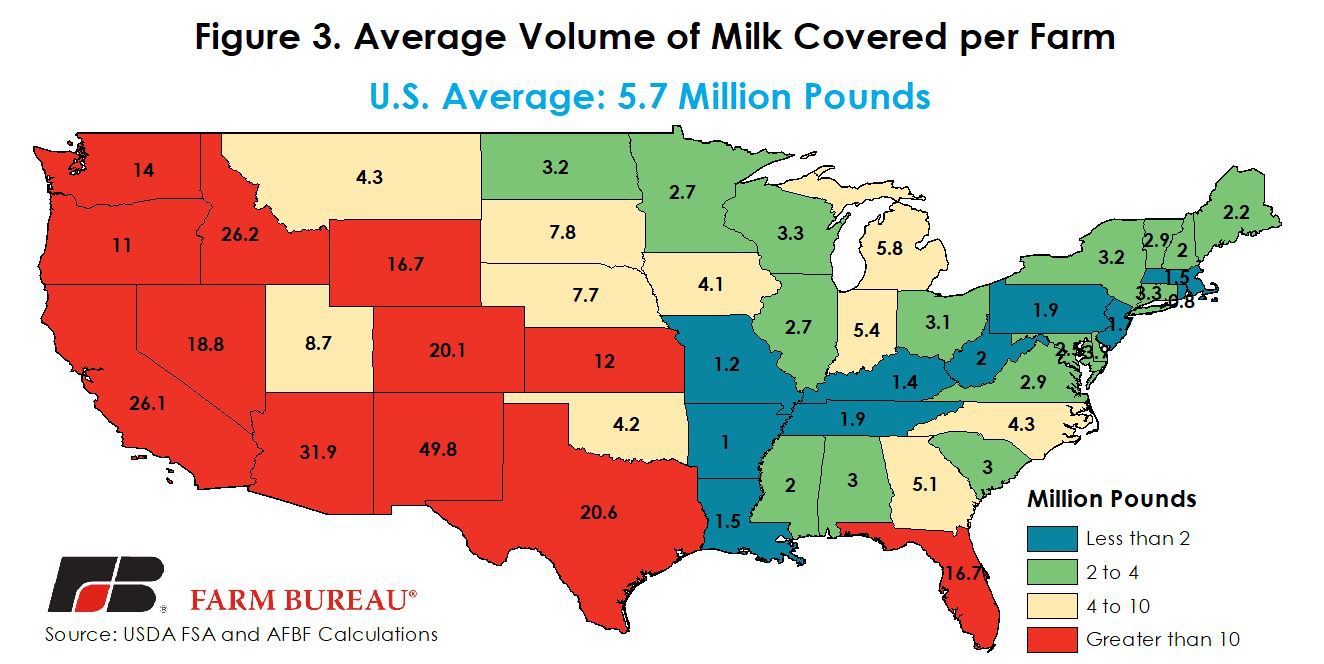
The average volume of milk covered also mirrors the farm demographics of the U.S. dairy industry. In the Upper Midwest and Northeast, dairy operations tend to be smaller, while in western portions of the U.S. dairy operations are significantly larger. Under MPP the average volume of milk covered per farm is 5.7 million pounds but ranges from a low of 784,000 pounds in Rhode Island to nearly 50 million pounds of milk in New Mexico. Figure 3 identifies the average amount of milk covered per farm and by state for the 2017 coverage year.
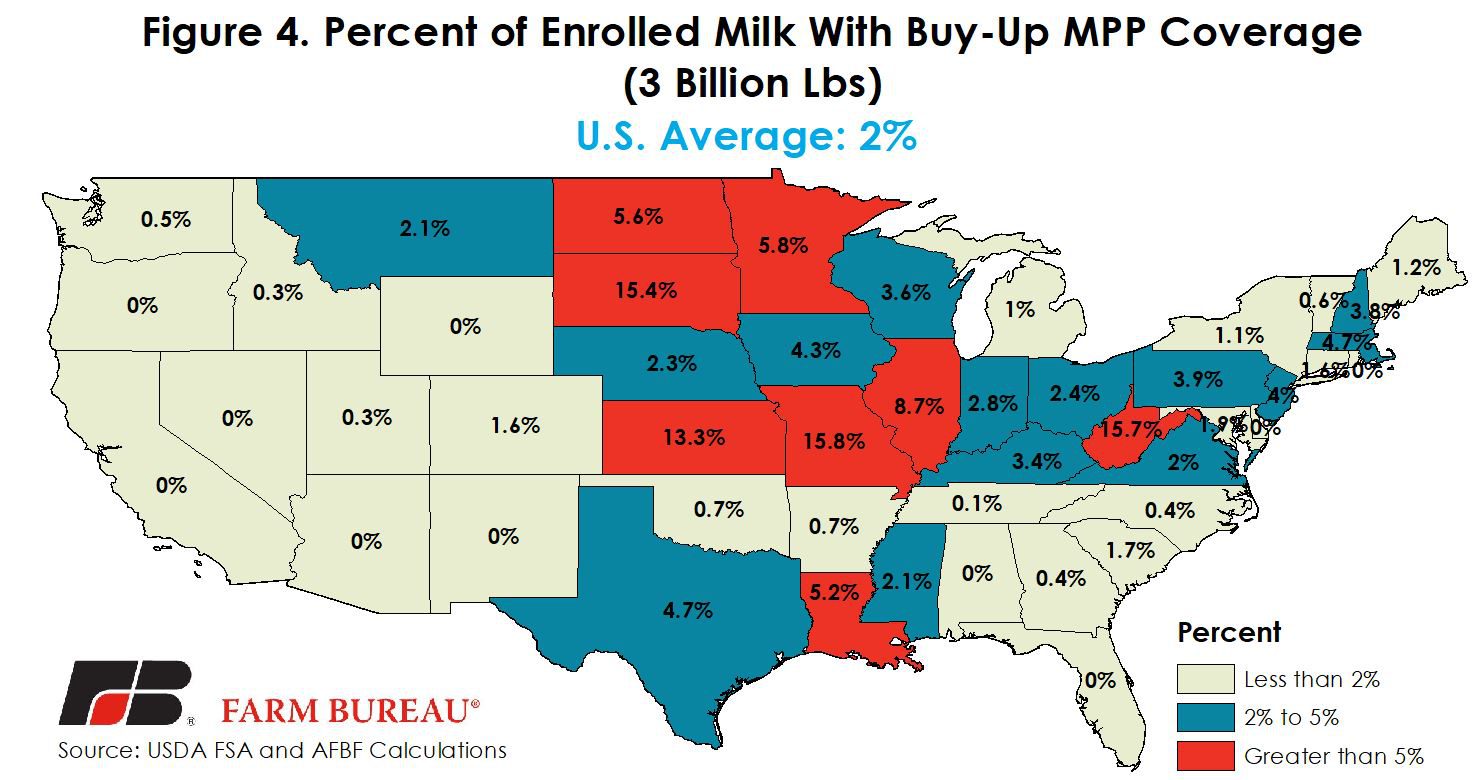
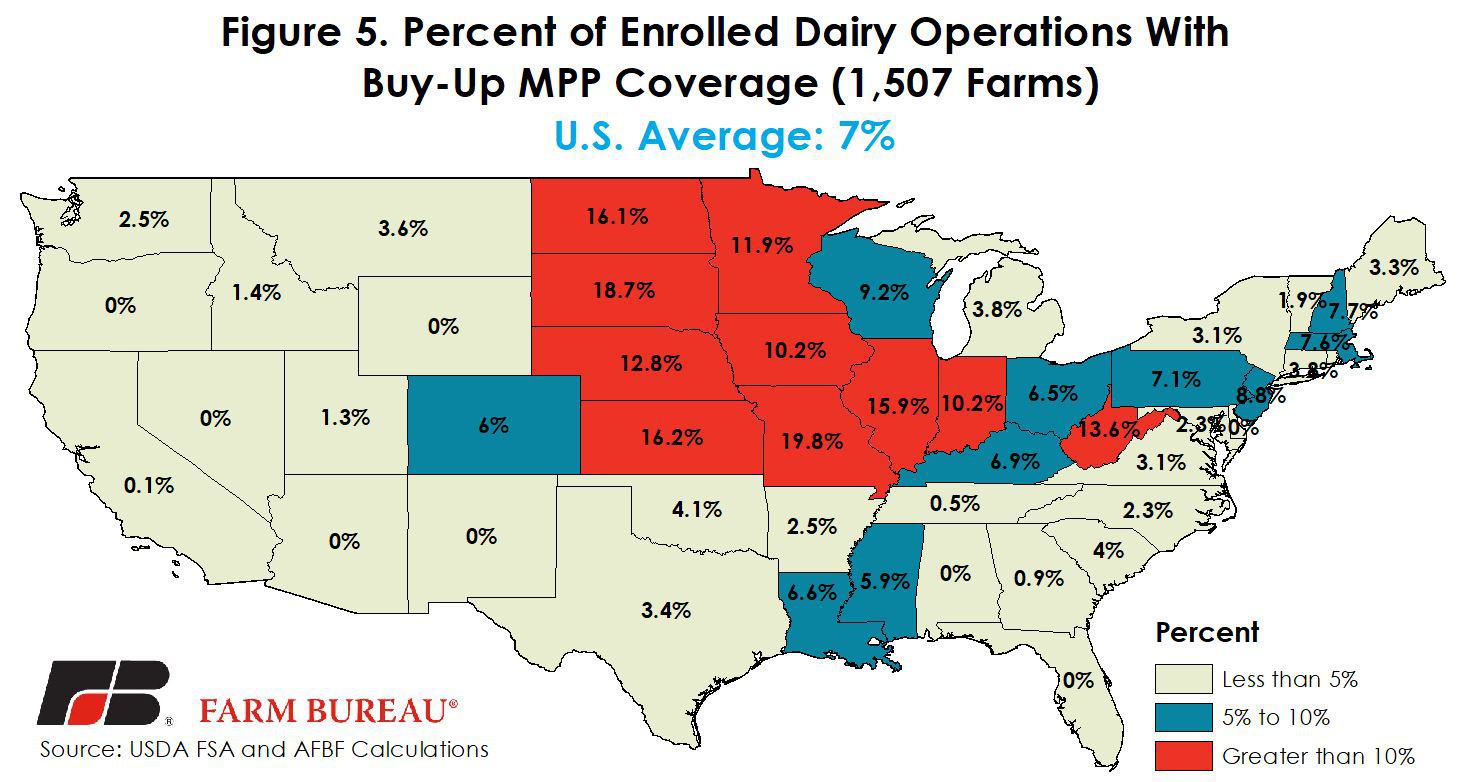
Active participation in MPP, i.e. farms and milk electing higher coverage levels, however, was concentrated in the Upper Midwest and Corn Belt. The percent of enrolled milk with buy-up coverage was as a high of 15.8 percent in Missouri, Figure 4. Similarly, the percentage of farms with buy-up coverage was above 10 percent in many Upper Midwest and Corn Belt states, Figure 5.
Participation Decline Was Expected
The decline in MPP participation was anticipated for a variety of reasons. First, following several years of bumper crops in the U.S., national average MPP feed costs have declined 23 percent since the program was introduced. Feed price risk remains, but the risk of a large increase in feed prices is low due to higher inventory levels in the U.S. and abroad. With feed prices expected to remain low, and improving milk prices, the likelihood of MPP making program payments in 2017 was low. Thus, with a low probability of payments in 2017, many farms opted for the free catastrophic coverage level of $4 per hundredweight. Currently, USDA’s MPP decision tool places a 1 percent probability on MPP falling below $8 per hundredweight during 2017.
Second, while the program is working as designed by Congress, it has not met the expectations of dairy producers. Since 2014, milk prices have declined substantially and are now 33 percent lower than when MPP was first introduced. MPP offered little protection because the safety net is based on the margin and not the price of milk. The combination of lower milk and feed prices meant that the MPP margin did not fall substantially below the coverage levels available. MPP made program payments in the spring of 2015 and 2016, as the margin fell to $5.76 per hundredweight, but for many participating operations, the payments did not exceed the premiums and administrative fees paid by farmers. For the 2015 and 2016 coverage years, AFBF estimates that dairy farmers paid approximately $100 million in premiums and administrative fees, and received $12 million in program payments.
The combination of a more favorable outlook in dairy markets for 2017, and the poor actuarial performance of MPP to date contributed to the decline in MPP participation in 2017. The enrollment period for 2018 coverage will open in July and remain open until the end of September.
Top Issues
VIEW ALL