Port Congestion Peaks Again, but there is Likely a Different Culprit this Time
TOPICS
Port Congestion
photo credit: Getty
Veronica Nigh
Former AFBF Senior Economist
Over the last two plus years, the U.S. economy has fought its way through a steady stream of harmful supply chain disruptions. This variation has challenged production and inventories in every facet of the economy. Perhaps the place where this volatility in purchases could be most easily observed has been the ports, where the dramatic changes in consumer behavior were observed in seemingly mile-high stacks of containers and vessels waiting to be unloaded. Observers hoped that port congestion previously had peaked at the beginning of 2022 and appeared to finally be easing in May and early June, but now things are worse than ever. Is erratic consumer spending to blame again? Or is something more familiar to blame? We dig in.
Consumer Spending – A Wild Ride
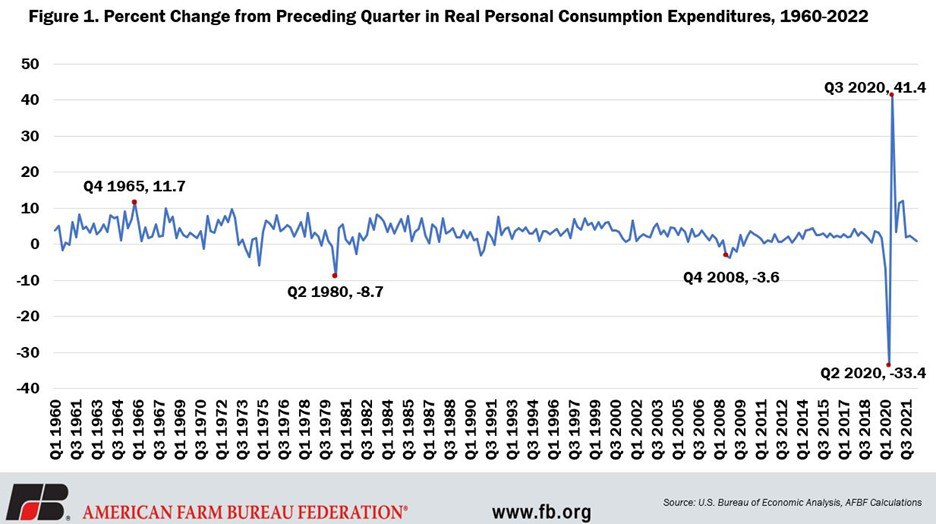
Quarter-over-quarter changes in real consumer spending in the United States on goods and services averaged 3.25% between 1960 and 2019. Then the COVID-19 pandemic hit, obliterating both previous highs and lows – all in the course of six months. In the second quarter of 2020, the change in U.S. consumer spending reached a record-low of -33.4%. The previous record was the second quarter of 1980, when consumer spending dropped 8.7% relative to the first quarter of 1980. Then before the dust could settle, consumer spending in the third quarter of 2020 sky rocketed to an all-time high of 41.4% relative to the second quarter of 2020. The previous record was an 11.7% increase in the fourth quarter of 1965, relative to the third quarter of 1965. For further context, during the Great Recession, which lasted from December 2007 to June 2009, the largest decline in quarter-over-quarter spending of 3.6% occurred in the fourth quarter of 2008.
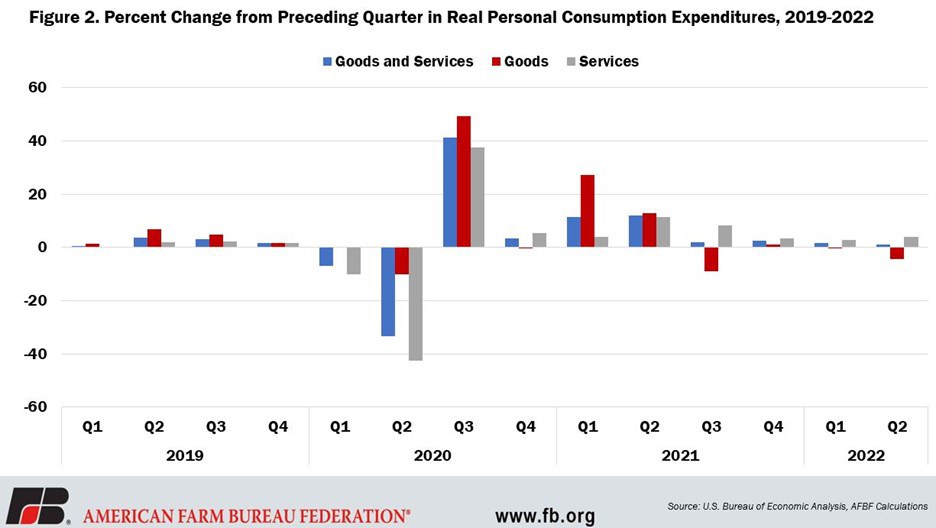
When consumer spending over the last three-and-a-half years is further broken down between goods and services, even more interesting things shake out. We see that the decline in spending on services really drove the dramatic decline in spending in the second quarter of 2020. Spending on services declined by 42.4%, while spending on goods declined by a much more modest 10%. The surge in spending in the third quarter relative to the second quarter was split more evenly than the decline – spending on services increased by 37.5%, while spending on goods climbed by a remarkable 49.5%. In Figure 2, we see that spending on goods relative to the quarter previous were also high in the first and second quarters of 2021, as consumers were cooped up at home.
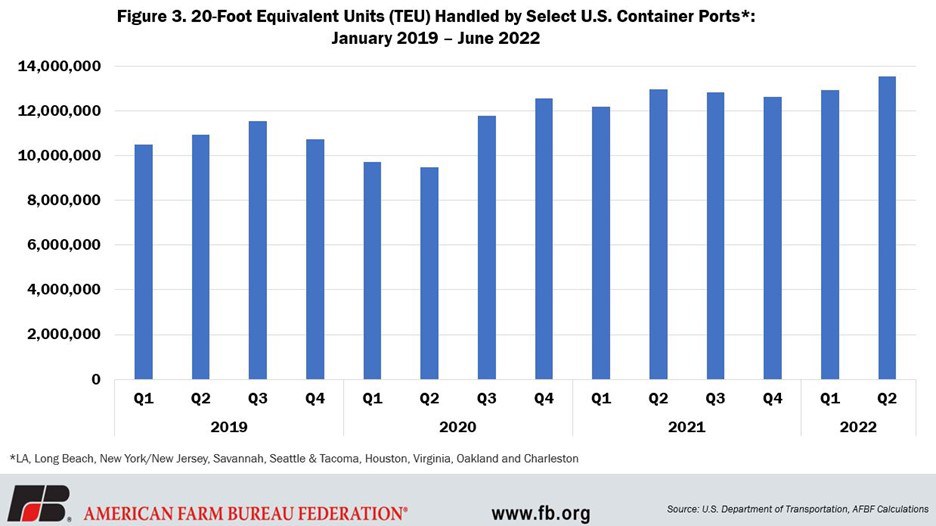
When consumers spend money, they tend to purchase a mix of both domestically and internationally produced goods, and thus enters the discussion of port activity. The turbulent consumer spending on goods can be seen in the throughput of the top container ports in the U.S. (LA, Long Beach, New York/New Jersey, Savannah, Seattle & Tacoma, Houston, Virginia, Oakland and Charleston). Total throughput of loaded and empty 20-foot equivalent units in the second quarter of 2020 was 13% lower than the second quarter of 2019. Then in the third quarter, throughput increased 25% relative to the second quarter of 2020 and was even up 2% relative to the third quarter of 2019. Container throughput never really slowed down after that giant leap in the third quarter of 2020. This resulted in port capacity and related warehouses quickly reaching capacity, loading and unloading times climbed and boats began piling up off the coastlines.
In January and February 2022 there were just under 150 container vessels waiting off the coastlines. Two-thirds were in the Los Angeles/Long Beach queue. As mentioned earlier, by late spring congestion finally showed signs of receding. According to American Shipper, there were 92 container ships waiting to unload on June 10. Then, the tide turned again. As of the end of July, the number of waiting vessels reached 153. This time, however, 62% of the total (94 ships) are off the East and Gulf Coast ports, with counts up in both Savannah (43), Houston (24) and New York/New Jersey (18). Today, 38% of total vessels waiting are off the West Coast, where queues have climbed in Vancouver and Oakland, not Los Angeles/Long Beach, which is markedly dissimilar to the previous build-up.
Given the bite inflation is beginning to take out of consumer spending, spending in the first quarter and second quarters of 2022 were down 0.3% and 4.4% relative to the previous quarter, this increase in port congestion may have a different driver – fear of the disruption that a good, old-fashioned labor contract negotiation can cause. On July 1, 2022, the current labor contract between the International Longshore and Warehouse Union and its employer group, the Pacific Maritime Association , expired. PMA represents employers at 29 West Coast ports. According to an Ag Web article, “both sides have pledged to continue normal operations at ports until an agreement is reached.” But traders saw how things could go south quickly back in 2014 when the contract last expired and seem to be making arrangements to avoid a West Coast bottleneck if negotiations turn sour.
The 2014-2015 Contract Negotiation
The last time the labor contract between the ILU and PMA expired in July 2014, it took more than nine months to reach a new contract. The lengthy dispute included work slowdowns and lockouts that created a massive traffic jam on the docks. In the end, President Obama ended up sending both the Labor Secretary and Commerce Secretary to mediate the dispute and help the parties finally reach a compromise. Over the following weeks the congestion was dispersed, but damage had been done.
An analysis by economists at the Federal Reserve Board later pointed out some trade was likely lost irremediably, such as perishable agricultural exports, whereas other goods were rerouted, came in at a later date, or were sold to domestic consumers. Exports via West Coast ports fell 20.5% in Q1 2015, while imports fell 9%. These are substantially larger declines relative to previous quarters and bigger declines than in shipments through any other mode of transportation. Ultimately, the Fed report found that "the West Coast port disruption likely reduced real export growth in the first quarter by 1.5 percentage points. In terms of the contribution to net exports to real GDP growth, this would be equivalent to a drag of 0.2 percentage point in the first quarter.”
Today’s Congestion
Having learned from the events of both the 2014-15 contract negotiation and the lesson of the last two years regarding the danger of disruption when relying on a single gateway into the U.S., today’s increased activity at Gulf and East Coast ports seems to be the actions of exporters and importers re-routing their supply chains, anticipating the worst. But what could increased Gulf and East Coast port congestion mean for agriculture?
The Ports of Savannah, Houston and New York/New Jersey are the sixth-, seventh- and eighth-largest ports for containerized waterborne ag exports. The ag products exported via containers are traditional bulk commodities, more often they are high-value consumer-oriented products. The congested container terminals in the ports of Savannah, Houston and New York tend to export high-value semi-processed and processed products. The U.S. exported more than $113 billion in processed products last year.
The Port of Savannah is the fourth-largest container port for all cargo in the United States and sixth-largest port for containerized waterborne agricultural exports. The top commodities were poultry (37% U.S. total), cotton (20% U.S. total) and animal feed (3% U.S. total), representing almost 60% of total agricultural exports through the port. The Port of Savannah was the top U.S. port for waterborne poultry. The top destination markets were China, South Korea and Vietnam.
Houston is the busiest container port in the Gulf of Mexico. In 2017, the Port of Houston ranked seventh in the nation for total waterborne agricultural exports and tenth for containerized exports. The top commodities included bulk grains (62% U.S. total), vegetable oils and shortenings (36% U.S. total), grease and tallow products (97% U.S. total) and cotton (11% U.S. total). The top destination markets were Nigeria, China and Mexico. It’s important to note that increased congestion has not been seen on the bulk side of the Port of Houston.
The Port of New York/New Jersey is the largest (by volume) on the East Coast and the eighth largest for containerized waterborne agricultural exports. The top commodities by volume were soybeans (1% U.S. total), grocery items (7% U.S. total), animal feed (1% U.S. total) and dairy products (11% U.S. total). More than 11% of all dairy products exported from the United States go through this port. The top destination markets were Indonesia, China, United Kingdom and the Netherlands.
Conclusion
The day the contract between the ILU and PMA expired, a group of more than 150 agriculture and business groups, including the American Farm Bureau Federation, sent a letter to President Biden urging the administration to continue to work with the parties to reach a new agreement without any disruption to port operations. Contract negotiations and port operations continue uninterrupted today, but exporters and importers seem to be taking a cautious approach, re-routing their supply chains, contributing to congestion in some Gulf and East Coast ports. This is a smart business practice for those that are able, but not a viable option for some exporters of perishable agricultural products, who must ship out of the closest available port. The increased congestion in the Gulf and East Coast ports may add both time and cost to exporting agricultural products. A quickly concluded contract negotiation between the ILU and PMA would benefit exporters of containerized agricultural products all across the U.S. – from sea to shining sea.
Top Issues
VIEW ALL