Proposed H-2A Changes Try But Fail to Contain Considerable Wage Variability
TOPICS
Proposed Rule
photo credit: AFBF Photo, Terri Moore
Veronica Nigh
Former AFBF Senior Economist
On July 26, the Department of Labor published a proposed rule that would amend its regulations regarding certain provisions of the H-2A program. Among the many changes in the proposed rule are revisions to the methodologies used to determine the Adverse Effect Wage Rate. Rather than a single AEWR for all H-2A workers within a region, DOL has proposed AEWRs by agricultural occupation. The proposal reflects the department's concern that the current AEWR methodology for field and livestock workers (combined) may have an adverse effect on the wages of workers in higher-paid agricultural occupations, such as farmworker supervisors and construction laborers on farms. Following the data supplied by DOL in the proposed rule, this Market Intel will look at what the proposal means for farms utilizing the H-2A program.
Current Procedures
The current AEWR is based on data from the Farm Labor Survey, a quarterly USDA survey that provides estimates of the number of hired workers, average hours worked and wages paid to workers employed on U.S. farms. Hired workers include field workers, livestock workers, supervisors, administrative employees and other workers employed directly by farmers. Field and livestock workers include employees who operate farm equipment. The FLS excludes contract workers, who are paid by a crew leader, contractor, buyer, processor, cooperative or other person who has an oral or written agreement with a farmer/rancher.
Approximately 12,000 farms are surveyed each January, April, July and October. The survey includes both full-time and part-time workers, as well as workers who work either part-year or year-round. Wages consist of cash wages before taxes and other deductions. Wages not paid on an hourly basis (e.g., a salary or piece rate) are converted to hourly rates. Average hourly wages are total wages by type of worker (i.e., crop, livestock and all hired workers) divided by total hours worked. Wages do not include fringe benefits, bonuses, housing or meals.
USDA publishes annual estimates of average hourly wages for field and livestock workers in 15 regions. The 15 regions include 46 states. Separate estimates are published for California, Florida and Hawaii and Alaska is not included in the survey. The AEWR is the same for each state within a region; for example, the Pacific Region AEWR is the same for Oregon and Washington. Similarly, the Northeast I Region AEWR is the same for Connecticut, Maine, Massachusetts, New Hampshire, New York, Rhode Island and Vermont. Nationwide, there may be up to 18 different adverse effect wage rates (i.e., if the rates are different for each of the 15 regions and the three states that are reported separately). The AEWR is the weighted average hourly wage for field and livestock workers (combined) from the previous year’s quarterly surveys.
Some policymakers are concerned the current AEWR does not provide sufficient wage detail by area, occupation, or level of skill and experience required by employers. Currently, the AEWR applies equally to all crop workers, livestock workers and farm equipment operators in a region or state. However, within a region or state, wages for the same occupation may vary because of differences in the cost of living or in the relative supply of or demand for workers.
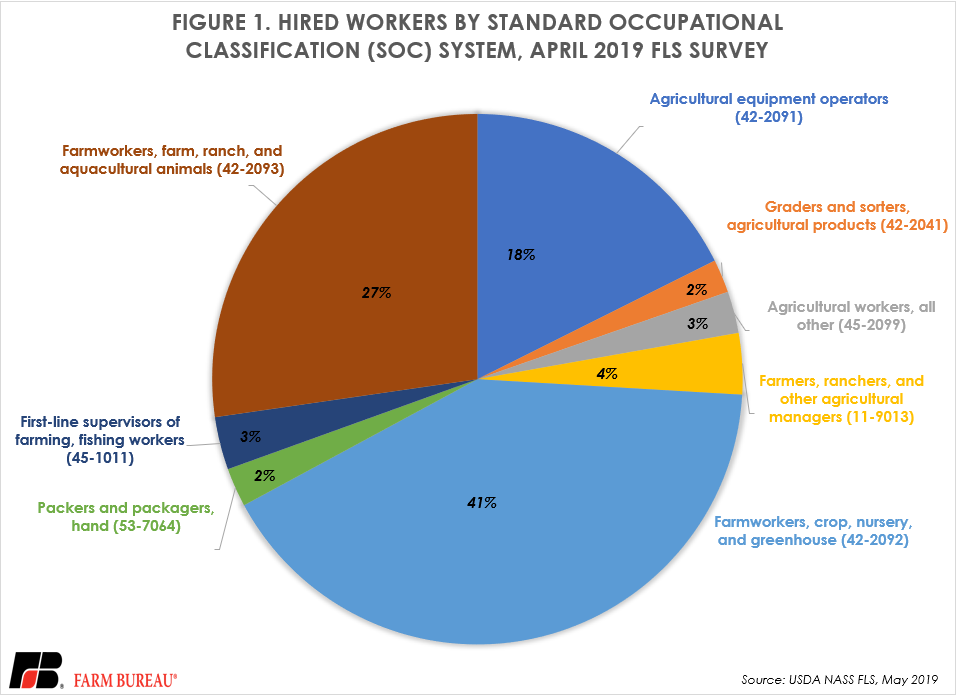
Perhaps in preparation to answer future questions about differing wage rates based on occupation, in 2014 the FLS also began asking respondents to classify hired workers by the Standard Occupational Classification System. SOC codes include: Graders and sorters, agricultural products (42-2041); Agricultural equipment operators (42-2091); Farmworkers, crop, nursery, and greenhouse (42-2092); Farmworkers, farm, ranch, and aquacultural animals (42-2093); Agricultural workers, all other (42-2099); Packers and packagers, hand (53-7064); Farmers, ranchers and other agricultural managers (11-9013); and First-line supervisors of farming, fishing workers (45-1011).
Of the 629,000 workers surveyed in the April 2019 survey, 590,000 were classified via the SOC system. Of those 590,000 workers, the SOC position breakdown was as follows: Graders and sorters, agricultural products (12,000; 2% of total); Agricultural equipment operators (104,000; 18%); Farmworkers, crop, nursery, and greenhouse (243,000; 41%); Farmworkers, farm, ranch, and aquacultural animals (161,000; 27%); Agricultural workers, all other (15,000; 3%); Packers and packagers, hand (14,000; 2%); Farmers, ranchers, and other agricultural managers (22,000; 4%); and First-line supervisors of farming, fishing workers (19,000; 3%).
In addition to capturing the number of positions by SOC code, the FLS also captures wage rates, which are as follows: Graders and sorters, agricultural products ($12.70); Agricultural equipment operators ($14.50); Farmworkers, crop, nursery, and greenhouse ($13.55); Farmworkers, farm, ranch, and aquacultural animals ($13.50); Agricultural workers, all other ($14.40); Packers and packagers, hand ($14.25); Farmers, ranchers, and other agricultural managers ($25.10); and First-line supervisors of farming, fishing workers ($21.30). The Combined Field and Livestock Worker Wage Rate, which is the basis for the current AEWR methodology, is $13.72.

New Proposal
This single survey view of the wage data collected by SOC position indicates wages across positions vary a great deal. But one data point doesn’t make a trend and the data presented in the FLS is national data. Helpfully, DOL included state-by-state and position-by-position data for 2016, 2017 and 2018. The inclusion of this data makes it possible to compare the total wage expenditure a farm would have paid in 2016, 2017 and 2018 under both the current regulation (one-single AEWR) and under the proposed rule.
To develop total wage expenditures for sample farms, we used Appendix A, Table 2 of the proposed rule DOL, which has wages and data sources for 12 different SOC positions. The appendix also reveals that there are at least five different possible data sources for a specific wage: Occupational Employment Statistics State, OES National, FLS Regional, FLS National, or a state prevailing wage.
The wage expenditure in each state for three example operations – small, medium and larger crop farms is estimated using the SOC code and associated wage from Appendix 2 that matches the type of work in the FLS most similarly.
Large farm with 70 workers:
- 60 paid workers classified as Farmworkers - Crop, Nursery and Greenhouse (SOC 45-2092), working 3,000 total hours per week;
- 3 paid workers classified as First-Line Supervisors of Farm Workers (SOC 45-1011), working 150 total hours per week;
- 3 paid workers classified as Agricultural Equipment Operators (SOC 45-2091), working 128 total hours per week; and
- 4 paid worker classified Graders and Sorters - Crop, Nursery and Greenhouse Products (SOC 45-2041), working 170 total hours per week.
Medium farm with 20 workers:
- 16 paid workers classified as Farmworkers - Crop, Nursery and Greenhouse (SOC 45-2092), working 800 total hours per week;
- 2 paid workers classified as First-Line Supervisors of Farm Workers (SOC 45-1011), working 100 total hours per week; and
- 2 paid workers classified as Agricultural Equipment Operators (SOC 45-2091), working 85 total hours per week.
Small farm with 10 workers:
- 8 paid workers classified as Farmworkers - Crop, Nursery and Greenhouse (SOC 45-2092), working 400 total hours per week;
- 1 paid worker classified as First-Line Supervisors of Farm Workers (SOC 45-1011), working 50 total hours per week; and
- 1 paid worker classified as Agricultural Equipment Operators (SOC 45-2091), working 42.5 total hours per week.
In Table 1, the example of a small farm in the Appalachian II region (Kentucky, Tennessee and West Virginia) is shown in detail. The first table of the exhibit is for the sample small farm utilizing the current regulations for calculating the AEWR. Utilizing the regional AEWR of $10.85, the total weekly wage expenditure was $5,344 in 2016, $5,378 in 2017 and $5,511 in 2018. Any small farm with the same number of workers in the Appalachian II region would pay the same total gross wages.
| Table 1. Appalachian II - AEWR Under Current Regulation | ||||||||||||
|---|---|---|---|---|---|---|---|---|---|---|---|---|
| SOC Code | Worker Code Description | No. Paid Workers that week | Total Hours Worked that week | 2016 | 2017 | 2018 | ||||||
| 45-1011 | First-Line Supervisors of Farm Workers | 1 | 50 | $543 | $10.85 | FLS Regional | $546 | $10.92 | FLS Regional | $560 | $11.19 | FLS Regional |
| 45-2091 | Agricultural equipment operators | 1 | 43 | $461 | $10.85 | FLS Regional | $464 | $10.92 | FLS Regional | $476 | $11.19 | FLS Regional |
| 45-2092 | Farmworkers - Crop, Nursery and Greenhouse | 8 | 400 | $4,340 | $10.85 | FLS Regional | $4,368 | $10.92 | FLS Regional | $4,476 | $11.19 | FLS Regional |
| Total | 10 | $ 5,344 | $5,378 | $5,511 | ||||||||
As mentioned above, under the proposed rule the wage rate may vary for different positions in each state, depending on the data source: OES State, OES National, FLS Regional, FLS National, or a state prevailing wage.
The variability of the SOC wage source for a small sample farm in Kentucky is well displayed in Table 2. For SOC code 45-1011, the wage source is the same for 2016, 2017 and 2018 – OES State. For SOC code 45-2091, the wage source for 2016 and 2017 is OES State, but switches to FLS National in 2018. For SOC code 45-2092 the wage source in 2016 is OES State, but switches to FLS National in 2017 and 2018. As a result of the variability in both the wage rate and data sources, the total weekly gross wages for the small Kentucky farm changes significantly throughout the three-year period. The total weekly wage expenditure would have been $6,974 in 2016, $5,836 in 2017 and $5,964 in 2018. Table 3 and Table 4 display the same small sample farm, but in West Virginia and Tennessee. In both states, there is considerable variability in the SOC wage source.
| Table 2. Appalachian II - Kentucky - Wage Under New Proposal | ||||||||||||
|---|---|---|---|---|---|---|---|---|---|---|---|---|
| SOC Code | Worker Code Description | No. Paid Workers that week | Total Hours Worked that week | 2016 | 2017 | 2018 | ||||||
| 45-1011 | First-Line Supervisors of Farm Workers | 1 | 50 | $1,144 | $22.87 | OES State | $1,199 | $23.97 | OES State | $1,142 | $22.83 | OES State |
| 45-2091 | Agricultural equipment operators | 1 | 43 | $458 | $10.78 | OES State | $461 | $10.85 | OES State | $514 | $12.10 | FLS Regional |
| 45-2092 | Farmworkers - Crop, Nursery and Greenhouse | 8 | 400 | $5,372 | $13.43 | OES State | $4,176 | $10.44 | FLS Regional | $4,308 | $10.77 | FLS Regional |
| Total | 10 | $6,974 | $5,836 | $5,964 | ||||||||
| Total Gross Wage Increase Over Current Regulation | 31% | 9% | 8% | |||||||||
| Table 3. Appalachian II - West Virginia - Wage Under New Proposal | ||||||||||||
|---|---|---|---|---|---|---|---|---|---|---|---|---|
| SOC Code | Worker Code Description | No. Paid Workers that week | Total Hours Worked that week | 2016 | 2017 | 2018 | ||||||
| 45-1011 | First-Line Supervisors of Farm Workers | 1 | 50 | $1,255 | $25.09 | OES State | $1,170 | $23.39 | OES State | $1,233 | $24.66 | OES State |
| 45-2091 | Agricultural equipment operators | 1 | 43 | $526 | $12.38 | FLS National | $546 | $12.85 | FLS National | $514 | $12.10 | FLS Regional |
| 45-2092 | Farmworkers - Crop, Nursery and Greenhouse | 8 | 400 | $4,040 | $10.10 | OES State | $4,176 | $10.44 | FLS Regional | $4,308 | $10.77 | FLS Regional |
| Total | 10 | $5,821 | $5,892 | $6,055 | ||||||||
| Total Gross Wage Increase Over Current Regulation | 9% | 10% | 10% | |||||||||
| Table 4. Appalachian II - Tennessee - Wage Under New Proposal | ||||||||||||
|---|---|---|---|---|---|---|---|---|---|---|---|---|
| SOC Code | Worker Code Description | No. Paid Workers that week | Total Hours Worked that week | 2016 | 2017 | 2018 | ||||||
| 45-1011 | First-Line Supervisors of Farm Workers | 1 | 50 | $1,197 | $23.93 | OES State | $1,031 | $20.61 | OES State | $1,007 | $20.14 | OES State |
| 45-2091 | Agricultural equipment operators | 1 | 43 | $515 | $12.12 | OES State | $564 | $13.26 | OES State | $514 | $12.10 | FLS Regional |
| 45-2092 | Farmworkers - Crop, Nursery and Greenhouse | 8 | 400 | $4,056 | $10.14 | OES State | $4,176 | $10.44 | FLS Regional | $4,308 | $10.77 | FLS Regional |
| Total | 10 | $5,768 | $5,770 | $5,829 | ||||||||
| Total Gross Wage Increase Over Current Regulation | 8% | 7% | 6% | |||||||||
In all three states, in all three years, the total weekly gross wage would have been greater under the proposed rule than under the current regulation. For the Kentucky farm, under the proposed rule, total weekly gross wages would have been 31% higher in 2016, 9% higher in 2017 and 8% higher in 2018. For the West Virginia farm, under the proposed rule, total weekly gross wages would have been 9% higher in 2016, 10% higher in 2017 and 10% higher in 2018. For the Tennessee farm, under the proposed rule, total weekly gross wages would have been 8% higher in 2016, 7% higher in 2017 and 6% higher in 2018.
Ideally, the proposed rule would not result in higher wage expenditures, but that would not be the case for the sample farms in most states. Nationally, the total wage expenditure for the small- and medium-sized sample farms would have been 10% higher in 2016, 10% higher in 2017 and 9% higher in 2018 if the wages had been calculated following the proposed rule, compared to the current regulations. Nationally, the total wage expenditure for the large-sized sample farms would have been 4% higher in 2016, 4% higher in 2017 and 3% higher in 2018 if the wages had been calculated following the proposed rule, compared to the current regulations. The proposed rule does, however, result in a lower wage expenditure for the sample farms for some states, particularly the larger-sized sample farms. The estimated differences in payroll expenses for small-/medium-sized and large-sized farms by state can be seen in Table 5.
| Table 5. Payroll Expense Under Proposed Rule Compared to Payroll Expense Under Current Regulation (Positive Percentage Indicates Amount Higher the Proposed Rule is Compared to Current Regulation) | ||||||
|---|---|---|---|---|---|---|
| State | Small & Medium Crop Farm (10 & 20 workers) | Large Crop Farm (70 workers) | ||||
| 2016 | 2017 | 2018 | 2016 | 2017 | 2018 | |
| Alabama | 16% | 22% | 17% | 8% | 11% | 8% |
| Arizona | -6% | 4% | 12% | -12% | -2% | 4% |
| Arkansas | 9% | 11% | 3% | 2% | 5% | 0% |
| California | 4% | 5% | 6% | 0% | 1% | 1% |
| Colorado | 12% | 14% | 9% | 3% | 6% | 1% |
| Connecticut | 13% | 14% | 11% | 7% | 9% | 6% |
| Delaware | 15% | 10% | 13% | 7% | 3% | 6% |
| Florida | 13% | 12% | 10% | 5% | 4% | 3% |
| Georgia | 15% | 15% | 13% | 7% | 8% | 6% |
| Hawaii | 1% | 7% | 11% | -6% | -1% | 7% |
| Idaho | 6% | 11% | 6% | 1% | 6% | -1% |
| Illinois | 10% | 7% | -2% | 4% | 2% | -7% |
| Indiana | 10% | 9% | 0% | 4% | 3% | -7% |
| Iowa | 26% | 14% | 3% | 18% | 6% | -5% |
| Kansas | -4% | 2% | 6% | -8% | -3% | 0% |
| Kentucky | 31% | 9% | 8% | 26% | 2% | 1% |
| Louisiana | 13% | 17% | 3% | 4% | 7% | 2% |
| Maine | 16% | 17% | 13% | 11% | 11% | 7% |
| Maryland | 18% | 16% | 17% | 9% | 6% | 8% |
| Massachusetts | 21% | 17% | 12% | 13% | 11% | 7% |
| Michigan | 8% | 0% | 4% | 1% | -6% | -1% |
| Minnesota | 8% | 4% | 10% | 3% | -3% | 3% |
| Mississippi | 9% | 10% | 3% | 2% | 4% | 0% |
| Missouri | -2% | 0% | -1% | -8% | -6% | -7% |
| Montana | 4% | 8% | 1% | 1% | 6% | -3% |
| Nebraska | 19% | 22% | 36% | 15% | 18% | 31% |
| Nevada | 8% | 13% | 8% | 3% | 6% | 1% |
| New Hampshire | 22% | 16% | 13% | 15% | 10% | 7% |
| New Jersey | 13% | 6% | 7% | 7% | 1% | 4% |
| New Mexico | -4% | 2% | 8% | -8% | 0% | 3% |
| New York | 20% | 18% | 15% | 12% | 11% | 8% |
| North Carolina | 18% | 22% | 20% | 9% | 11% | 9% |
| North Dakota | 3% | 4% | 10% | -2% | -1% | 8% |
| Ohio | 13% | 11% | 0% | 5% | 4% | -6% |
| Oklahoma | 9% | 5% | 9% | 6% | 2% | 2% |
| Oregon | 16% | 9% | 9% | 8% | 3% | 4% |
| Pennsylvania | 15% | 11% | 17% | 7% | 3% | 8% |
| Rhode Island | 17% | 12% | 8% | 12% | 8% | 5% |
| South Carolina | 18% | 22% | 20% | 9% | 11% | 9% |
| South Dakota | -11% | -13% | 0% | -16% | -17% | -4% |
| Tennessee | 8% | 7% | 6% | 1% | 1% | 0% |
| Texas | -6% | 5% | 10% | -10% | 2% | 3% |
| Utah | 8% | 12% | 7% | 2% | 6% | 0% |
| Vermont | 21% | 13% | 11% | 16% | 9% | 6% |
| Virginia | 15% | 12% | 14% | 5% | 5% | 6% |
| Washington | 15% | 11% | 9% | 9% | 5% | 5% |
| West Virginia | 9% | 10% | 10% | 0% | 2% | 2% |
| Wisconsin | 8% | 4% | 7% | 2% | -3% | 1% |
| Wyoming | 6% | 10% | 3% | 1% | 6% | -3% |
| Simple National Average | 10% | 10% | 9% | 4% | 4% | 3% |
Considerable year-to-year variations in the AEWR in some regions have made planning difficult for farmers. For example, the 2019 AEWR of $13.13 for the Mountain II region, which includes, Nevada, Colorado and Utah, was $2.44 per hour or 23% higher than the 2018 AEWR of $10.69. Reducing some of the variation in payroll expense from year to year would be a welcome outcome of the proposed rule.
Unfortunately, according to the limited three-year span of data provided by DOL, the proposed rule does not accomplish this goal, as demonstrated in Table 6. For example, the total wage expenditure under the current AEWR for the small/medium farm example farm in the Cornbelt I region increased 8% from 2017 to 2018 and then decreased by 1% from 2017 to 2018. Under the proposed rule, the total wage expenditure for the example small/medium farm in Illinois, a state within the Cornbelt I region, increased 6% from 2017 to 2018 and then decreased by 10% from 2017 to 2018.
The variability story is similar for the large crop farm, despite a labor force that has a slightly smaller share of higher wage positions (14% positions on the large farm vs 20% on the small/medium farms). The total wage expenditure under the current AEWR for the example large farm in the Cornbelt I region increased 8% from 2017 to 2018 and then decreased by 1% from 2017 to 2018. Under the proposed rule, the total wage expenditure for the example large farm in Illinois, a state within the Cornbelt I, region increased 6% from 2017 to 2018 and then decreased by 11% from 2017 to 2018. Across several regions the proposed rule methodology ends up producing more wage variation from year to year, rather than reducing it.
| Table 6: Year Over Year Change in Payroll Expense | |||||
|---|---|---|---|---|---|
| Calculation Method | Region or State | Small & Medium Crop (10 & 20 workers) | Large Crop (70 workers) | ||
| 2016/2017 Change | 2017/2018 Change | 2016/2017 Change | 2017/2018 Change | ||
| Current Regulation | Appalachian I | 5% | 2% | 5% | 2% |
| Proposed Rule | Virginia | 3% | 3% | 5% | 3% |
| North Carolina | 6% | 5% | 6% | 4% | |
| Current Regulation | Appalachian II | 1% | 2% | 1% | 2% |
| Proposed Rule | Kentucky | -16% | 2% | -19% | 2% |
| Tennessee | 0% | 1% | 1% | 1% | |
| West Virginia | 1% | 3% | 2% | 2% | |
| Current Regulation | California | 6% | 5% | 6% | 5% |
| Proposed Rule | California | 7% | 5% | 7% | 5% |
| Current Regulation | Cornbelt I | 8% | -1% | 8% | -1% |
| Proposed Rule | Illinois | 5% | -8% | 6% | -10% |
| Indiana | 7% | -9% | 7% | -10% | |
| Ohio | 6% | -10% | 6% | -11% | |
| Current Regulation | Cornbelt II | 8% | 2% | 8% | 2% |
| Proposed Rule | Iowa | -2% | -7% | -3% | -8% |
| Missouri | 9% | 2% | 10% | 1% | |
| Current Regulation | Delta | -3% | 3% | -3% | 3% |
| Proposed Rule | Arkansas | -1% | -4% | -1% | -1% |
| Louisiana | 0% | -9% | 0% | -1% | |
| Mississippi | -1% | -4% | -1% | -1% | |
| Current Regulation | Florida | 4% | 2% | 4% | 2% |
| Proposed Rule | Florida | 3% | 0% | 3% | 1% |
| Current Regulation | Hawaii | 4% | 9% | 4% | 9% |
| Proposed Rule | Hawaii | 10% | 14% | 9% | 17% |
| Current Regulation | Lake | 6% | 2% | 6% | 2% |
| Proposed Rule | Michigan | -1% | 6% | -1% | 8% |
| Minnesota | 2% | 9% | 1% | 9% | |
| Wisconsin | 2% | 6% | 1% | 7% | |
| Current Regulation | Mountain I | -1% | 0% | -1% | 0% |
| Proposed Rule | Idaho | 4% | -5% | 5% | -7% |
| Montana | 3% | -7% | 4% | -9% | |
| Wyoming | 3% | -7% | 4% | -9% | |
| Current Regulation | Mountain II | -2% | -3% | -2% | -3% |
| Proposed Rule | Colorado | 0% | -7% | 1% | -8% |
| Nevada | 2% | -7% | 1% | -8% | |
| Utah | 1% | -7% | 2% | -8% | |
| Current Regulation | Mountain III | -2% | -4% | -2% | -4% |
| Proposed Rule | Arizona | 8% | 2% | 8% | 2% |
| New Mexico | 4% | 1% | 6% | -1% | |
| Current Regulation | Northeast I | 5% | 4% | 5% | 4% |
| Proposed Rule | Connecticut | 6% | 1% | 8% | 1% |
| Massachusetts | 2% | -1% | 3% | 0% | |
| Maine | 6% | 0% | 5% | 0% | |
| New Hampshire | 1% | 0% | 1% | 0% | |
| New York | 4% | 1% | 4% | 1% | |
| Rhode Island | 1% | 0% | 2% | 1% | |
| Vermont | -2% | 2% | -1% | 1% | |
| Current Regulation | Northeast II | 5% | -1% | 5% | -1% |
| Proposed Rule | Delaware | 0% | 2% | 0% | 2% |
| Maryland | 3% | 0% | 2% | 1% | |
| New Jersey | -2% | 0% | 0% | 1% | |
| Pennsylvania | 1% | 4% | 1% | 3% | |
| Current Regulation | Pacific | 5% | 6% | 5% | 6% |
| Proposed Rule | Oregon | 0% | 5% | 1% | 6% |
| Washington | 1% | 4% | 2% | 6% | |
| Current Regulation | Northern Plains | 0% | -1% | 0% | -1% |
| Proposed Rule | Kansas | 6% | 3% | 6% | 3% |
| North Dakota | 1% | 5% | 2% | 8% | |
| Nebraska | 2% | 10% | 2% | 10% | |
| South Dakota | -2% | 13% | -1% | 14% | |
| Current Regulation | Southeast | 0% | 3% | 0% | 3% |
| Proposed Rule | Alabama | 5% | -1% | 3% | 0% |
| Georgia | 1% | 1% | 1% | 1% | |
| South Craolina | 4% | 1% | 2% | 1% | |
| Current Regulation | Southern Plains | 4% | 2% | 4% | 2% |
| Proposed Rule | Oklahoma | 0% | 6% | 0% | 3% |
| Texas | 16% | 7% | 18% | 3% | |
Conclusion
To alleviate concerns about potential adverse effects on the wages of workers in higher-paid agricultural occupations, DOL is proposed a new AEWR methodology that would establish separate AEWRs by agricultural occupation. However, due to thin data for many occupations it appears as if the proposal will make estimating wage expenditures more difficult, more variable and more expensive. The window to submit written comments on the proposed rule closes September 24.
Top Issues
VIEW ALL