Reviewing 2018 Crop Insurance Prices
TOPICS
Soybeans
photo credit: North Carolina Farm Bureau, Used with Permission
John Newton, Ph.D.
Vice President of Public Policy and Economic Analysis
During 2018, nearly 80 percent of corn and soybean acres planted were covered by a crop insurance revenue protection policy at 70.5 million and 71.2 million acres, respectively. More than 80 percent of cotton acres were covered by revenue protection at 10.9 million acres. For these three crops combined, farmers paid more than $2 billion in crop insurance premiums and had weighted average coverage levels of 77 percent for corn, 70 percent for soybeans and 76 percent for cotton. These revenue protection policies include a harvest price option that establishes the rate of crop loss reimbursement at the higher of the spring planting price or the price during harvest.
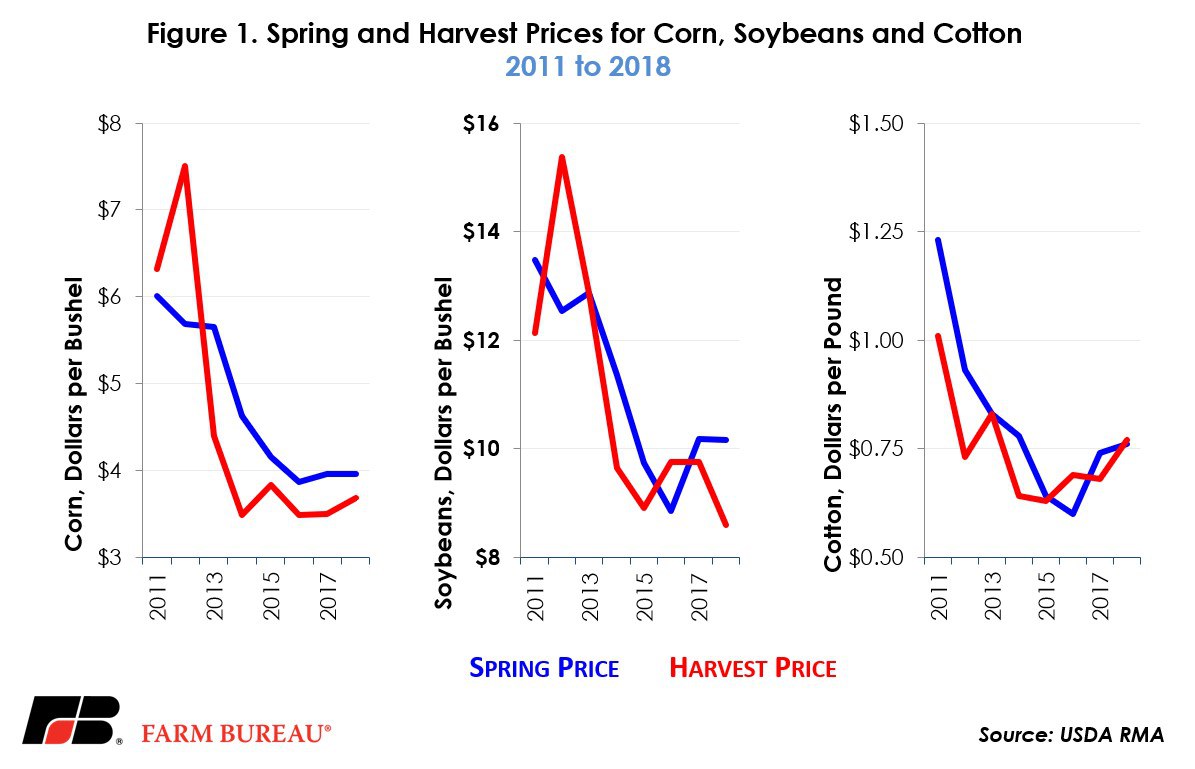
Spring prices for corn and soybeans are determined by averaging the new-crop futures contract settlement prices (December for corn and cotton, November for soybeans) during the month-long February price discovery period. Harvest prices are determined by averaging the same new-crop futures during the month-long October price discovery period. The spring prices announced in March 2018 were $3.96 per bushel for corn, 76 cents per pound for cotton and $10.16 per bushel for soybeans.
At the beginning of November, USDA’s Risk Management Agency announced the harvest prices for corn at $3.68 per bushel, cotton at 77 cents per pound and soybeans at $8.60 per bushel. For corn, the harvest price was 28 cents per bushel below the spring price, marking the sixth consecutive year that harvest prices have been below the spring prices established in February. For cotton, the harvest price was 1 cent per pound above the spring price and the highest harvest price since 2013. For soybeans, the harvest price was down $1.56 per bushel---the largest drop in harvest price since 2014. Spring and harvest prices are presented in Figure 1. For corn and soybeans, the decline in harvest prices was anticipated given projections for the second-largest corn crop, a record soybean crop, and the headwinds agriculture is facing in export markets.
The harvest price option provides protection on crop losses at the higher of the spring or harvest price and may assist growers by indemnifying at the replacement value of the crop. For farmers delivering under the terms of a forward contract with physical delivery or for livestock producers using the crops as livestock feed, the replacement value of lost production is a critical risk management tool and justifies the harvest price option. Without the harvest price option, in the event of a large systemic crop loss farmers would need to replace lost production at a time when market prices are likely the highest.
Coverage Level Multiplier
For 2018 corn and soybean policyholders the crop insurance guarantee will be based on the higher spring prices of $3.96 per bushel and $10.16 per bushel, respectively. For cotton, the insurance guarantee will be based on the harvest price of 77 cents per pound.
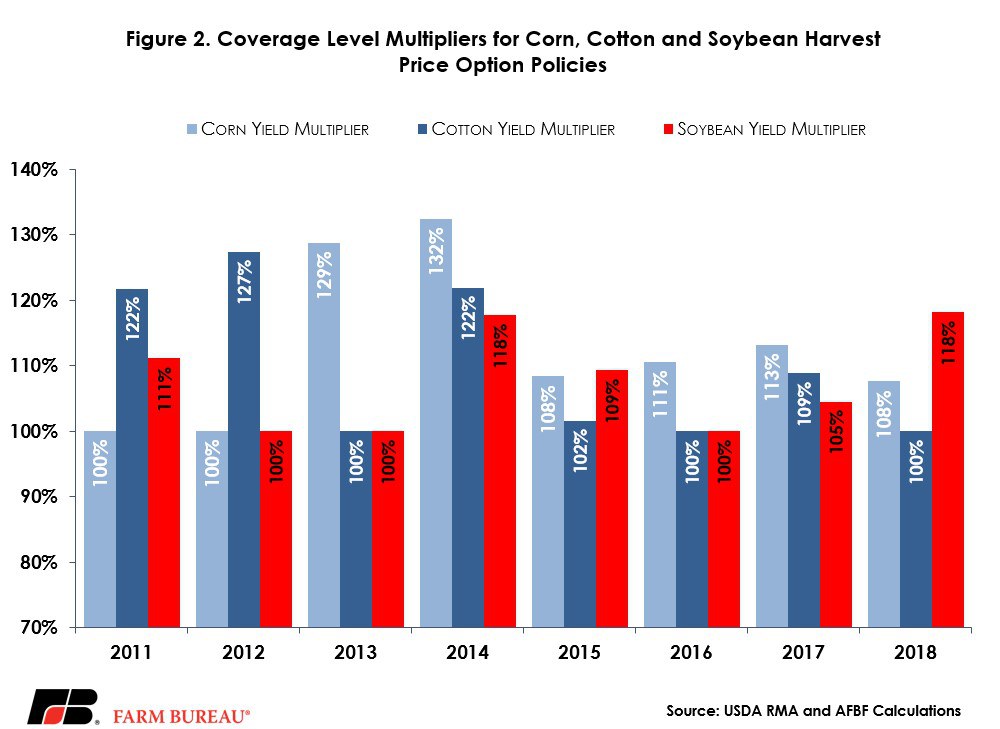
When the harvest price is below the spring price, yield declines do not need to be as large to trigger indemnities because price declines lower the harvest revenue. This relationship between price and yield is highlighted by implied coverage level multipliers. Coverage level multipliers, defined as the maximum of the spring price and the harvest price divided by the harvest price, boost yield coverage when the spring price is greater than the harvest price. When the harvest price is greater than the spring price, coverage level multipliers equal zero. See below for a detailed description of coverage level multipliers.
For 2018 corn policies the coverage level multiplier is equal to 108 percent, i.e., 1.08 = 3.96 3.68. For 2018 cotton policies the coverage level multiplier is equal to 100 percent, i.e., 1.00 = 0.77 0.77. For 2018 soybean policies the coverage level multiplier is equal to 118 percent, i.e., 1.18 = 10.16 8.60. Coverage level multipliers for corn, cotton and soybeans policies are presented in Figure 2.
The coverage level multipliers can then by multiplied by the declared coverage level to determine how far actual yields need to fall below the actual production history yield to trigger indemnities. For example, using the 2018 coverage level multipliers, a corn crop insurance policy with an 80 percent coverage level will trigger an indemnity when the actual yield is less than 86 percent of the APH yield, i.e., 0.86 = 1.08 X 0.80. Similarly, a soybean crop insurance policy at 80 percent coverage will trigger an indemnity when the actual yield is less than 94 percent of the APH yield, i.e., 0.94 = 1.18 X 0.80. For cotton there is no coverage level multiplier because the harvest price was above the spring price. In the case for both corn and soybeans, the price declines experienced during the growing season, when combined with yields below the APH, are likely to result in actual revenues that are more than 15 percent below the guarantee.
The price declines experienced in corn and soybeans this growing season have boosted the coverage levels under crop insurance. However, the expectation for record crop yields above the APH yields are likely to substantially reduce or eliminate crop insurance indemnities for many growers – despite experiencing very large price declines in both the cash and futures markets.
Top Issues
VIEW ALL