Soybeans Trumping Corn in 18 States

photo credit: North Carolina Farm Bureau, Used with Permission
John Newton, Ph.D.
Vice President of Public Policy and Economic Analysis
On March 31, 2017, USDA released the much-anticipated Prospective Plantings report along with the March 1 Grain Stocks report. The grain stocks report provides an estimate of on-farm and off-farm grain in storage at a point in time and the opportunity to evaluate quarterly grain consumption. While the grain stocks should be viewed as the most important of the two reports, as it provides physical market intelligence, prospective plantings receives most of the headlines. The prospective plantings report gives the first estimate of the area farmers are expected to plant to row crops for the upcoming year based on survey responses during the first two weeks of March.
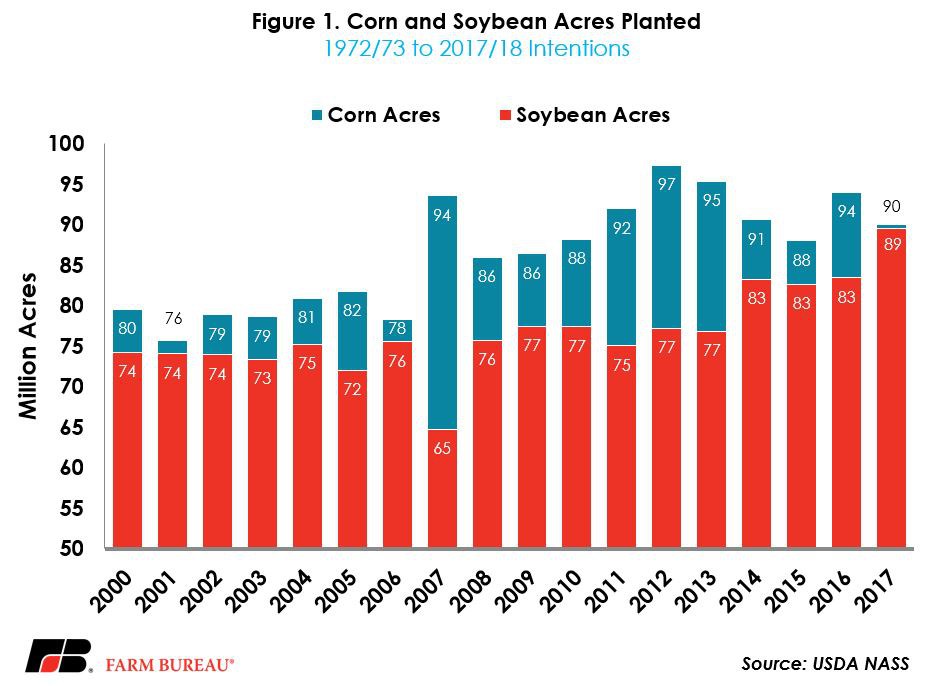
The Prospective Plantings report revealed that for the 2017/18 marketing year, U.S. producers intend to plant 89.996 million acres of corn, down 4 percent from the prior year, and nearly a million acres below the trade estimate of 90.969 million acres. Growers also intend to plant a record 89.482 million acres of soybeans, an increase of 7 percent from the 2016/17 crop year and 1.268 million acres above the trade estimate of 88.214 million acres. Total planted area to corn and soybeans is 179.5 million acres, a record high, Figure 1. Importantly, driven by increased global demand for soybeans, the spread between corn and soybean acres is only half a million acres and is at the lowest level since the payment-in-kind acreage reduction program of 1983.
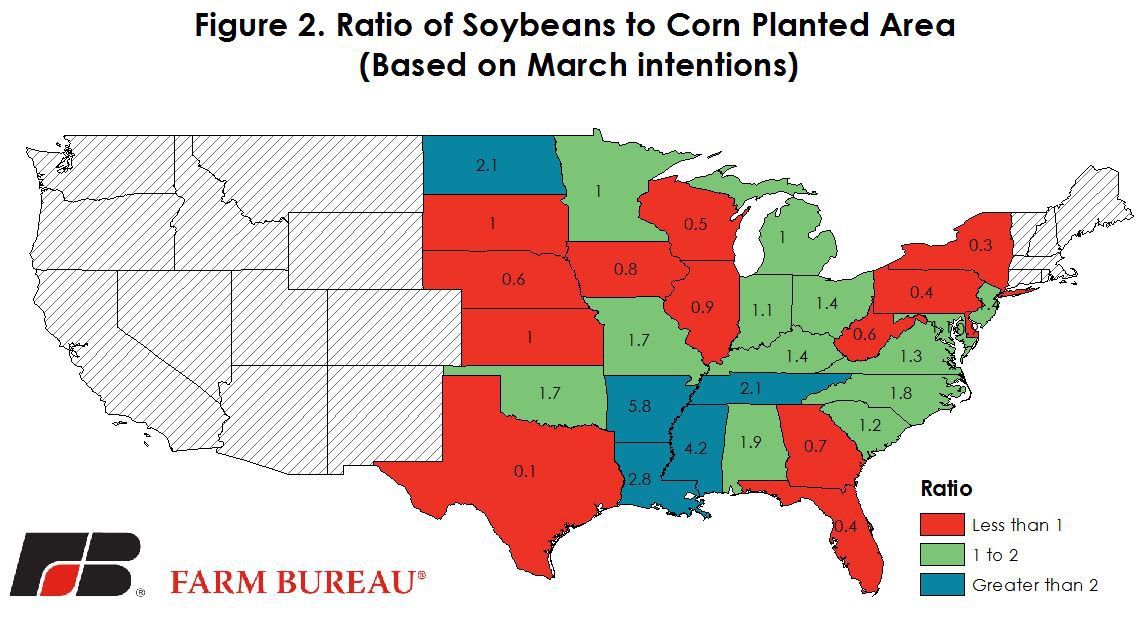
In 2016, soybean acreage exceeded corn acreage in 16 out of 31 states that plant soybeans. Today, crop budgets project even greater operator and land financial returns for soybeans compared to corn. Consequently the number of states with more soybean acreage than corn has climbed. Based on farmer surveys, 18 out of 31 states will plant more soybeans than corn in 2017, Figure 2. These 18 states will plant 16.7 million more acres to soybeans than corn. The ratios are the highest in the south along the Delta where Arkansas, Mississippi, Louisiana and Tennessee will all plant twice as many acres to soybeans than corn.
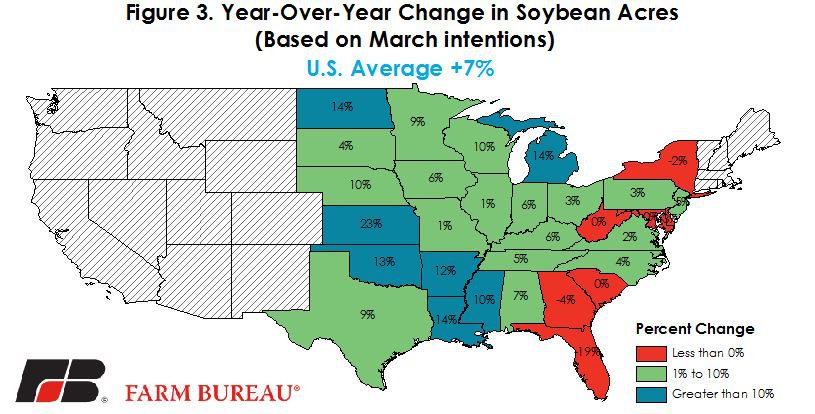
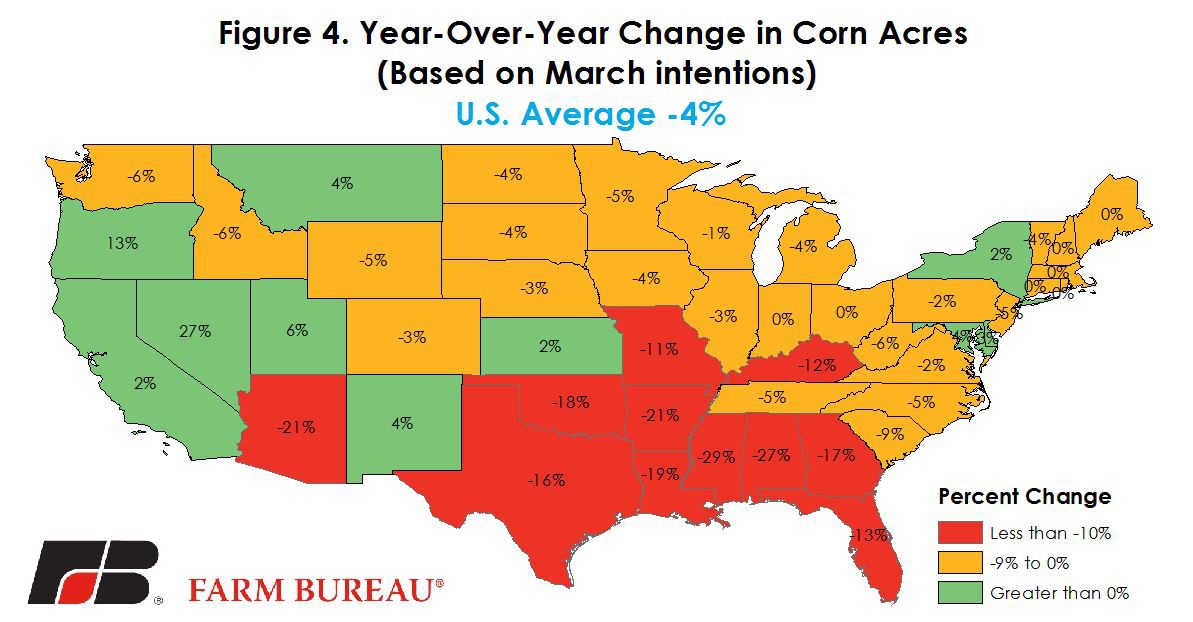
Intentions reveal that 27 of the 31 states will plant more soybean acres in 2017 compared to 2016. Many of these additional acres will come from lower corn and wheat acreage. For corn, 38 out of 48 states will plant fewer corn acres in 2017 compared with last year, Figures 3 and 4. Winter wheat acreage was down 9 percent from last year, and durum wheat and spring wheat are expected to decline by 17 percent and 3 percent, respectively. Total wheat acres are expected to be down 4.1 million acres from last year. The loss of 8 million corn and wheat acres is offset by 6 million additional soybean acres.
Implications
USDA’s Prospective Plantings report provides the first survey-based estimate of acreage for the upcoming crop year. Since 2005 the average difference between actual plantings and the March intentions was 157 million and -13 million acres for corn and soybeans, respectively. However, large differences do occur, these estimates will change, especially if a shock in demand drives prices higher or weather complicates the acreage allocation. For example, wet conditions early in the planting season could lead to more soybean acres which are traditionally planted later, while favorable weather early in the spring could lead to more corn acres being planted.
Weather outlooks are available from the National Weather Service’s Climate Prediction Center. As planting continues, USDA’s weekly Crop Progress report will provide estimates on the pace of planting, and crop conditions throughout the growing season. The next opportunity to update expectations on potential acreage and size of the 2017/18 crop will be USDA’s May 10, 2017, Crop Production report.
Given that we are only halfway through the current marketing year, new crop corn and soybeans will be influenced by current trends in consumption and potential ending stocks. AFBF’s February Crop Update reviewed consumption trends in exports, crushing, ethanol production, and feed and residual use and their implications on ending stocks. The March 1 Grain Stocks report also confirmed that consumption in 2016/17 could be record-high. Based on the March 1 grain stocks, first half (September to February) consumption of corn was 8.3 billion bushels, up 10 percent from last year. First half soybean consumption was 2.8 billion bushels, up 7 percent from last year. Thus, while March 1 stocks for both commodities are record-high, record high consumption could help to lower ending stocks and boost prices if the current pace of demand holds.
Top Issues
VIEW ALL