2020 EPA Emissions Inventory Demonstrates Agriculture’s Advancements in Sustainability
TOPICS
Market Intel
photo credit: AFBF Photo, Morgan Walker
Shelby Myers
Former AFBF Economist
2020 EPA Emissions Inventory Demonstrates Agriculture’s Advancements in Sustainability
The Inventory of U.S. Greenhouse Gas Emissions and Sinks has been published by the Environmental Protection Agency annually since 1990. It provides an annual accounting estimate of all man-made greenhouse gas emissions sources in the U.S. as well as estimates of the amount of carbon trapped in forest and vegetation soil. This report is submitted to the United Nations as part of the United Nations Framework Convention on Climate Change reporting guidelines on annual inventories and is part of a global standardized process for reporting greenhouse gas emissions. Previous Market Intel articles have reviewed the emissions for 2017 (Agriculture and Greenhouse Gas Emissions), 2018 (Agriculture’s Greenhouse Gas Emissions and Sinks) and 2019 (Previewing 2019 Agricultural Emissions), as well as trends in carbon sequestration (Reviewing U.S. Carbon Sequestration).
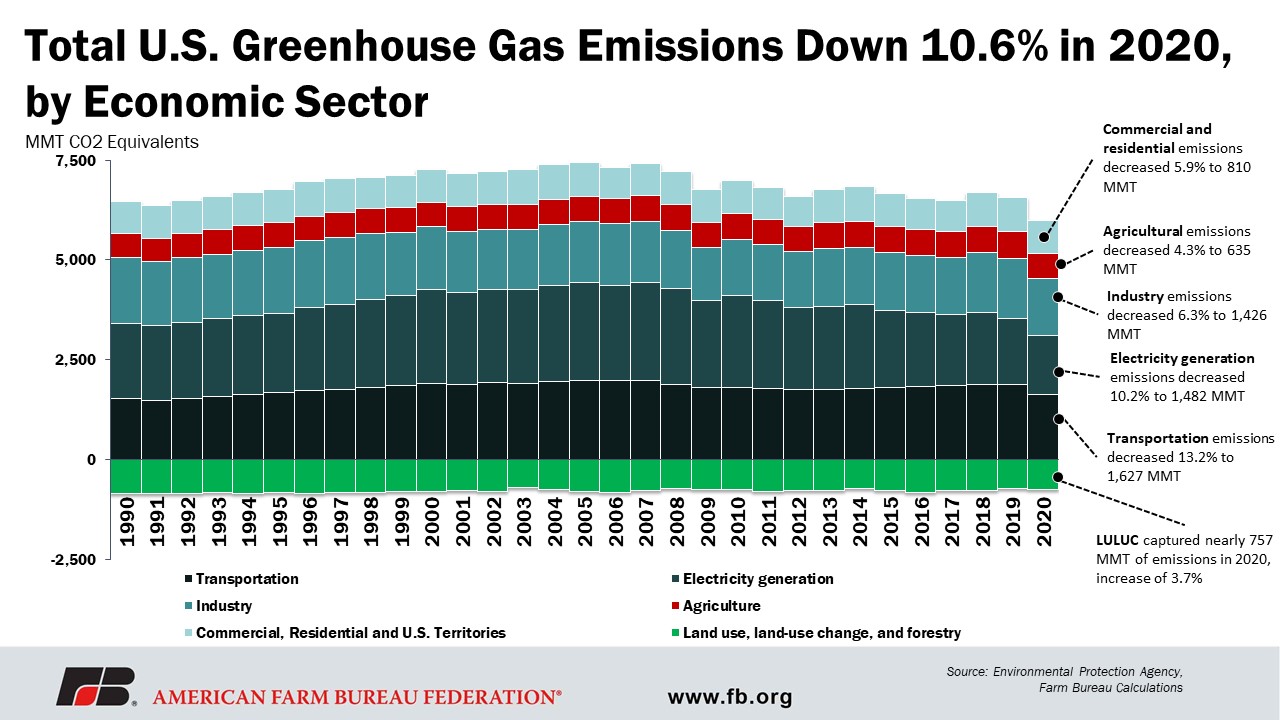
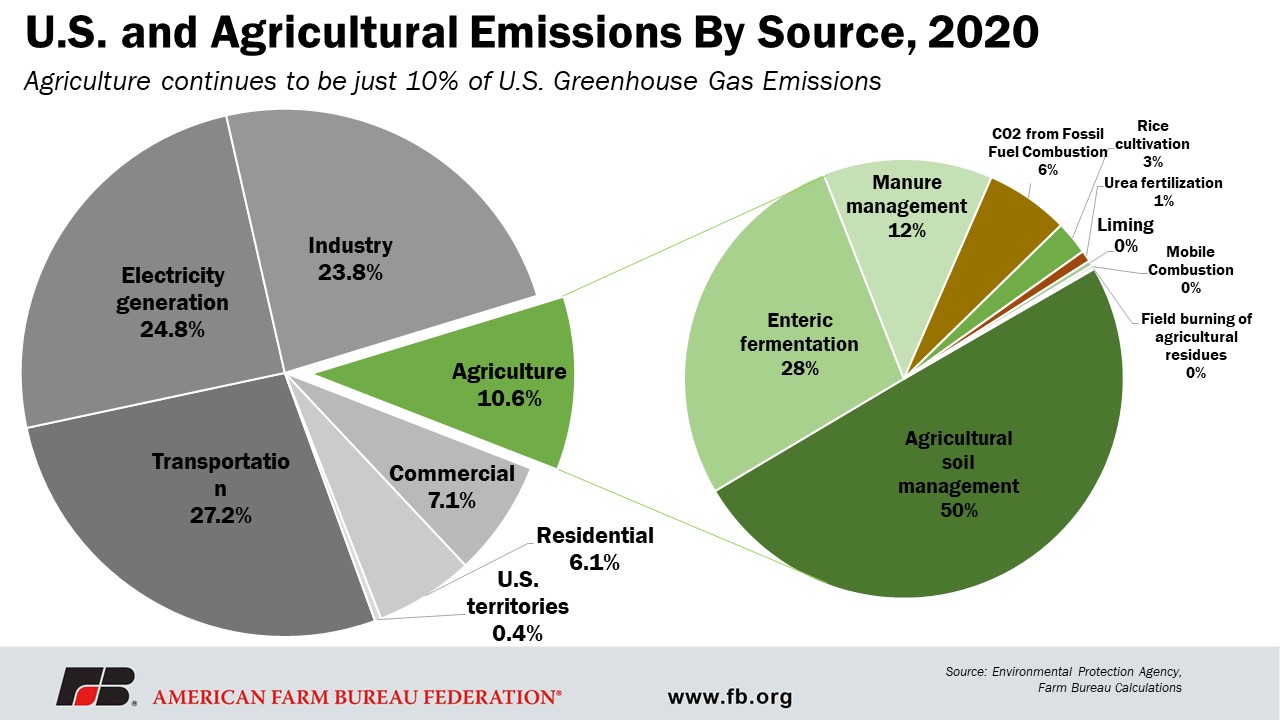
Once again, U.S. agriculture consistently represents just 10% of total U.S. emissions when compared to other economic sectors. U.S. agriculture not only minimally contributes to the overall U.S. greenhouse gas footprint, but the sector also sequestered more carbon in 2020 compared to 2019. Additionally, overall U.S. greenhouse gas emissions decreased from 2019 to 2020 by 10.6%. The report emphasizes how voluntary, market- and incentive-based strategies to implement conservation practices help farmers and ranchers access finances for the research and technology needed to continue to take care of their natural resources.
Today's article provides an overview of 2020 emissions published on April 15 in EPA’s Inventory of U.S. Greenhouse Gas Emissions and Sinks: 1990-2020 report.
2020 Emissions and Sinks
In 2020, EPA reports that the total U.S. emissions from all man-made sources was 5.9 billion metric tons in CO2 equivalents, which is a reduction of 590 million metric tons compared to 2019 when U.S. emissions totaled 6.5 billion metric tons in CO2 equivalents. Land use, land-use changes and forestry trapped 759 million metric tons of carbon in the soils, representing 12.7% of total U.S. emissions. 2020 net emissions, which combine total U.S. greenhouse gas emissions with the sequestered greenhouse gas emissions, totaled 5.2 billion metric tons, down 10.6% from 2019, the lowest emissions on record since 1990.
The largest emissions source was the transportation sector, representing 27.2% of total emissions and totaling 1.6 billion metric tons. Transportation emissions decreased 13.2%, or 246.7 million metric tons, from the prior year, largely a result of COVID-19 reductions in travel and economic activity. Following transportation, electricity generation represented almost 25% of total emissions at 1.4 billion metric tons. Emissions from the electric power industry were down 10.2% from 2019 after an 8% reduction compared to 2018. Electricity emissions continue to move lower, setting another record low in 2020. The industrial sector, which includes the production of iron and steel, as well as other input materials like cement, represented over 23% of all emissions at 1.4 billion metric tons. Emissions from the industrial sector decreased 6.3% compared to 2019. The commercial and residential sectors and U.S. territories represented over 13% of all U.S. emissions, decreasing nearly 6% in 2020 compared to 2019, again heavily impacted by COVID-19 interruptions.
Agricultural Emissions in 2020
By its own methodology, emissions from agriculture totaled 635 million metric tons in CO2 equivalents during 2020, down 4.3%, or 28.8 million metric tons, from 2019; the drop follows a (relatively small) 6 million metric ton uptick between 2018 and 2019.
EPA also estimates agriculture emissions using another methodology consistent with the Intergovernmental Panel on Climate Change. By this measure, U.S. agricultural emissions for 2020 totaled 594 million metric tons, down 4.5%, or 28.2 million metric tons, from 2019, representing 9.9% of all U.S. greenhouse gas emissions. The largest source of U.S. agricultural emissions was agricultural soil management, e.g., fertilizer applications or tillage practices, at 316 million metric tons, an 8.4% reduction compared to 2019, decreasing by 29.1 million metric tons. Agricultural soil management represents approximately 50% of all agricultural emissions, but only 5% of total U.S. emissions.
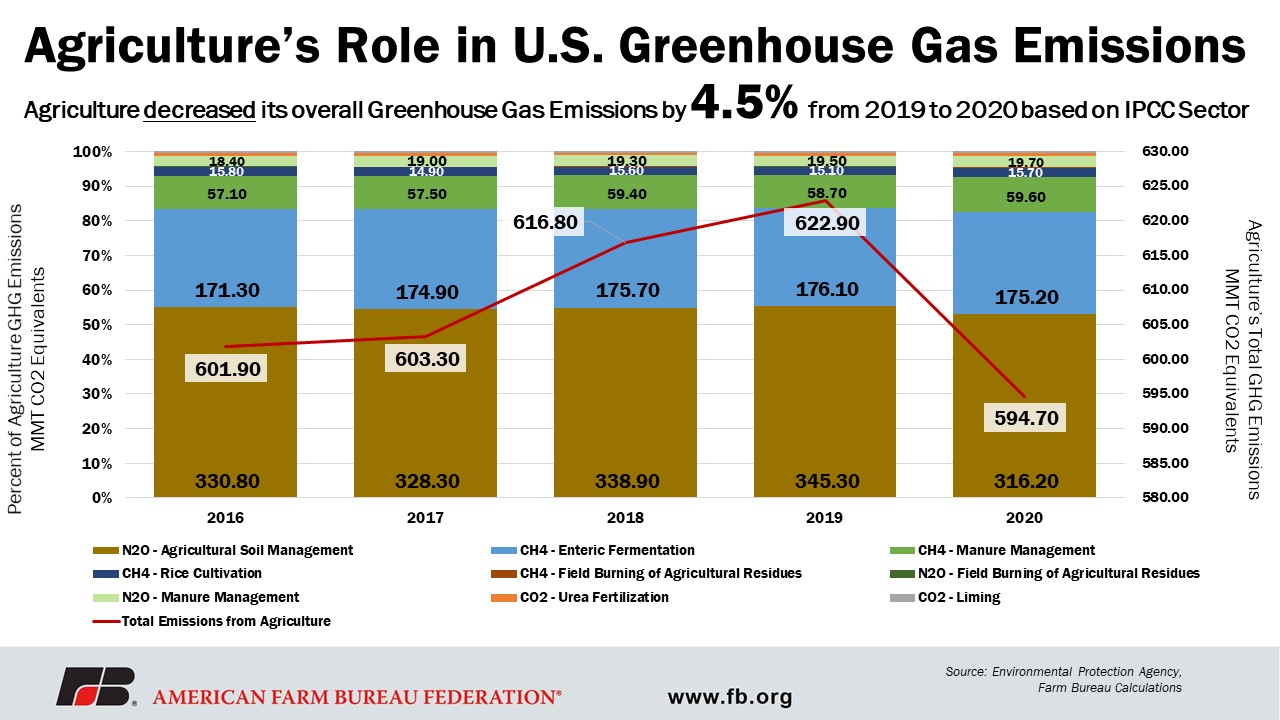
Following agricultural soil management, livestock-related emissions from enteric fermentation and manure management contributed 175 million metric tons and 79 million metric tons, respectively, to total U.S. emissions. These two emission sources represented 40% of agricultural emissions, but only 4% of total U.S. emissions. Other agricultural emissions sources include carbon dioxide from fossil fuel combustion at 39 million metric tons, rice cultivation at 15 million metric tons, urea fertilization at 5.3 million metric tons, liming at 2.4 million metric tons, mobile combustion at 1.3 million metric tons and field burning at 0.6 million metric tons. Combined, these categories represented less than 8% of agricultural emissions and 1% of U.S. emissions. As a percent of total U.S. emissions, and depending on the estimation methodology, U.S. agriculture represents approximately 10% of total U.S. emissions.
Agricultural Productivity and Emission Trends
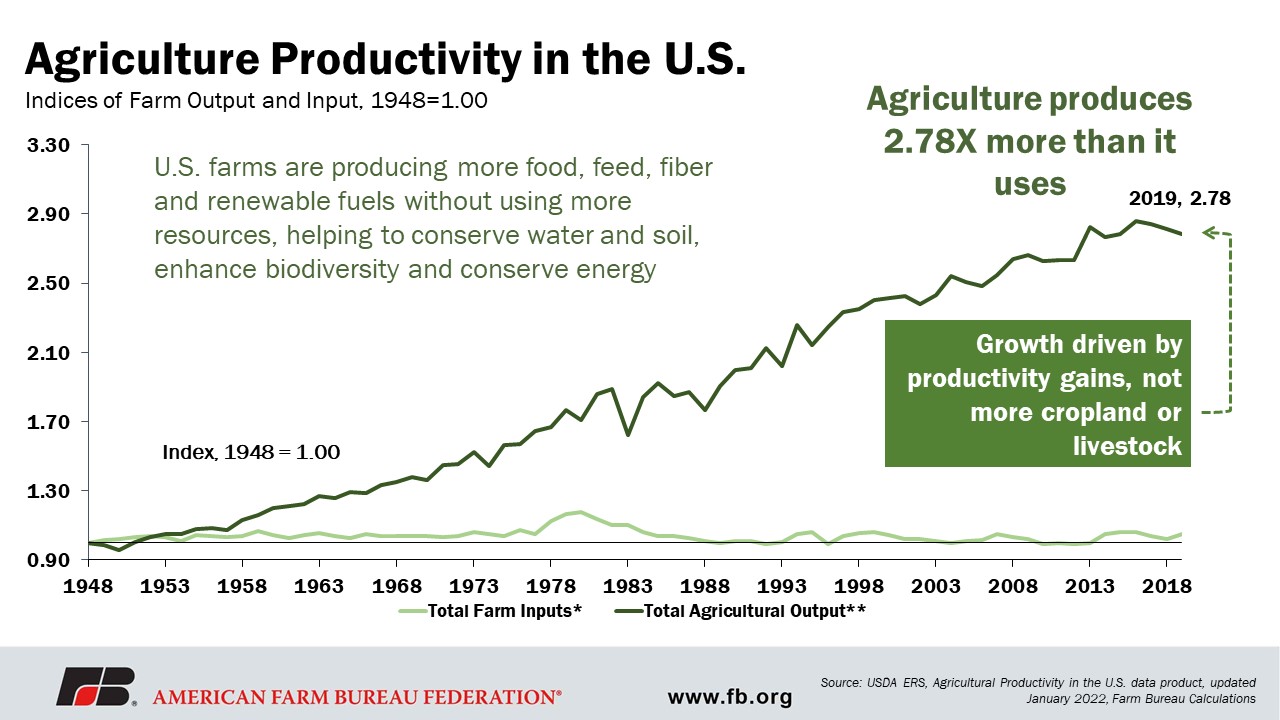
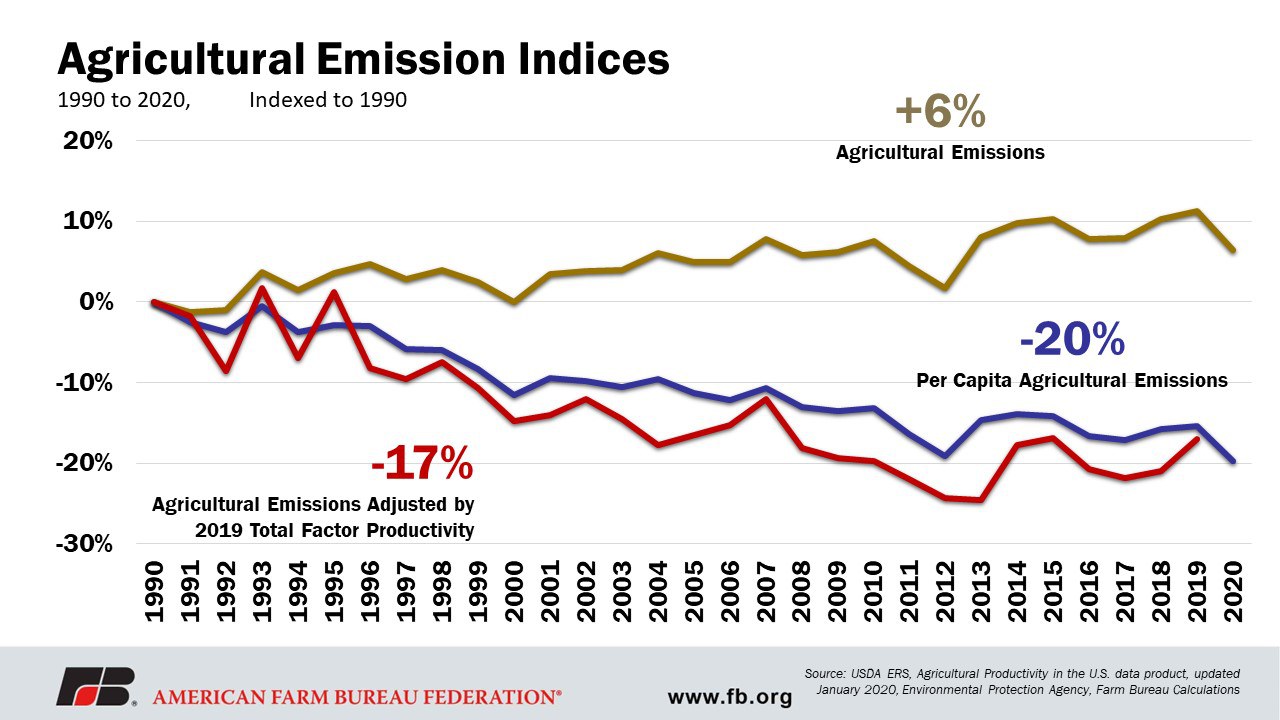
A comparison of 2020 emissions to 1990 emissions shows U.S. agricultural emissions have increased by 6%. However, that’s not the full story. Productivity is increasing, as is the global population, while emissions are on the decline. Innovation and advancements in technology have also allowed farmers and ranchers to increase their productivity while using the same amount of inputs. Compared to 1948, farmers and ranchers are producing 2.78 times more in output per unit of input they use, according to USDA’s Economic Research Service estimated indices of farm output, input and total factor productivity (Agricultural Productivity in the U.S.). Even more impressive, productivity is rising, while cropland is declining – by 30 million acres over the last three decades. This means that farmers and ranchers continue to produce more using fewer resources and the additional decrease in agricultural emissions shows that voluntary, market-based incentives are helping farmers and ranchers accomplish this milestone.
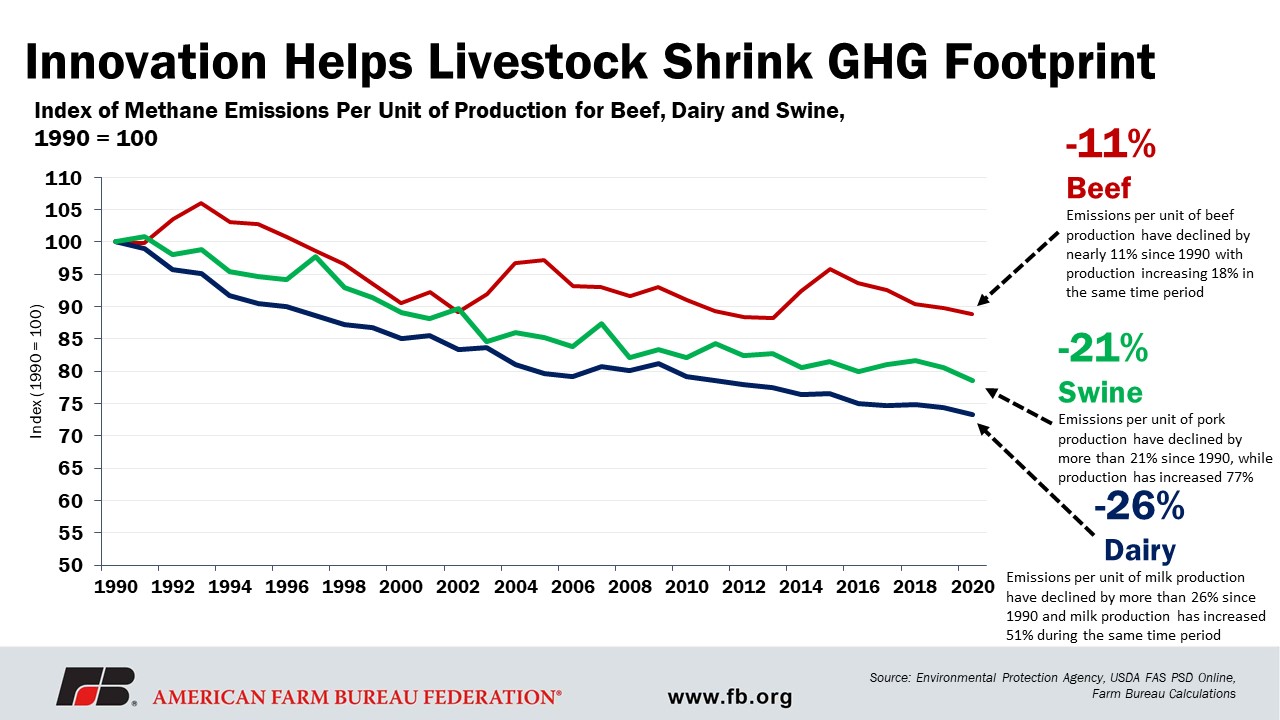
For agriculture, production of food is important not just for farmers and ranchers, but also for the millions of families in the U.S. and around the world that U.S. agriculture feeds. When considering productivity gains compared to agricultural emissions, agriculture has been remarkable at sustainable intensification, in addition to adding practices that even further shrink its environmental footprint. These improvements have been in crop yields, animal nutrition and breeding. When compared to 1990, the U.S. is producing 77% more pounds of pork, but decreasing its emissions per unit of pork production by 21%; the U.S. is producing 51% more milk than in 1990 but has decreased its per unit of milk production emissions by 26%; and U.S. farmers and ranchers are producing 18% more beef while reducing beef production per unit emissions by 11% since 1990.
Not only have producers focused on improvements to production and sustainability, but they have also focused on feeding more families, in the U.S. and globally. Since 1990, U.S. agricultural emissions have increased by 6%, but the U.S. population has increased 33% in that same period of time, adding over 81 million people in three decades. This means U.S. agriculture has been called upon to feed more people than ever before. With the advancements in innovation and technology, agricultural emissions per capita have declined 20% since 1990.
Summary
During 2020, U.S. emissions from all man-made sources totaled 5.9 billion metric tons in CO2 equivalents, a decrease of 9% from 2019, largely due to impacts from COVID-19. When taking into consideration carbon trapped in the soils through forestry, grasslands, wetlands and cropland, U.S. greenhouse gas emissions were reduced by almost 13% to a net emissions level of 5.2 billion metric tons, a decrease of 10.6% compared to 2019, and the lowest emissions level on record.
Emissions related to agriculture totaled 635 million metric tons during 2020, down more than 4.3% from the previous year. Based on Intergovernmental Panel on Climate Change methodology, U.S. agricultural emissions totaled 594 million metric tons in 2020, a decrease of over 4.5% compared to 2019. As a percentage of total U.S. emissions, U.S. agriculture continues to be just 10% of all greenhouse gas emissions, with livestock-related emissions about 4%.
When factoring in productivity and population gains, however, both per unit and per capita agricultural emissions are declining. That means U.S. agriculture is producing more food, fiber and renewable fuel for more people while using fewer resources and emitting fewer greenhouse gases. The additional efforts to adopt conservation practices through voluntary, market-based incentives have helped farmers and ranchers trap 759 million metric tons of carbon in the soils, representing 12.7% of total U.S. emissions.
The latest report shows that when agriculture is recognized as a partner in reducing greenhouse gas emissions, farmers and ranchers have more opportunities to utilize voluntary, market-based incentives that work to reduce environmental footprints while helping farmers and ranchers economically produce the food, fiber and renewable fuel U.S. families, and the world, rely on. With additional investment in agricultural research, farmers and rancher can be part of the development of new cutting-edge plant and animal technologies that capture more carbon in the soil and reduce livestock-related emissions, while generating multiple environmental benefits.
Top Issues
VIEW ALL