Reviewing U.S. Carbon Sequestration
TOPICS
Greenhouse Gas
photo credit: AFBF photo, Morgan Walker
John Newton, Ph.D.
Vice President of Public Policy and Economic Analysis
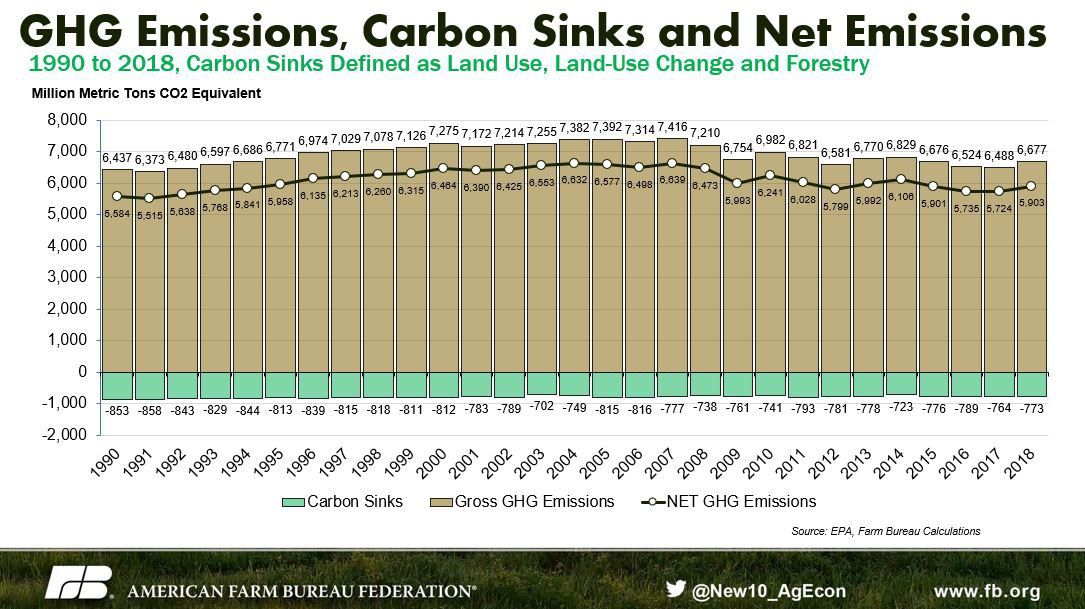
The most recent data from the Environmental Protection Agency’s Greenhouse Gas Inventory Data Explorer reveals U.S. greenhouse gas emissions in 2018 totaled 6.7 billion metric tons in CO2 equivalents, up 2%, or 188 million metric tons, from the prior year (Agriculture’s Greenhouse Gas Emissions and Sinks). Compared to 1990, U.S. GHG emissions have increased by 4%, or 240 million metric tons.
To offset GHG emissions and reduce atmospheric CO2, carbon can be trapped in soils through various carbon sink activities such as the growth of trees, forestry management that reduces forest fires and forest degradation, increasing below-ground plant matter and sequestering carbon in soils through cropland, wetland or grassland management. A variety of carbon-capturing practices are used on agricultural lands, including but not limited to conservation cover crops, no-till or reduced tillage, anaerobic digesters and nutrient management, e.g., GHG and Carbon Sequestration Ranking Tool.
EPA data reveals that during 2018 carbon sequestration efforts resulted in an increase in CO2 stocks, i.e., carbon removed from the atmosphere, of 764 million metric tons. CO2 removals in 2018 represented 12% of the total GHG emissions and resulted in reducing net GHG emissions to 5.7 billion metric tons. Since 1990, the ability to reduce carbon stocks through land and forestry management practices has decreased by approximately 9%, or 80 million metric tons of CO2 equivalent. Today’s article reviews trends in carbon offsets achieved through forestry, grassland, cropland and wetland management.
Land Use Categories in the U.S.
There are five primary land use categories for measuring both carbon emissions and carbon sinks related to land use, land-use changes and forestry. Grassland is the largest land use category and is composed principally of grasses, sedges, rushes, forbs or shrubs suitable for grazing and browsing, woody plants, drained wetlands, pasture, rangeland and land with three or fewer years of continuous hay production. Savannas, deserts and tundra are also considered grassland. Grassland vegetation practices that may result in CO2 emissions include clearing, burning, chaining or chemical application. Grassland in the U.S. during 2018 totaled 898 million acres, or 39% of total U.S. area, and has increased by 2.7 million acres, or 0.3%, since 1990.
The second-largest land use category is forestland. Forestland represents land area that is at least 1 acre in size with at least 10% cover by live trees and includes land that has tree cover that will be naturally or artificially regenerated. Land in transition zones, i.e., areas between forestland and non-forestland, such as urban zones, that have at least 10% tree cover are also categorized as forestland. In addition, forestland includes unimproved roads, trails, streams and clearings in forest areas, as long as they meet certain size criteria. Forestland does not include land that is predominantly used for farming or land that is completely surrounded by urban or developed areas. Forestland in the U.S. during 2018 totaled 716 million acres, representing 31% of U.S. land area; it has declined by 2.7 million acres, or 0.4%, since 1990.
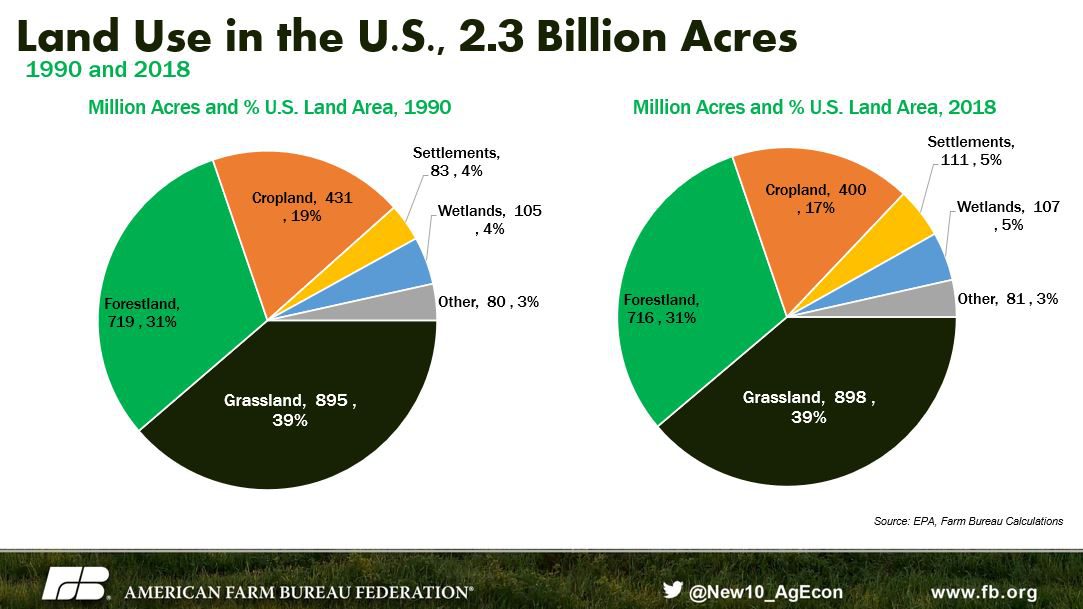
Following forestland, the third-largest land use category in the U.S. is cropland. Cropland includes land area used to produce traditional row crops, perennial crops, horticultural crops, pastureland or hay land, fallow land and Conservation Reserve Program lands. Cropland in the U.S. during 2018 totaled 400 million acres and represented 17% of U.S. land area. Since 1990, total cropland has declined by 31 million acres, or 7%.
The remaining 13% of U.S. land area is found in settlements, wetlands and other land uses. Settlements include residential, industrial, commercial and institutional land; commercial sites such as construction sites, airports, golf courses or public administrative sites; parks in urban areas; and highways, roads and other transportation facilities. Settlements also include tracts that meet the definition of forestland, but are surrounded by urban or developed areas, as well as land tracts that may meet the definition of cropland, grassland or other land but are surrounded by urban or built-up land. Settlements also include rural corridors such as highways and railroads within other land uses, i.e., forestland, cropland and grassland. During 2018, there were 111 million acres of settlements, up 28 million acres, or nearly 34%, from 1990.
Wetlands include lakes, reservoirs and rivers as well as land covered or saturated by water for all or a part of the year. Managed wetlands are those where the water level is managed or artificially changed, e.g., rice cultivation, cranberry or sugar production. Wetlands also include wet meadows dominated by grass cover and forestland near waterways. There were 107 million acres of wetlands in the U.S. during 2018, an increase of nearly 2 million acres, or 1.7%, from 1990.
Finally, “other” land includes bare soil, rock, ice and all other land areas that do not fall into any of the other five land-use categories. Stock changes and emissions are not measured for this land use category. In 2018 there were 81 million acres of other land in the U.S., 1.2 million acres, or 1.5%, higher than in 1990.
Since 1990, the largest land use changes have been observed in cropland, where more than 30 million acres have come out of production. The decline in cropland is equivalent to more than 1 million acres lost per year. The reduction in cropland hampers our ability to capture carbon in the soil through enhanced conservation practices and new technology adoption.
Land Use, Land-Use Changes and Forestry Fluxes
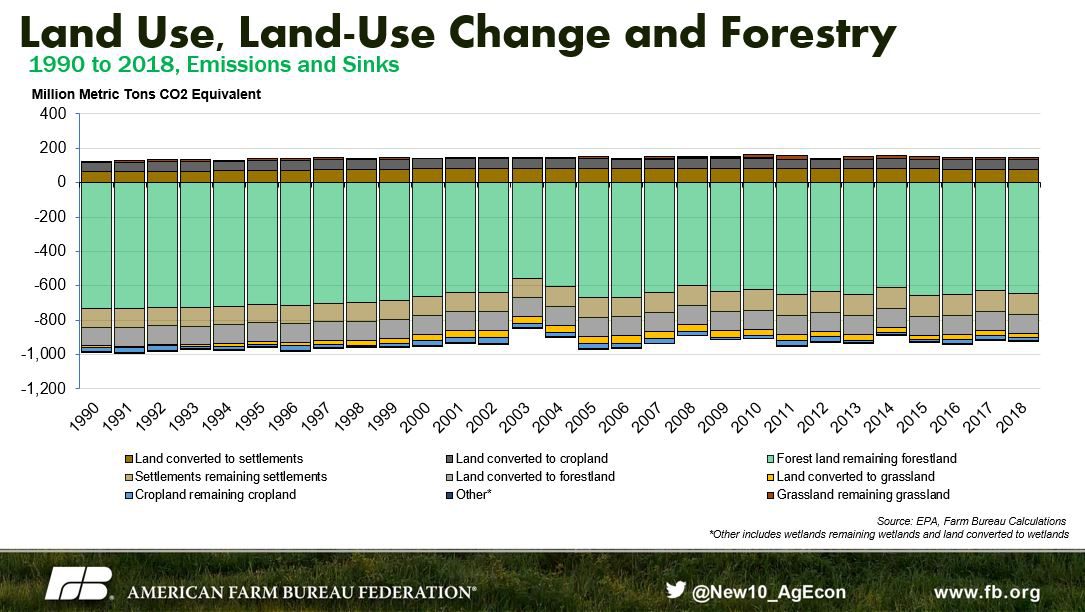
The net of carbon emissions and carbon sinks is described as the carbon flux. Fluxes are measured for each land use category
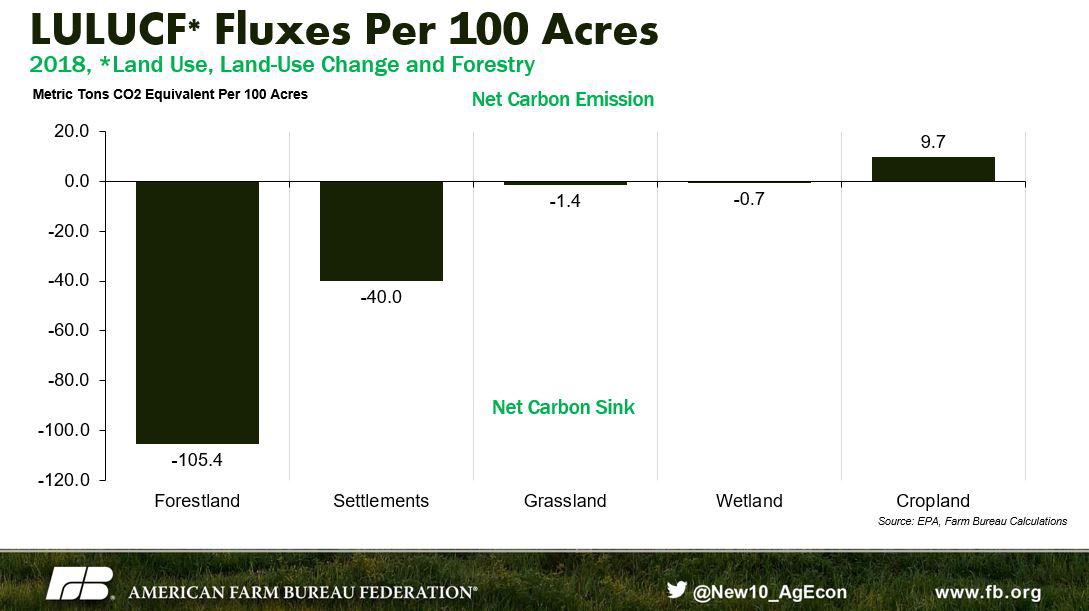
The largest carbon flux in 2018 was forestland, which included both land remaining in forestland as well as land converted to forestland. Forestland that remained forestland contributed to a carbon sink of 644 million metric tons in CO2 equivalents, nearly 16 million metric tons below the prior year, representing an improved carbon sink of 2%. Land converted to forestland contributed to a carbon sink of 111 million metric tons in 2018, mostly unchanged from 2017. Combined, these two land use categories resulted in a carbon sink of 754 million metric tons in CO2 equivalents during 2018, 15.5 million metric tons lower than the prior year. Based on the 754 million metric tons in sinks, and the 716 million acres of forestland, every 100 acres of forestland represents an average sink of 105 metric tons each year. Despite forestland area remaining mostly unchanged, since 1990, the net carbon flux of forestland has declined by 87 million metric tons, or nearly 16%.
Following forestland, the second-largest carbon flux were settlements. Settlements remaining settlements contributed to a carbon sink of nearly 124 million metric tons, slightly above 2017, but nearly 16 million metric tons lower than 1990. These changes in carbon stocks are due to carbon in organic soils, trees and landfilled yards, as well as emissions from fertilizer applications to soil. Land converted to settlements increased carbon emissions by 79 million metric tons in CO2 equivalents during 2018. The increase in carbon stocks was due to changes in land use and stock changes in biomass. Combined, settlements represented a carbon sink of 44 million metric tons, in line with prior-year levels. Based on the total flux, settlements in 2018 contributed to a carbon sink of 40 metric tons per 100 acres.
Carbon sequestration on cropland totaled 16.6 million metric tons during 2018, slightly below the prior year. Land converted to cropland reduced carbon stocks by 55.3 million metric tons, in line with 2017. Combined, the total flux from cropland during 2018 represented emissions of 38.7 million metric tons. On a per-acre basis, the total cropland flux represented emissions of 9.7 metric tons per 100 acres. Importantly, the net emissions flux on cropland has remained consistent over the last 30 years, despite significant productivity gains in agriculture, e.g., USDA’s Economic Research Service estimates cropland productivity has increased by nearly 50% since 1990. In other words, agriculture is able to grow more food and fibers and produce more renewable fuels while keeping the net carbon flux mostly unchanged. When agricultural emissions and sinks associated with crop or livestock production are included, the increased productivity contributes to lower per-unit emissions.
Lands converted to grassland contributed to a carbon sink of nearly 24.6 million metric tons, slightly below prior-year levels. The management of grassland, including changes in management, contributed to an increase in carbon emissions of 11.8 million metric tons. Combined, grassland represented a carbon sink of 12.8 million metric tons. Based on the total flux, grassland contributed to a carbon sink of 1.4 tons per hundred acres.
Finally, wetlands remaining wetlands and land converted to wetlands represented a carbon sink of 726,000 metric tons in 2018. Given 107 million acres of wetlands, carbons sinks for wetlands represented 0.7 tons per 100 acres.
Summary
During 2018, U.S. greenhouse gas emissions totaled 6.7 billion metric tons in CO2 equivalents, up 2%, or 188 million metric tons, from the prior year. When measured using the United Nations Framework Convention on Climate Change, an international standard, agriculture’s contribution to greenhouse gas emissions totaled 619 million metric tons, representing 9.3% of total U.S. emissions.
Of all the land types, forestland, via the management and conversion of land into forestry, holds the most carbon for the longest time, according to EPA data. During 2018, a net flux representing 754 million tons of carbon captured in the soil was attributable to forestry, representing a net carbon sink of 105 tons per 100 acres. More optimistic (but dated) estimates from USDA and EPA suggest as much as 1,000 metric tons of carbon could be captured per 100 acres through reforestation or afforestation efforts.
The challenge with expanding carbon sequestration through reforestation and afforestation is the significant reallocation of land use it would require, i.e., millions of acres of land would need to be taken out of pasture, cropland, wetlands or settlements and planted to forests.
While always open to new climate-smart practices and technology to reduce emissions levels, farmers and ranchers could play an even larger role in the future to help us achieve our climate goals by adopting voluntary practices to offset GHG emissions, such as trapping carbon in the soil through increased conservation cover and reduced tillage. For livestock, increasing the number of anaerobic digesters and improved nutrient management and feed efficiency will help to reduce carbon emissions.
Voluntary and incentive-based tools, including financial and technical support, can help farmers more rapidly adopt these climate-smart and GHG-mitigating practices on the farm. Moreover, to maximize these efforts we should seek to preserve cropland in the U.S. Since 1990, total cropland has declined by 31 million acres, representing more than 1 million acres lost per year. This challenge also highlights the importance of investing in agricultural research to develop new technologies and tools to help us achieve our climate goals by capturing more carbon in our soils without jeopardizing the production of the world’s food, fiber and renewable biofuels.
Top Issues
VIEW ALL