A Mixed Bag for Soybean and Corn Exports

photo credit: JAXPORT / CC BY 2.0
John Newton, Ph.D.
Vice President of Public Policy and Economic Analysis
As harvest wraps for the year we now turn our attention to the pace of consumption. There are two primary data sources to monitor weekly grain and oilseed exports. One USDA’s Federal Grain Inspection Service reports export grain inspections by commodity, port and destination. Two, USDA’s Foreign Agricultural Service’s U.S. Export Sales report includes weekly exports, accumulated exports, sales and outstanding sales.
These two data sources provide an opportunity to evaluate the pace of exports throughout the marketing year relative to USDA’s World Agricultural Supply and Demand Estimates export projections. Today’s article is the first of a weekly series monitoring the pace of grain and oilseed consumption.
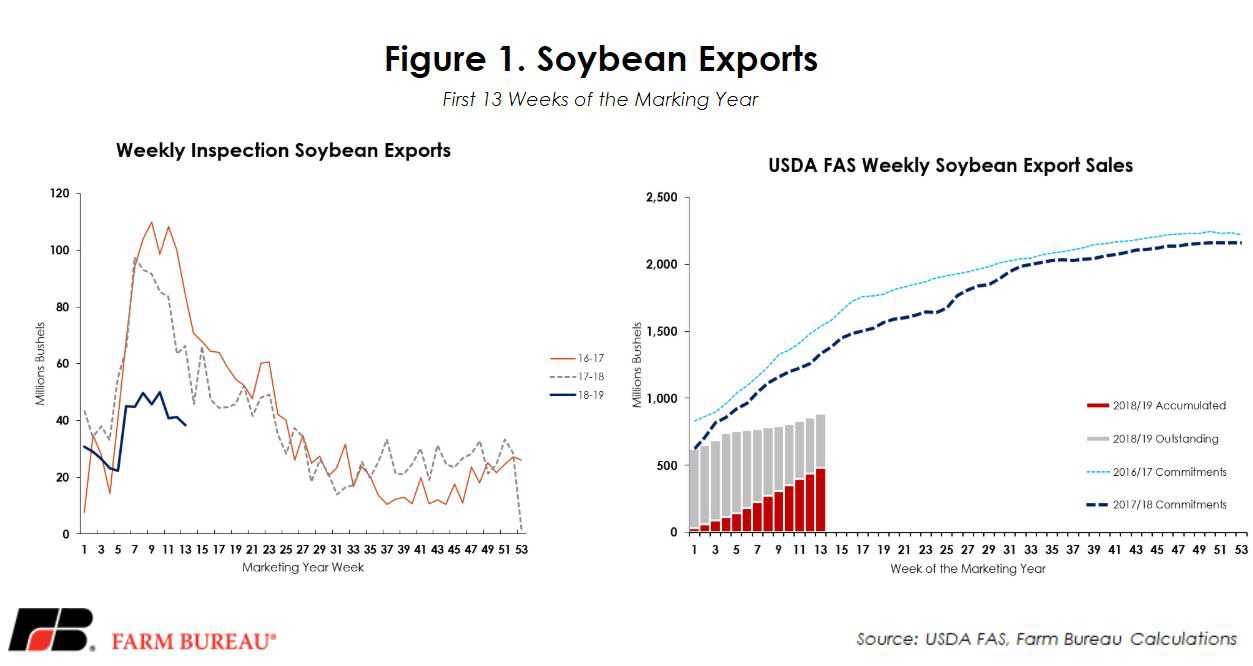
Pace of Soybean Exports
USDA’s Nov. 8 WASDE report projected soybean exports at 1.9 billion bushels for marketing year 2018/19, down 11 percent, or 229 million bushels, from the previous year. If realized, the 2018/19 export volume for soybeans will be the lowest since 2014.
Export Grain Inspections
This week, USDA’s Federal Grain Inspection Service revealed total soybean export inspections through the first 13 weeks of the marketing year at 487 million bushels, down 43 percent, or 363 million bushels, from 2017/18 marketing year inspections. Historically, through the first 13 weeks of the marketing year, 43 percent of total export inspections have been reported. If the current pace of export inspections were to continue – and relative to the historical trend – soybean export inspections would likely fall between 1.1 billion and 1.2 billion bushels – well below USDA’s current projection for 1.9 billion bushels.
Export Commitments
USDA’s Dec. 7 Foreign Agricultural Service’s Export Sales Report indicated accumulated soybean exports of 484 million bushels and 403 million bushels of outstanding soybean sales through the first 13 weeks of the marketing year. The total committed volume is currently 887 million bushels, representing a decline of 445 million bushels, or 33 percent, from last year’s 1.3 billion bushels committed. This is the lowest export commitment volume since the 2011/12 marketing year when 782 million bushels were committed through week 13.
Total soybean commitments currently stand 1 billion bushels below USDA’s projection. For the 2016/17 and 2017/18 marketing years, total export commitments through the first 13 weeks have represented 71 percent and 63 percent of total marketing year export volume, respectively. Applying this historical pace to the current pace of exports points toward a soybean export volume near 1.3 billion bushels – again well below USDA’s current projection.
Figure 1 highlights the pace of soybean exports using both the grain inspections and export sales.
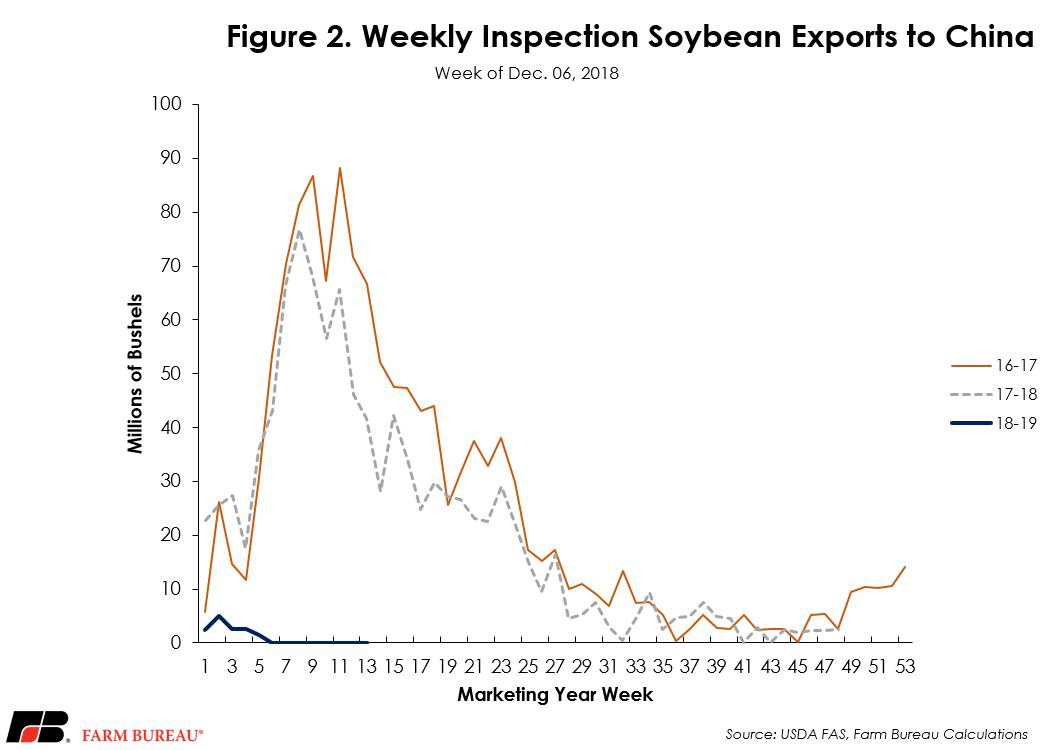
Impact of China
Revised from the previous WASDE report due to limited U.S. commitments to China, Chinese imports of soybeans have been lowered by 4 million metric tons, from 94 million metric tons to 90 million metric tons. Since China is the largest importer of soybeans, the net effect is an approximately 2-million-ton reduction in total global soybean exports, pushing them down to 155.4 million tons.
Based on grain inspection data, through the first 13 weeks of the marketing year total U.S. soybean exports to China are down 98 percent from last year, representing a 579-million-bushel decrease. Figure 2 represents the weekly inspection of soybean exports to China. A recent Market Intel article, U.S. Soybean Exports to China Fall Sharply, highlighted the slowdown in soybean exports to China.
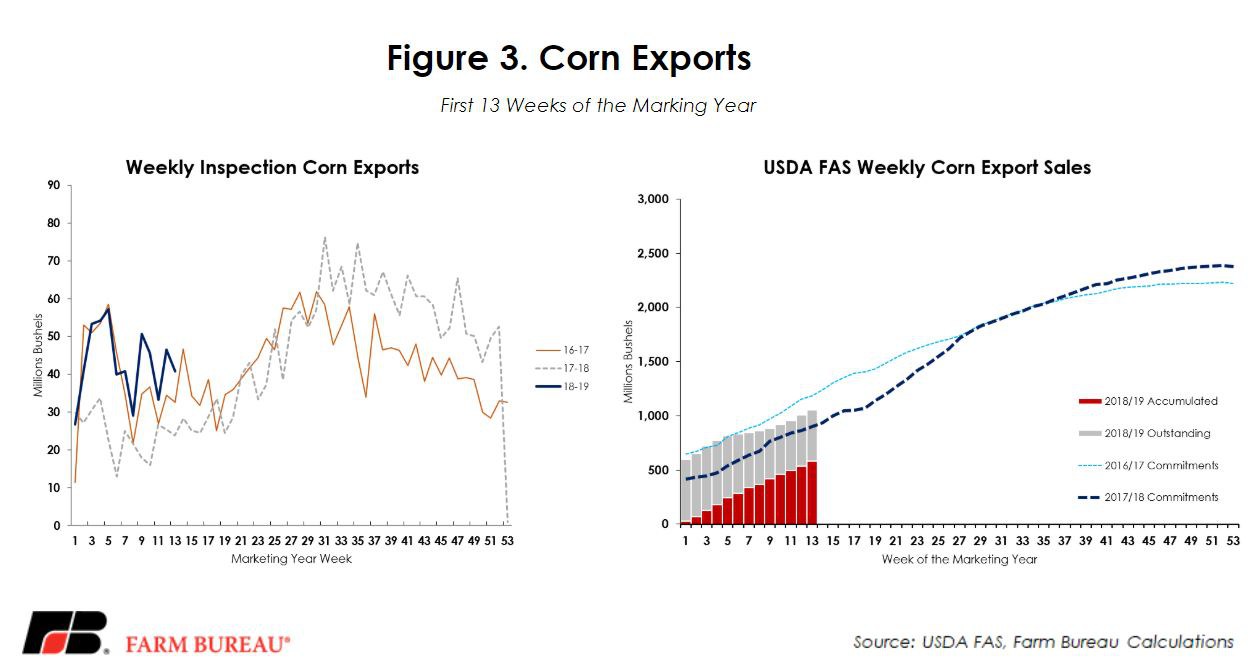
Pace of Corn Exports
USDA’s Nov. 8 WASDE report projected corn exports at a record-high 2.45 billion bushels for marketing year 2018/19, up slightly from the previous year’s record of 2.438 billion bushels.
Export Grain Inspections
Corn export inspections through the first 13 weeks of the marketing year total 559 million bushels, up 78 percent, or 245 million bushels, from inspections during the 2017/18 marketing year. Historically, through the first 13 weeks of the marketing year, 21 percent of total export inspections have been reported. At the current pace of export inspections – and assuming the historical trend – corn export inspections could approach 2.6 billion to 2.7 billion bushels during the current marketing year. This would confirm USDA’s projection for a record-high corn export volume.
Export Commitments
USDA’s weekly export sales report indicated accumulated corn exports of 581 million bushels and 472 million bushels of outstanding corn sales through the first 13 weeks of the marketing year. The total committed volume is currently 1.05 billion bushels, representing a 152-million-bushel, or 17 percent, increase from last year’s export commitments.
Total corn commitments currently stand 1.4 billion bushels below USDA’s projection, but the current pace of exports supports USDA’s projection. In fact, if the current pace of exports were to continue, corn exports could exceed USDA’s current projection. Figure 3 highlights the pace of corn exports using both the grain inspections and export sales.
Summary
A review of the weekly export inspections and sales data points to lower soybean exports and greater corn exports than currently projected by USDA. Lower soybean exports would further increase what is expected to be a record soybean carryout in 2018/19 – pushing prices lower. It is anticipated that China could re-enter the U.S. market in the coming months. If realized, sales to China would provide a much-needed boost to soybean exports, lowering ending stocks and lifting the price outlook.
For corn, the pace of export sales combined with higher use in ethanol and animal feed are expected to result in an ending stock level of 1.736 billion bushels -- the lowest inventory level since 2015 and lowest stocks-to-use ratio—11.5 percent—since 2013. The improved outlook for corn demand is likely to lift prices higher, with USDA projecting a marketing year average price of $3.60 per bushel.
Top Issues
VIEW ALL