Bacon is Back
TOPICS
USDAMichael Nepveux
Former AFBF Economist

photo credit: Alabama Farmers Federation, Used with Permission
Michael Nepveux
Former AFBF Economist
Chicago Bacon Index
Nowadays it seems like bacon is on everything as consumers go hog wild for the most popular part of the pig. Well beyond a burger topping, bacon is being paired with everything from steak to popcorn. You’ll even find it in a glass of “bacon washed” whiskey. Spurred by this growing popularity and the price volatility that comes with it, on May 13 CME Group announced it had begun to publish a new Fresh Bacon Index to provide those across the bacon supply chain with a transparent weekly price to understand the market dynamics of bacon that is sold in the cash market.
The new index reflects the value of one load of 40,000 pounds of fresh, derind pork bellies in cents per pound. It uses a combination of negotiated and formula transactions from USDA reported data to establish a weekly bacon price each Monday. The USDA publishes prices for fresh, derind bellies on a weekly basis (LM_PK610 and LM_PK620). To calculate the index price, the number of pounds is multiplied by the price in each weight category in these USDA reports, and then summed to determine the total weekly value. This weekly value is then divided by the sum of the weights from each category, with the result being a weekly weighted average of fresh, derind bellies quoted in cents per pound.
This new index focuses on fresh pork bellies, an important distinction. CME Group used to have a successful contract that was a physically delivered contract for frozen bellies, but it slowly went out of favor as the market moved away from frozen to a fresh belly market and was delisted in 2011. Lean-hog futures are traded in Chicago, but pork-belly pricing is limited to physical markets. It should be clarified that this new bacon index is not a futures contract, it is a reference price for fresh pork bellies used to make bacon.
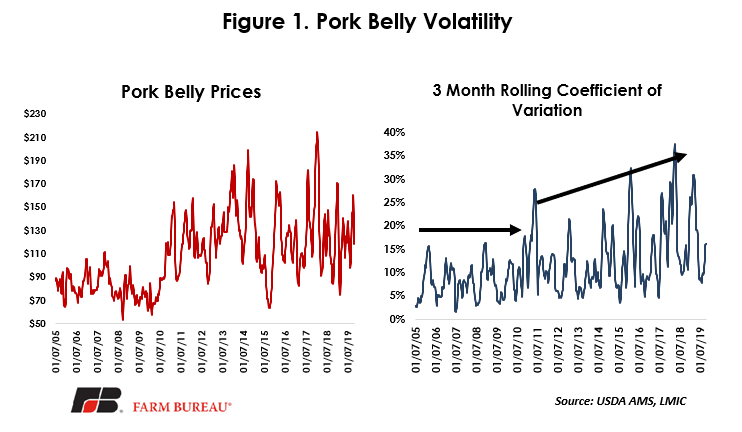
Pork Belly Volatility
One reason cited by CME Group in developing this index is increasing volatility of pork belly values in recent years. Pork bellies are the most volatile of all the pork primal cuts, with volatility increasing greatly since 2011. For most of the first decade of the 2000s, pork belly prices hovered largely in the $60-$100/cwt range, but that substantially changed in the new decade with pork belly price swings reaching as low as $63/cwt and as high as $215/cwt (Figure 1). The coefficient of variation, a measure of variability of the data in relation to the mean of the population, was reasonably steady throughout the earlier timeframe but began to spike dramatically beginning in 2011.
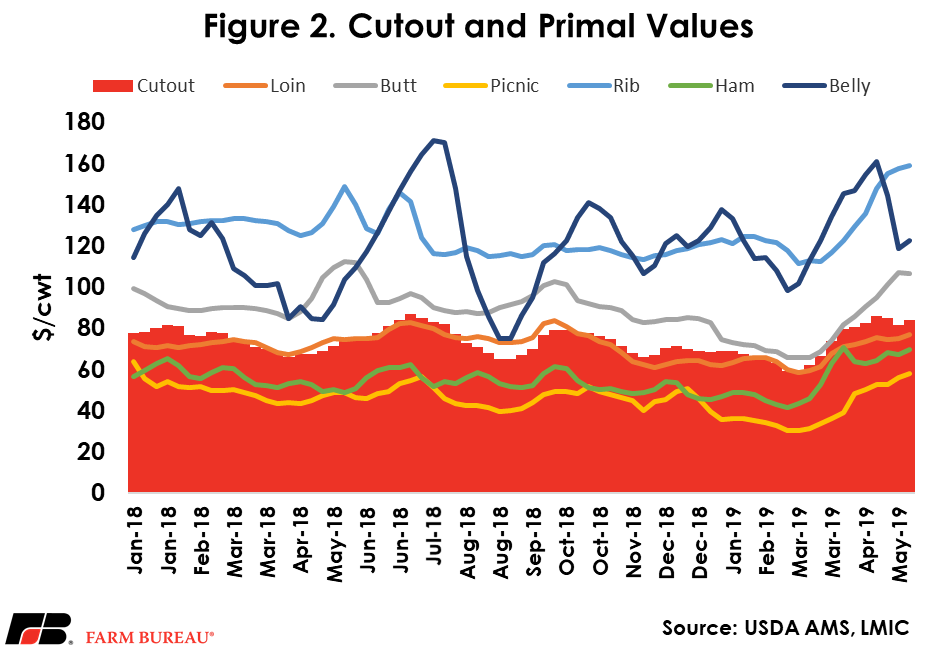
Pork Cutout
The Pork Carcass Cutout is an estimate of the value of a 53-54% lean, 205 lb. hog carcass using wholesale prices that are paid for sub-primal pork cuts. A composite value is derived each day for each of the pork primals. Those composite values are then used to represent a single composite value of the pork carcass. There are six primals for the pork carcass that are used to calculate the cutout: loin, butt, picnic, rib, ham and belly. The cutout is a series of mathematical calculations through which current pork subprimal prices and typical industry yields are used to calculate primal values. The calculated primal values are factored against their typical yield from the carcass and combined into the final cutout value. As a result of the calculated nature of the cutout, various primal values can significantly impact the final value of the cutout. Figure 2 shows the overall cutout value, as well as the values of the various primal cuts used to determine the cutout value. This is just showing the value of the primal cuts, and not taking into account yields used to determine how much each primal contributes to the cutout.
Changes in the Pork Cutout
The degree to which various subprimal and primal cuts contribute to the cutout changes over time. Figure 3 shows the current (as of May 10) cutout value relative to the three-year average. The overall value of the cutout has increased by $5.71 relative to the three-year average, with the change being mostly driven by the belly and ham primals. The loin primal, another important cut that contributes a large share to the overall value of the cutout, actually declined relative to the three-year average. It should be mentioned that volatility plays a large role here. In the matter of a month, the value of the pork belly has fallen by almost $40, a drop of approximately 25%. This results in the pork belly’s contribution to the overall value of the cutout falling from 30% to 25%.
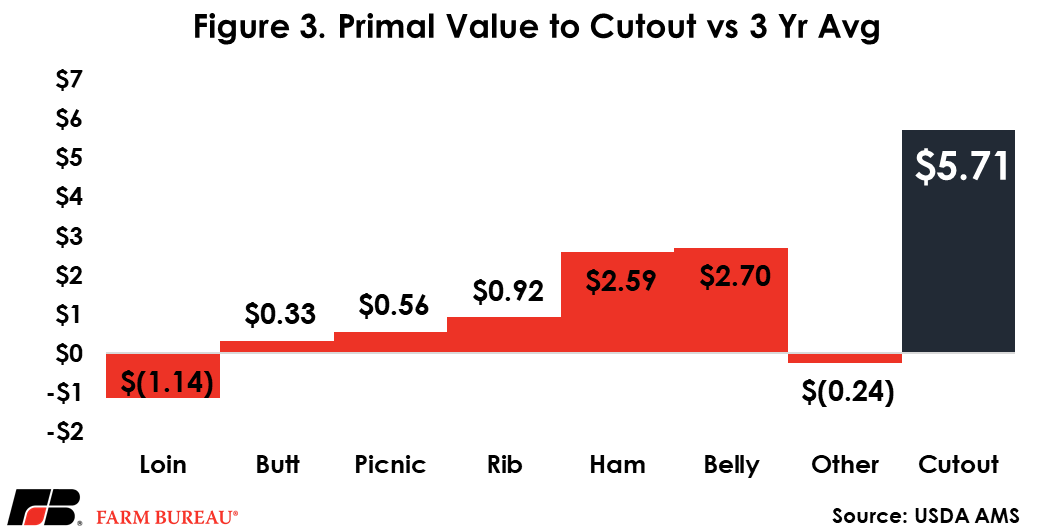
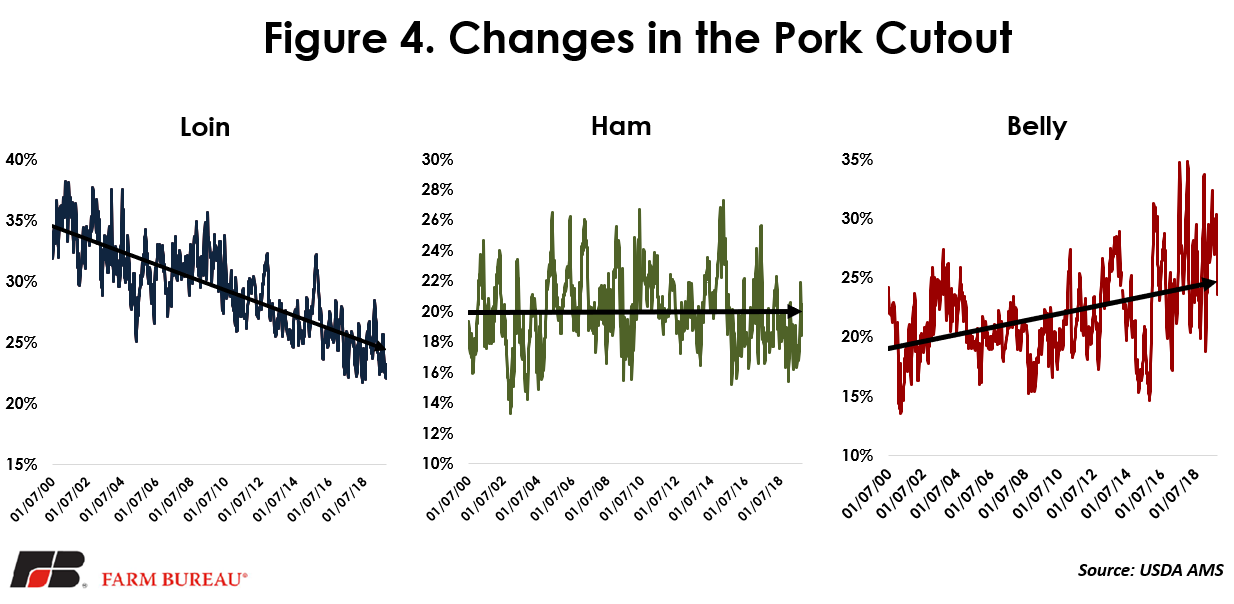
Figure 4 shows the changes in the contribution to the pork cutout over time. One interesting development is the consistent two-decade decline of the share of the loin primal, which has dropped from about 35% to less than 25%. Hams have been trending sideways throughout the time period, neither gaining nor losing share of the cutout. In contrast to loins, pork bellies have been steadily gaining share of the cutout. At the same time, increasing volatility has meant wide swings in the share of the cutout that bellies account for.
Top Issues
VIEW ALL