Cash Rents Move Lower Across Corn Belt
TOPICS
Corn
photo credit: Right Eye Digital, Used with Permission
John Newton, Ph.D.
Vice President of Public Policy and Economic Analysis
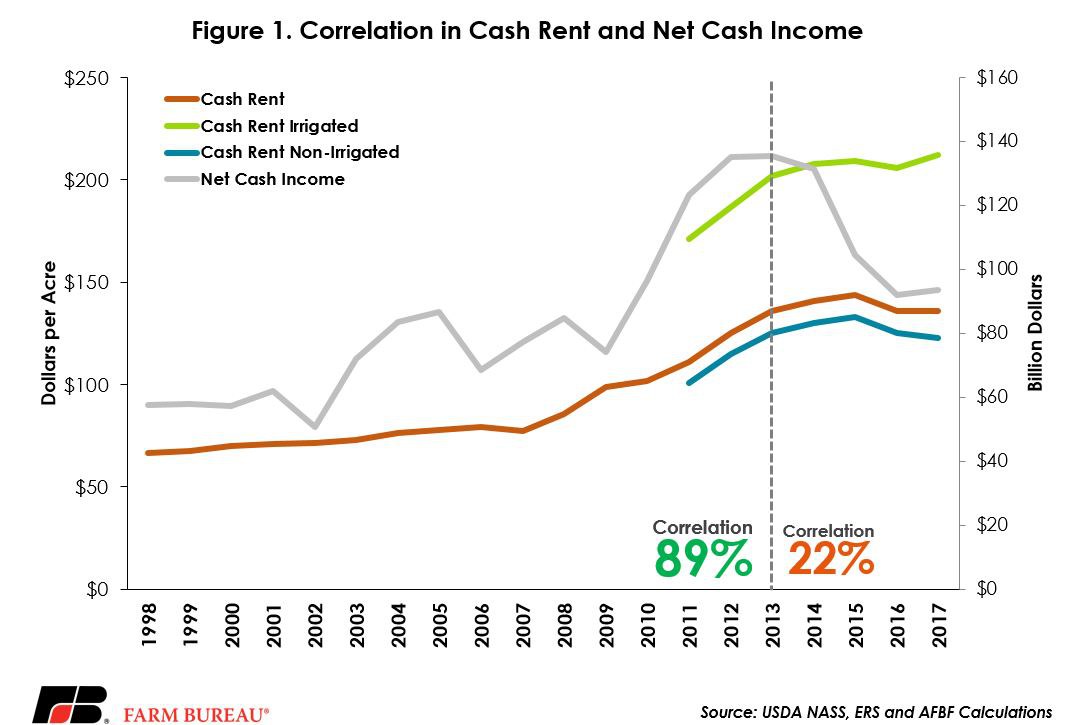
With lower commodity prices in recent years, many have wondered when asset values in cropland, farm real estate and cash rents would begin to decline in proportion to the declines in farm cash income. Prior to 2013, the correlation between cash rental rates and net cash income was nearly 90 percent. However, since 2013, a much lower level of correlation -- driven by low real estate interest rates -- has been observed at 22 percent, Figure 1. USDA’s most recent survey of cash rents along with the annual Land Values Summary confirmed that cropland, farm real estate and cash rental rates remain slow to adjust to this new period of lower farm income.
The 2008 farm bill mandated that USDA’s National Agricultural Statistics Service provide mean rental rates for all counties with 20,000 acres of cropland plus pasture. USDA’s most recent survey of cash rents and annual Land Values summary indicated the average value of cropland in 2017 was unchanged from 2016 at $4,090 per acre. The value of farm real estate, a measurement of the value of all land and buildings on farms, averaged $3,080 per acre for 2017, up $70 per acre or approximately 2.3 percent from 2016.
While the average value of cropland and farm real estate did not decline, the U.S. average cash rent for non-irrigated cropland did decline. Non-irrigated cash rents averaged $123 per acre, down $2 per acre from 2016, and down $10 per acre from the record-high observed in 2015. Irrigated cropland rents averaged a record-high of $212 per acre, up $6 per acre from 2016. Combined, the U.S. average cash rent for cropland was $136 per acre, unchanged from 2016, but down $8 per acre from the record-high in 2015 of $144 per acre.
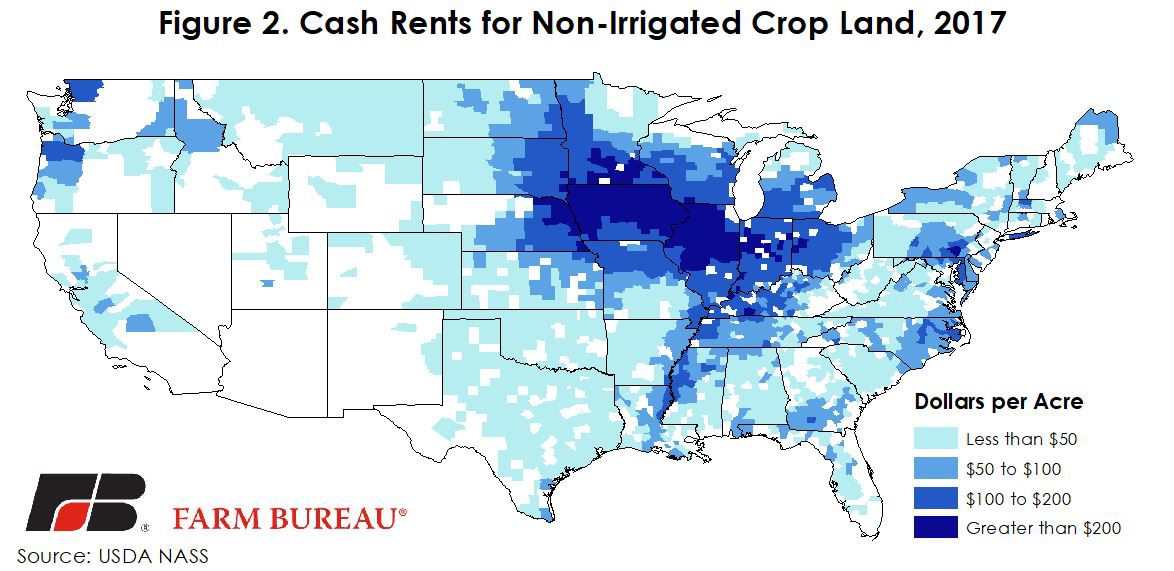
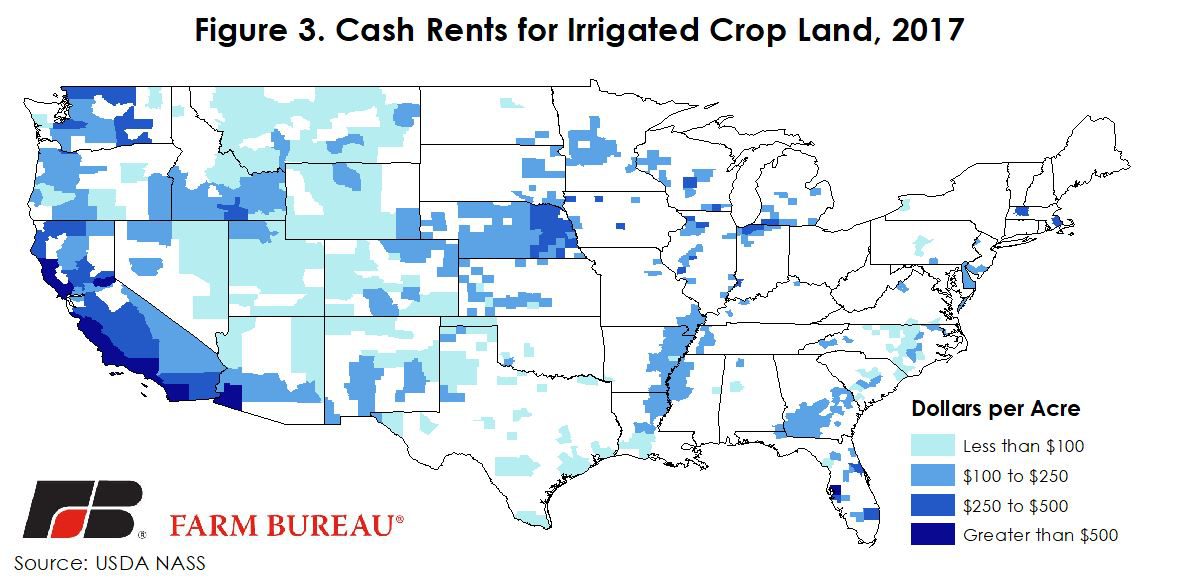
Cash rental rates varied across the U.S. and followed closely the productivity of agricultural land and the cropping practice. For non-irrigated cropland the rental rates ranged from a low of $5 per acre in parts of California and Texas to a high of $289 per acre in Logan County, Illinois, Figure 2. Rental rates were the highest in the Corn Belt where dryland productivity and the weather is the most favorable for growing traditional field crops such as corn and soybeans. In general irrigated cropland cash rents are expected to be higher than non-irrigated rents in similarly situated counties. Irrigated cash rents ranged from a low of $26 per acre in Eagle County, Colorado, to over $2,400 per acre in Orange County and Ventura County, California, Figure 3.
At the state-level, average cash rents ranged from a low of $31.50 per acre in Montana to a high of $325 per acre in California. In the “I-States” the average rental rates were observed at $231 per acre in Iowa, $218 per acre in Illinois, and $195 per acre in Indiana. These rates reflect the distribution of cropland by practice (irrigated and non-irrigated) and by crop production practice.
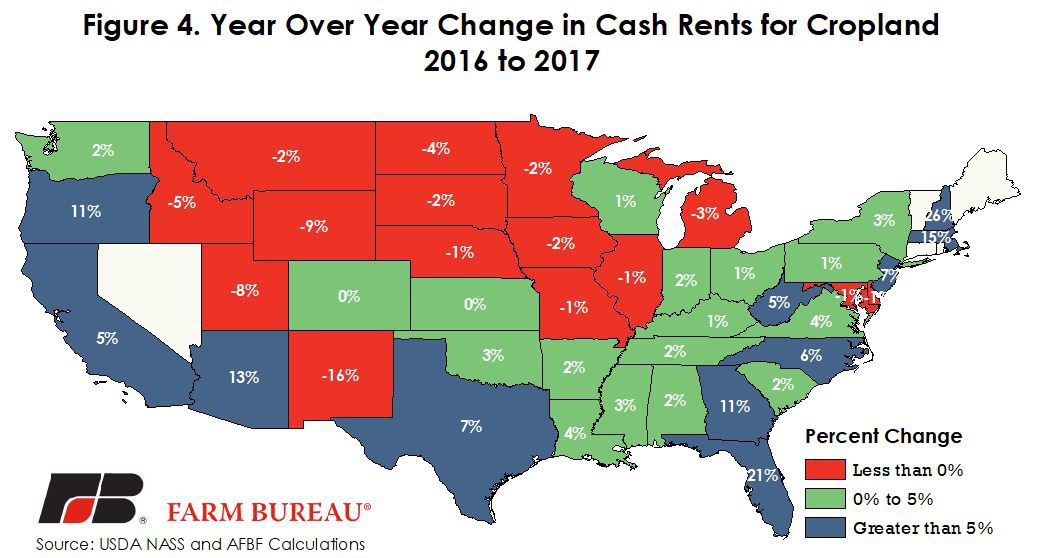
Due to the continued decline in many commodity prices, it was anticipated that cash rents would move lower in the Corn Belt. As evidenced in Figure 4, average cash rental rates in 2017 moved lower across many corn, wheat and soybean producing states. In areas where cropland returns are higher, the average rental rates moved higher. Much of the variability in cash rents is due to farmland productivity and profitability.
This cash rent data provides a way to benchmark and to determine competitive cash rental rates for upcoming crop years. Growers can use this information when negotiating with landowners and for putting together crop budgets for the upcoming crop years.
While many commodity prices are expected to be at their lowest levels in a decade, cash rents remain well above levels experienced prior to the commodity price super-cycle that began in 2006. For example, as shown in Figure 1, 2017 cash rent is 74 percent higher than the average cash rent in 2005. As evidenced, these cash rents will be slow to decline. However, given expectations for a record soybean crop and the third-largest corn crop for the 2017/18 marketing year, additional downward pressure on cash rents in 2018 is anticipated.
Top Issues
VIEW ALL