Real Estate Rising: Farmland Values Hit Record High
TOPICS
Farmland
photo credit: AFBF
Daniel Munch
Economist
Agricultural real estate values increased by $180 an acre over last year, according to USDA’s National Agricultural Statistics Service (NASS). The Land Values 2025 Summary Report, released on Aug. 1, shows a 4.3% increase, bringing the average to $4,350 per acre. This follows a 5%, or $200, increase between 2023 and 2024 and marks the fifth consecutive increase in agricultural land values. Cash rent values for cropland were up 0.6% to a record $161 per acre and pastureland rent stayed flat at $16 per acre.
This annual report provides one of many indicators of the overall health of the agricultural economy. While record rental rates are an increased production expense for renters, on the flip side, when land values stagnate or decrease, so do collateral values, limiting farmers’ ability to secure loans and access the increased capital needed to acquire higher-cost inputs.
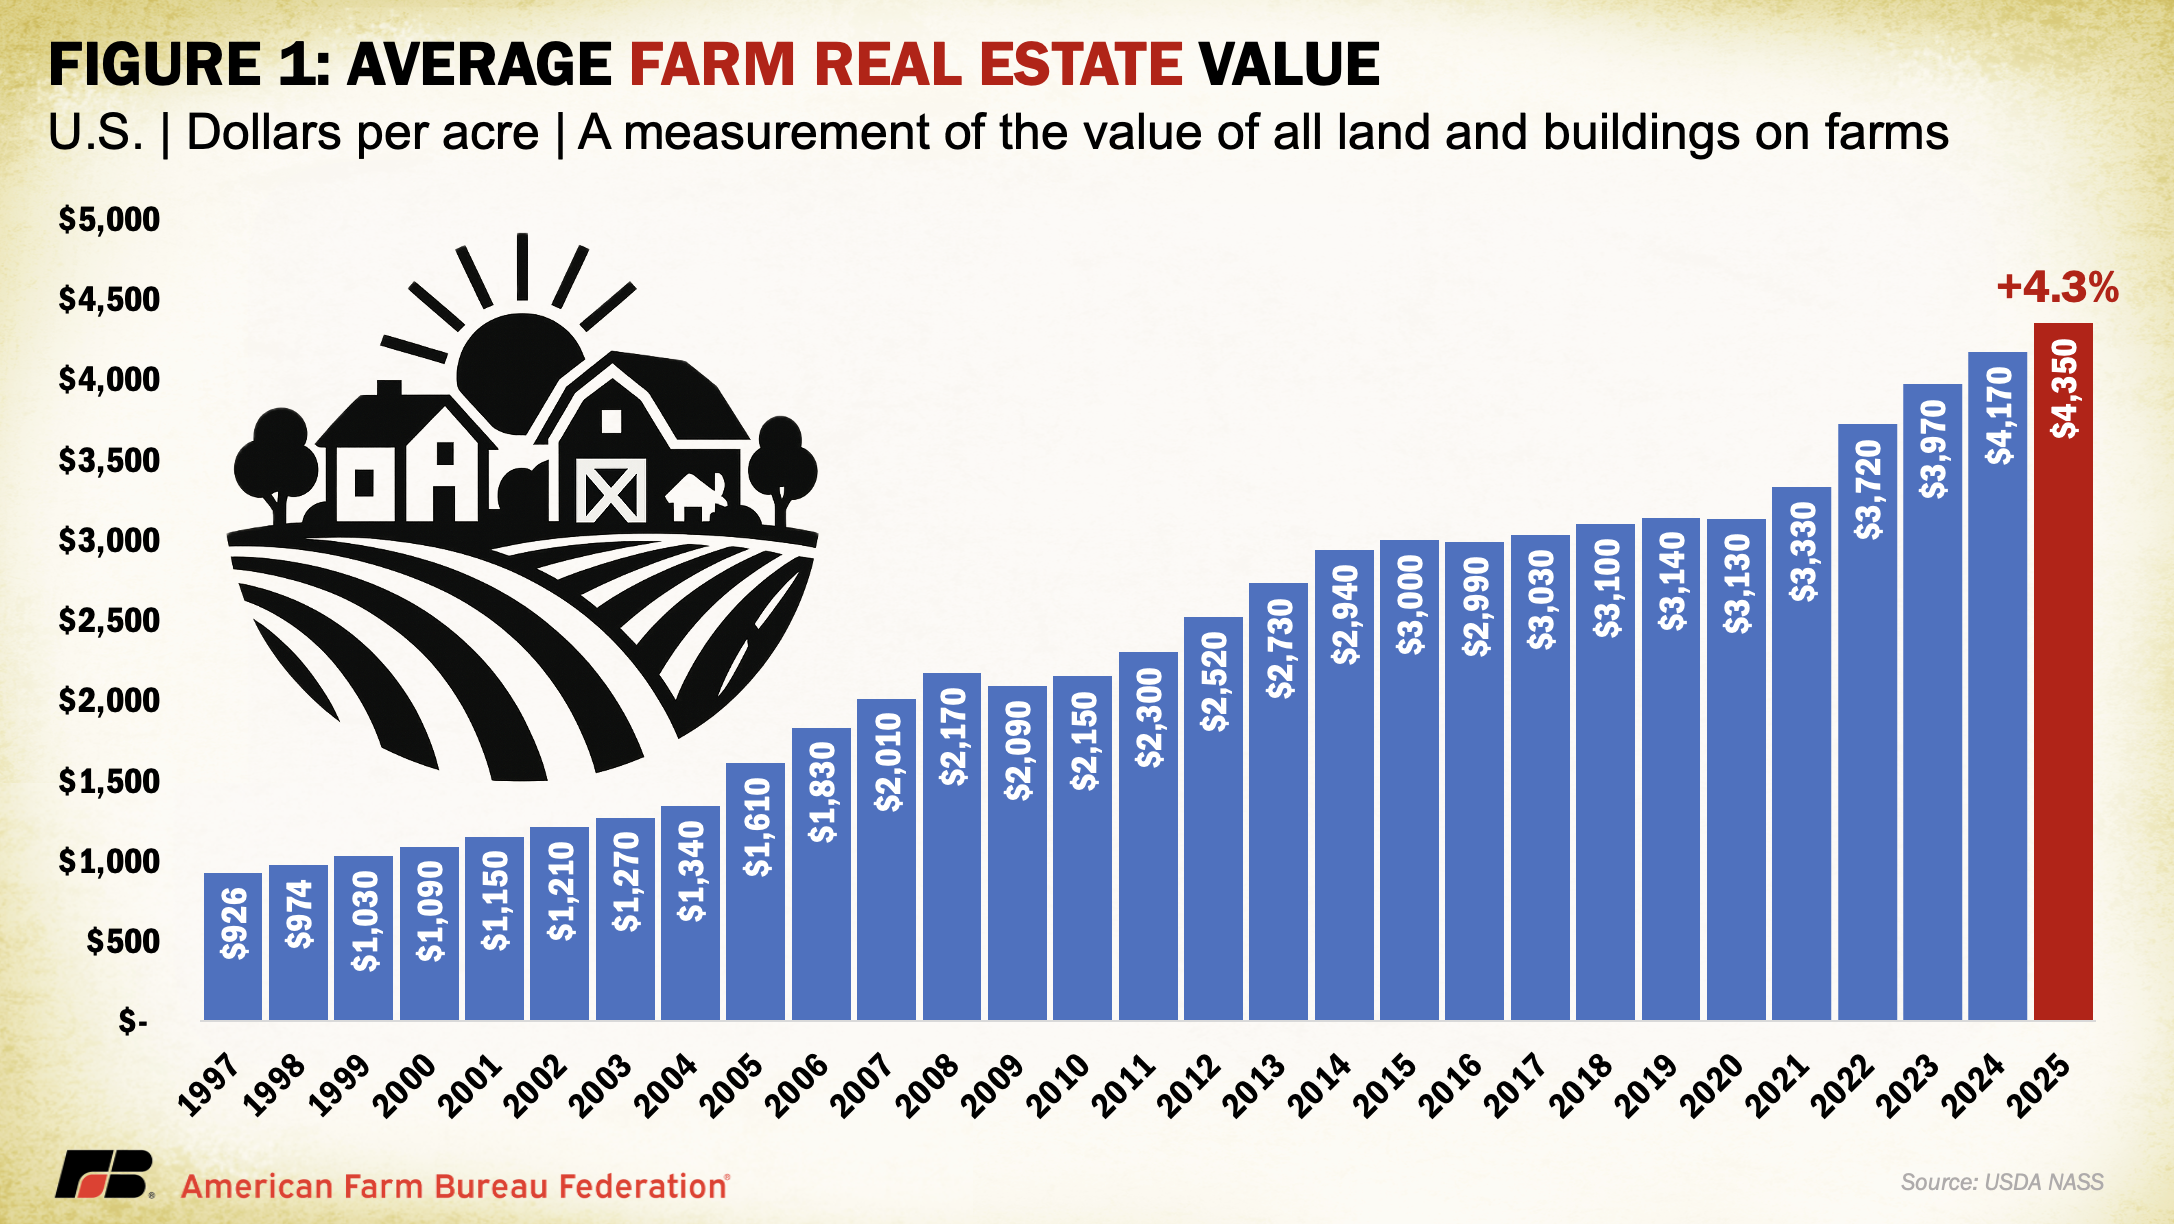
Farm Real Estate Value
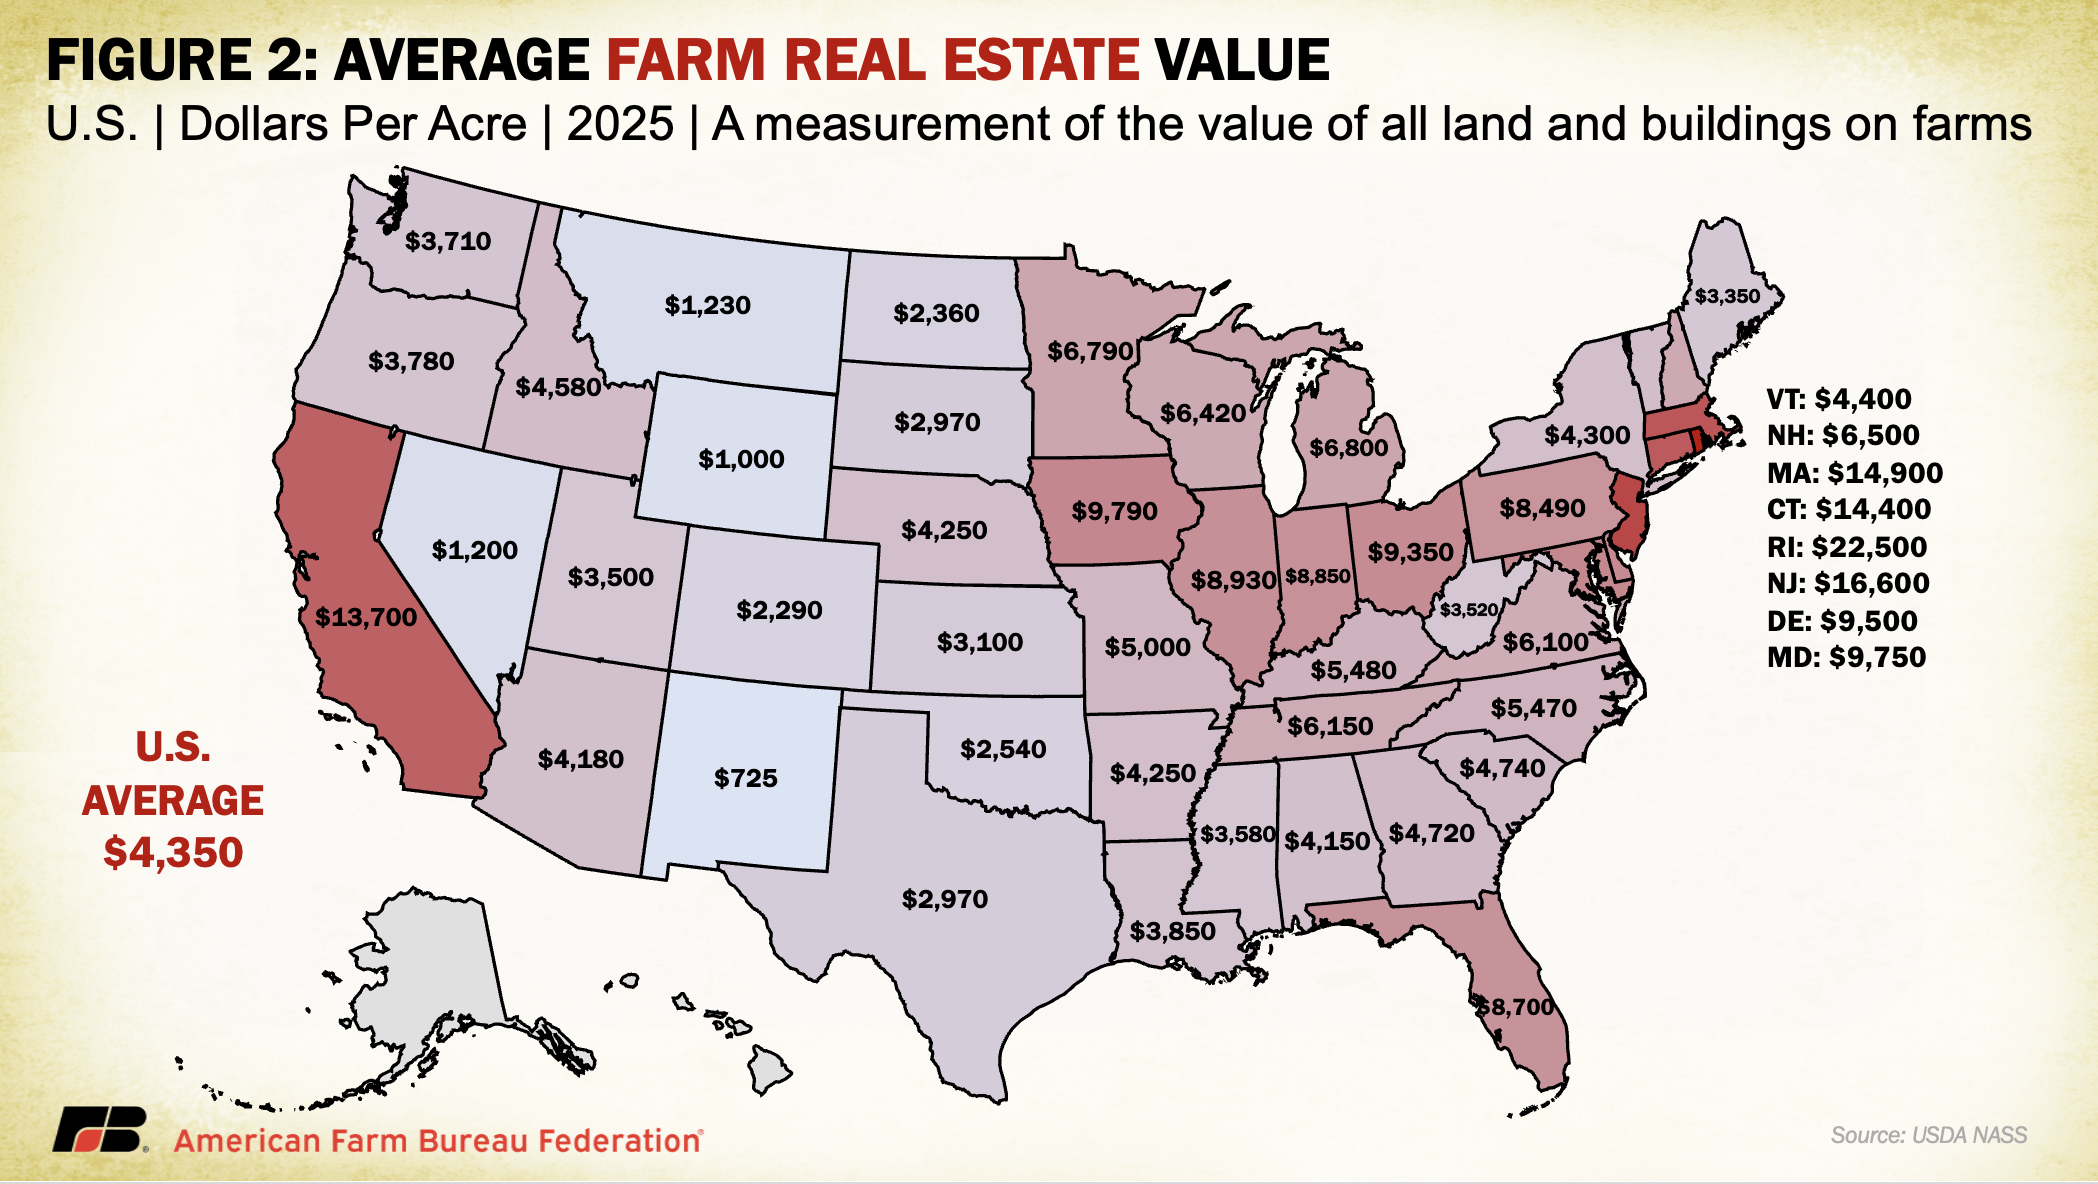
The U.S. average farm real estate value, a measurement that includes the value of all land and buildings on farms, clocked in at a record $4,350 per acre. This marks a $180 per acre, or 4.3%, increase over last year. While still a notable gain, it represents a continued deceleration from the $200 per acre (5%) increase between 2023 and 2024 and the larger $390 per acre (11.7%) surge between 2021 and 2022, which was fueled by record-high commodity prices and strong farm incomes. Though land values are still rising, the slowing pace signals a market cooling from the rapid appreciation seen earlier this decade. This shift carries implications for farm finances: slower equity growth limits producers’ ability to leverage land as collateral for loans, while lenders may grow more cautious if they anticipate stagnation or decline in land markets.
Real estate values remain highly uneven across regions, shaped by both land use pressures and local farm profitability. The highest average values continue to be found in parts of California, where vineyards, orchards and irrigated specialty crops drive intense demand, and in Northeastern states, where farmland competes more directly with residential and commercial development. Urban proximity and non-agricultural land use potential, particularly in areas with limited available land, are major price drivers in these regions. In fact, Rhode Island and Massachusetts recorded the highest average farm real estate values in the country, at $22,500 per acre and $14,900 per acre, respectively.
The Midwest retains some of the country’s most valuable farmland due to its concentration of productive row crops, though price growth in Corn Belt states has moderated following declines in commodity prices and tighter farm margins. Farmland values in the Northern Plains and Mountain West remain among the lowest, reflecting limited cropping returns, low development pressure and a higher share of privately held rangeland with generally less productive soils.
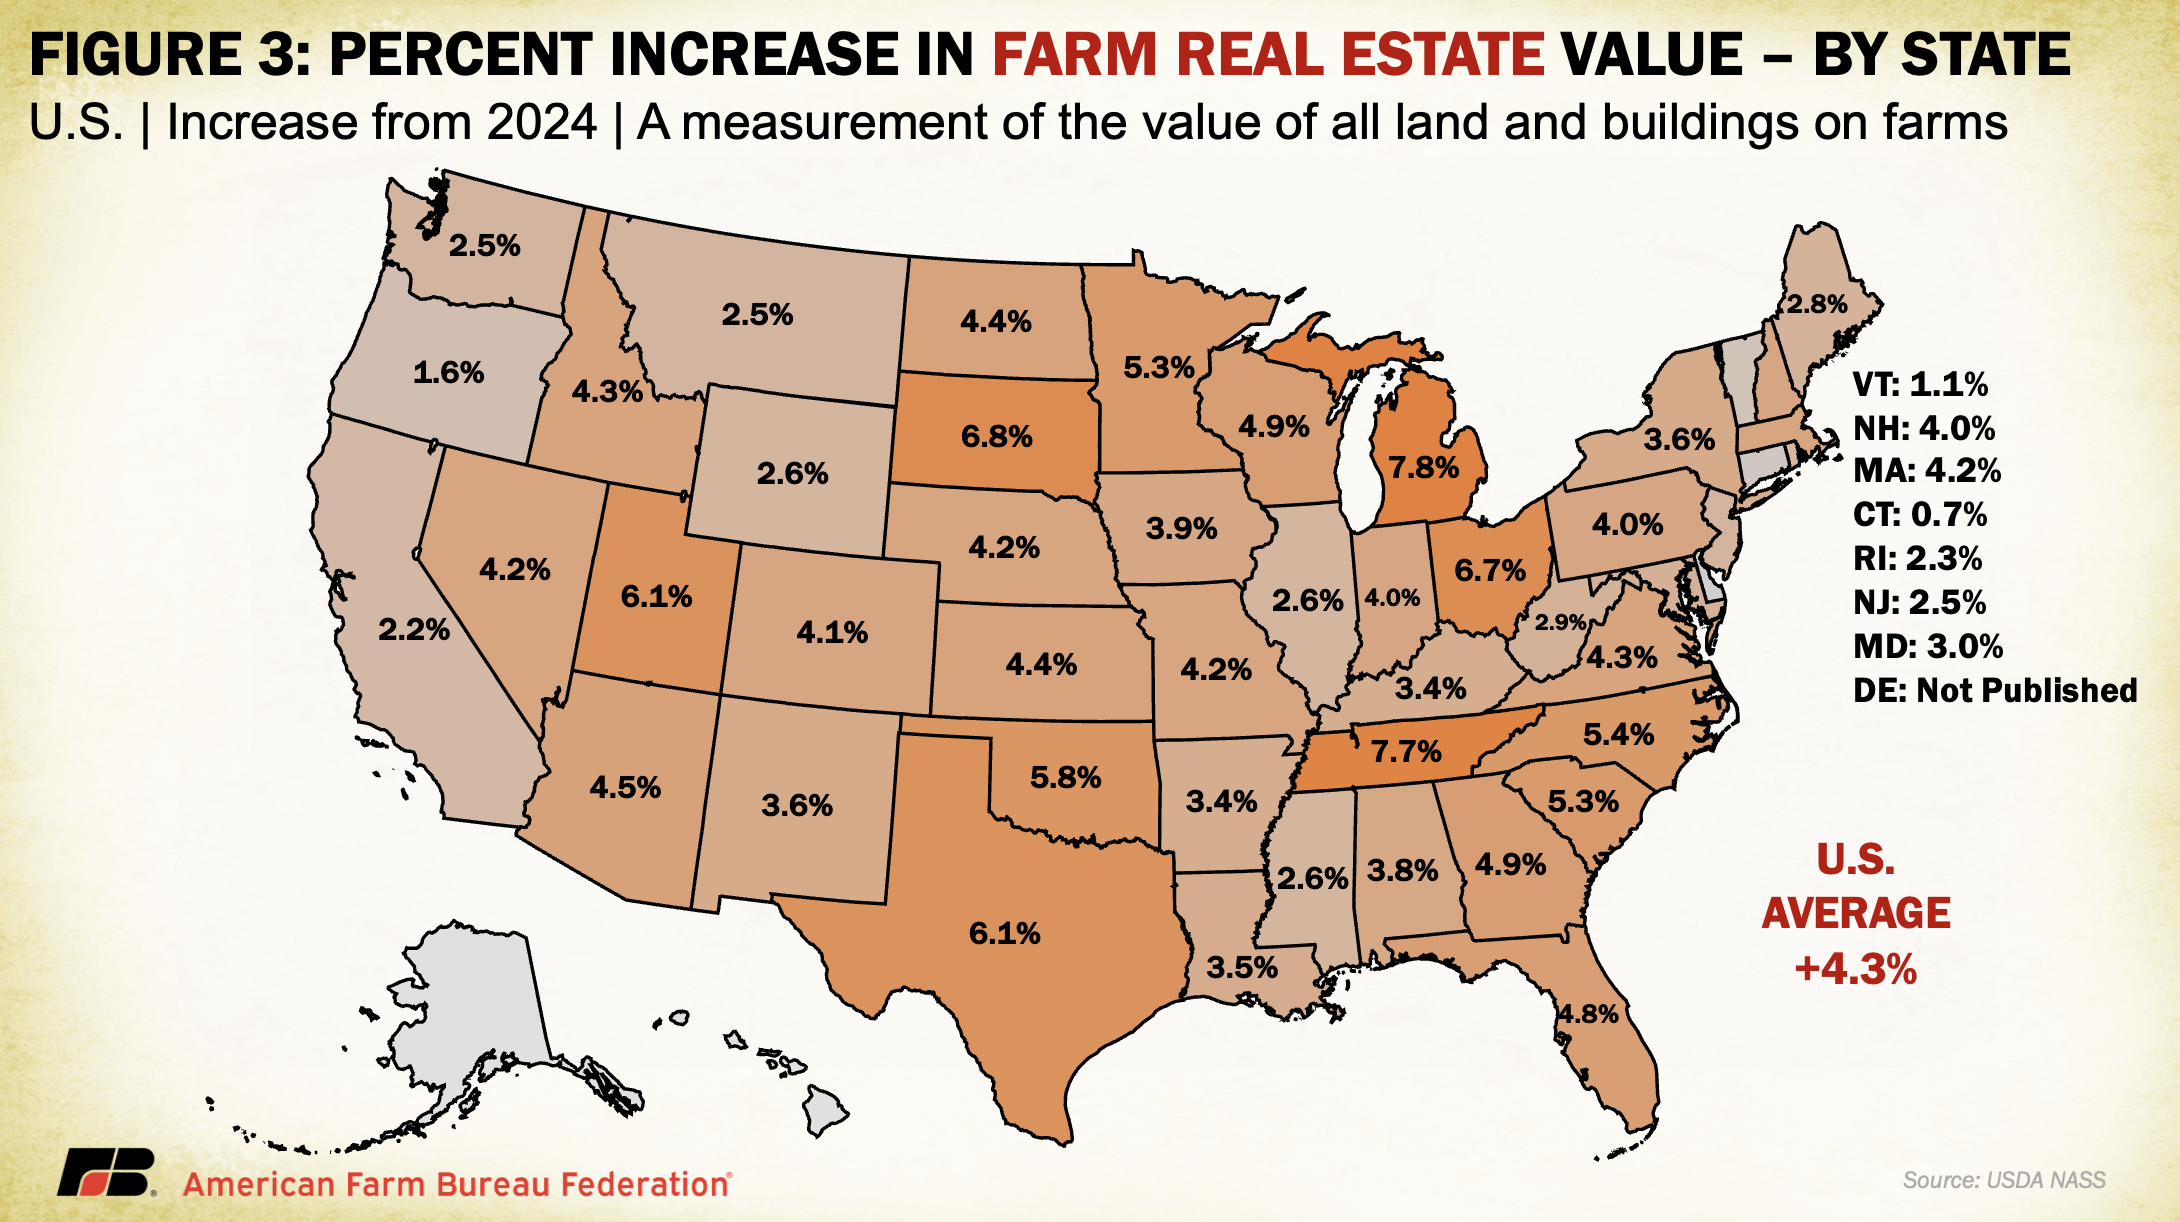
On a state level, Michigan led with a 7.8% increase in farm real estate values, followed by Tennessee (7.7%) and South Dakota (6.8%). These increases may reflect a mix of regional drivers, including specialty crop production, in-migration, and development interest. Unlike in previous years, no state recorded double-digit percentage growth, underscoring the broader slowdown in land value appreciation.
Farm real estate values continue to reflect expectations of long-term income potential. While lingering optimism from strong 2021–2022 commodity prices initially contributed to elevated values in major row crop states, today’s growth may also stem from renewed confidence following recent federal disaster assistance authorized under the 2025 American Relief Act. The legislation provides a combined $30 billion in ad hoc aid, including approximately $21 billion for 2023–2024 natural disaster losses and $10 billion in Emergency Commodity Assistance Program payments tied to 2024 per-acre losses. Though this support is boosting 2025 net farm income forecasts, it is largely compensatory (not reflective of improving market fundamentals), helping to reinforce cropland values in the short term even as commodity prices soften and input costs remain stubbornly high.
Additionally, farm real estate continues to face upward pressure from competing land uses, including solar and energy development, lifestyle-driven demand fueled by expanded telework opportunities and continued interest from investors who view farmland as a stable, inflation-resilient asset class. Programs like the Conservation Reserve Program (CRP), which offer rental payments to landowners who voluntarily set aside acres to fallow, can also contribute to upward pressure on real estate values by tightening the supply of actively farmed acres. The program is intended to preserve highly erodible or environmentally sensitive land, but CRP payments are tied to local soil productivity and average county-level cash rents, so especially in down economies, some productive acres may be converted through CRP, removing farmland acres from use. Since CRP was not extended in the recent One Big Beautiful Bill Act, it would need to be reauthorized through separate legislation to remain in effect. CRP authorization will expire on Sept. 30th without congressional action.
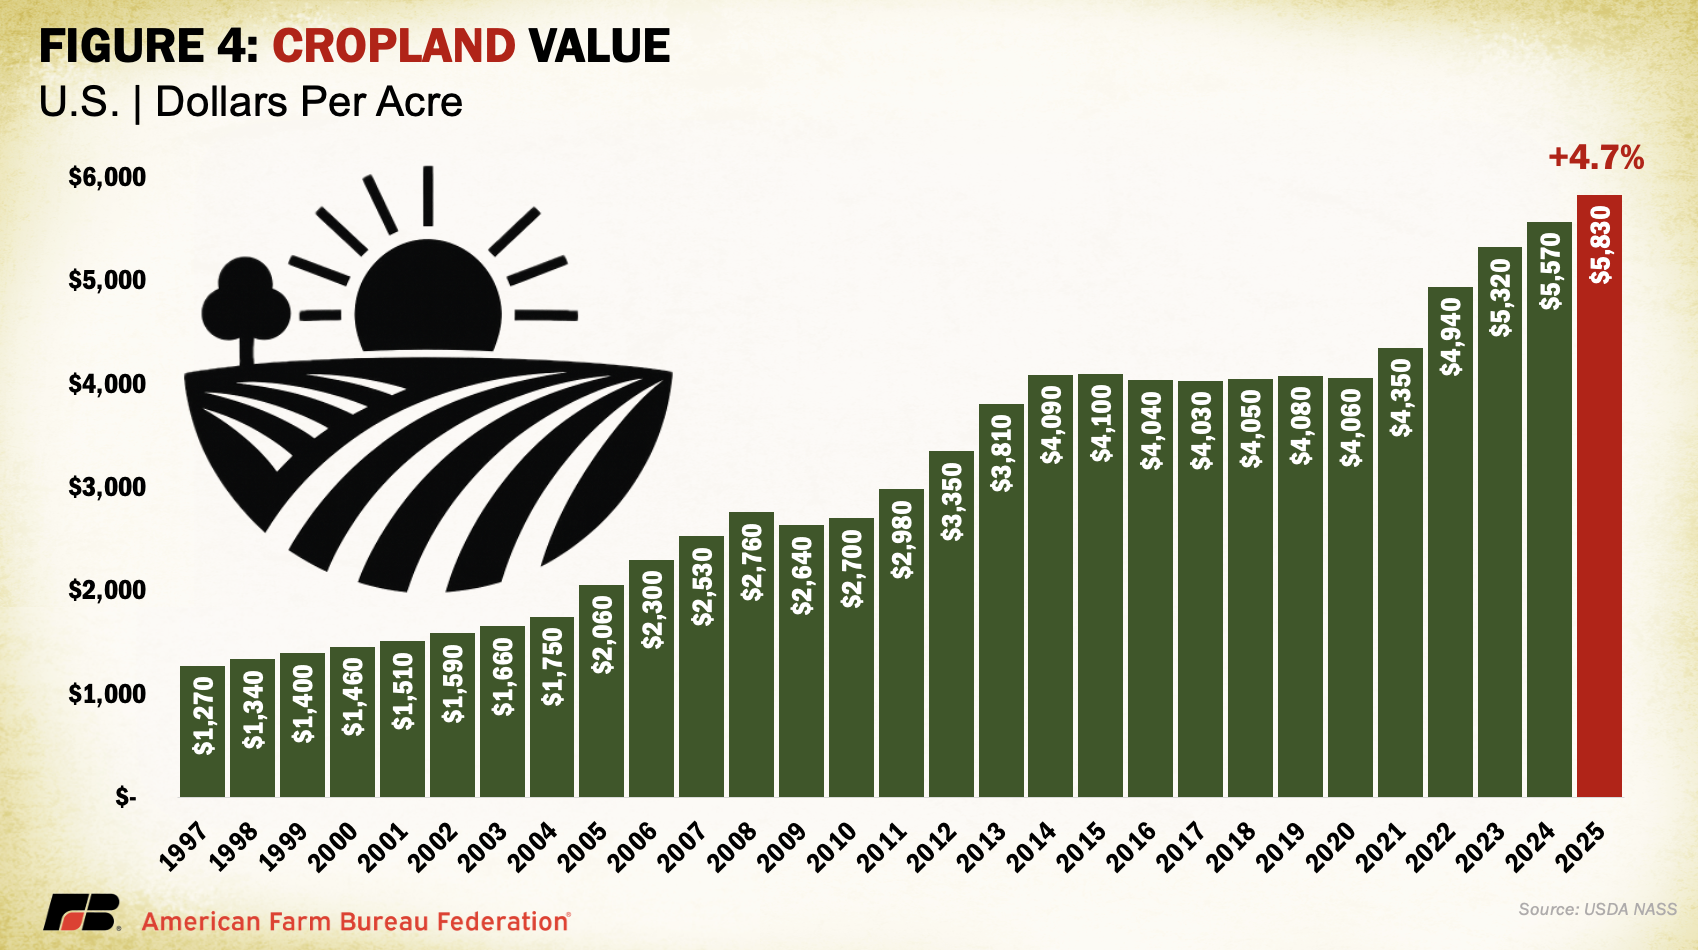
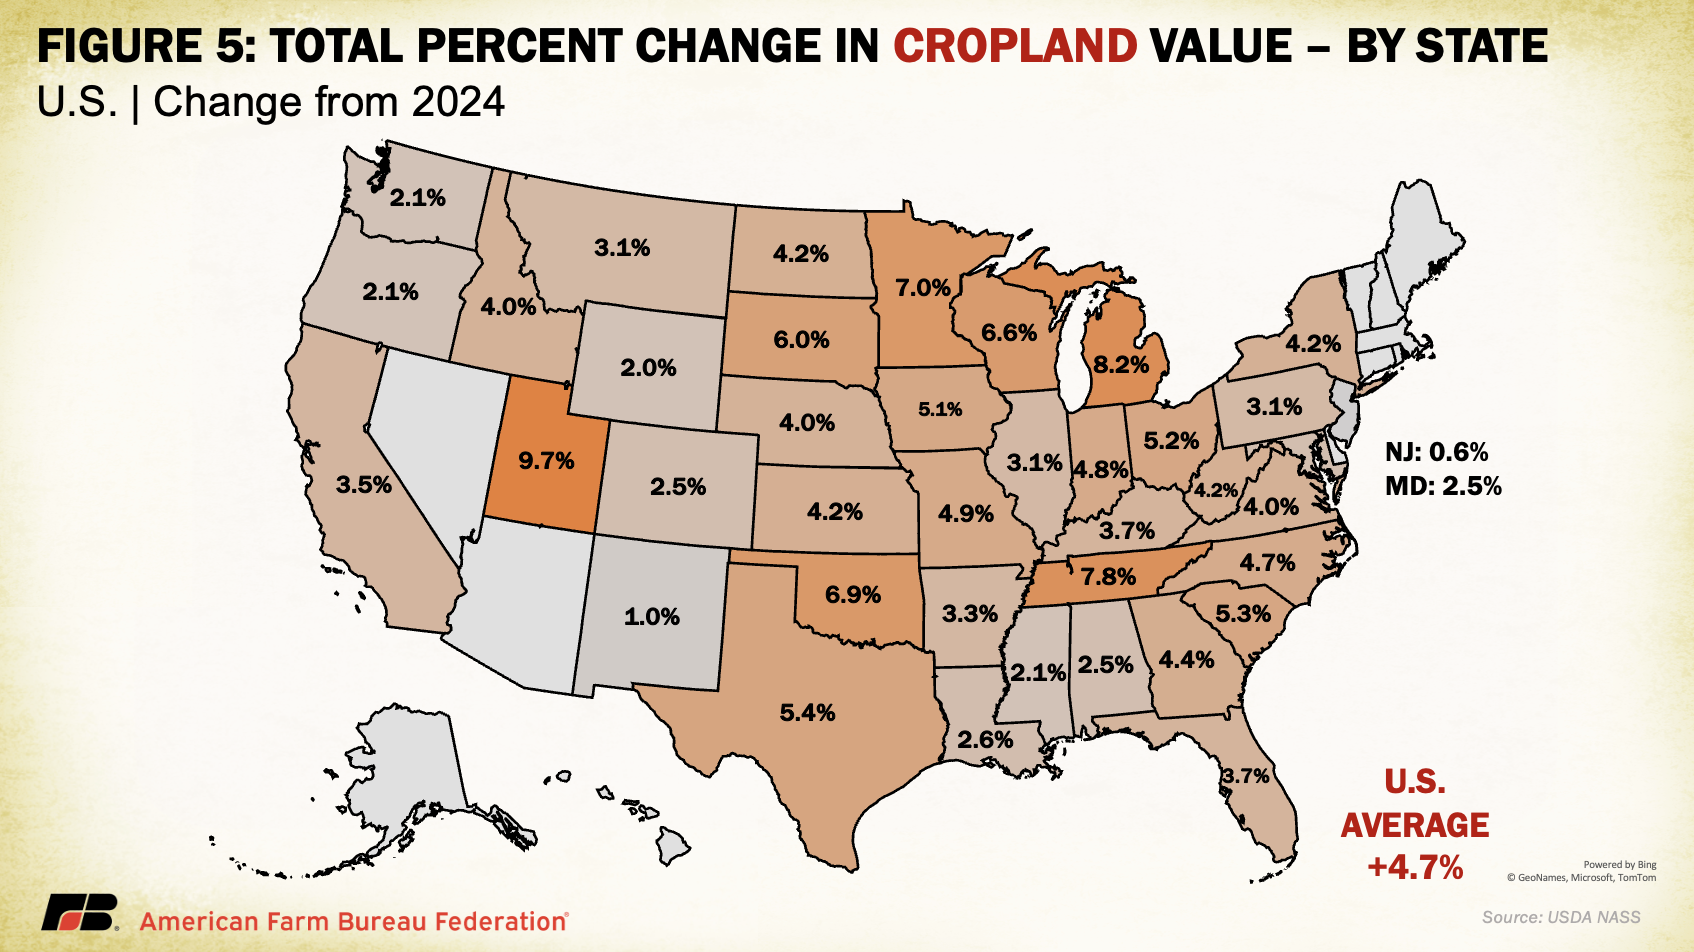
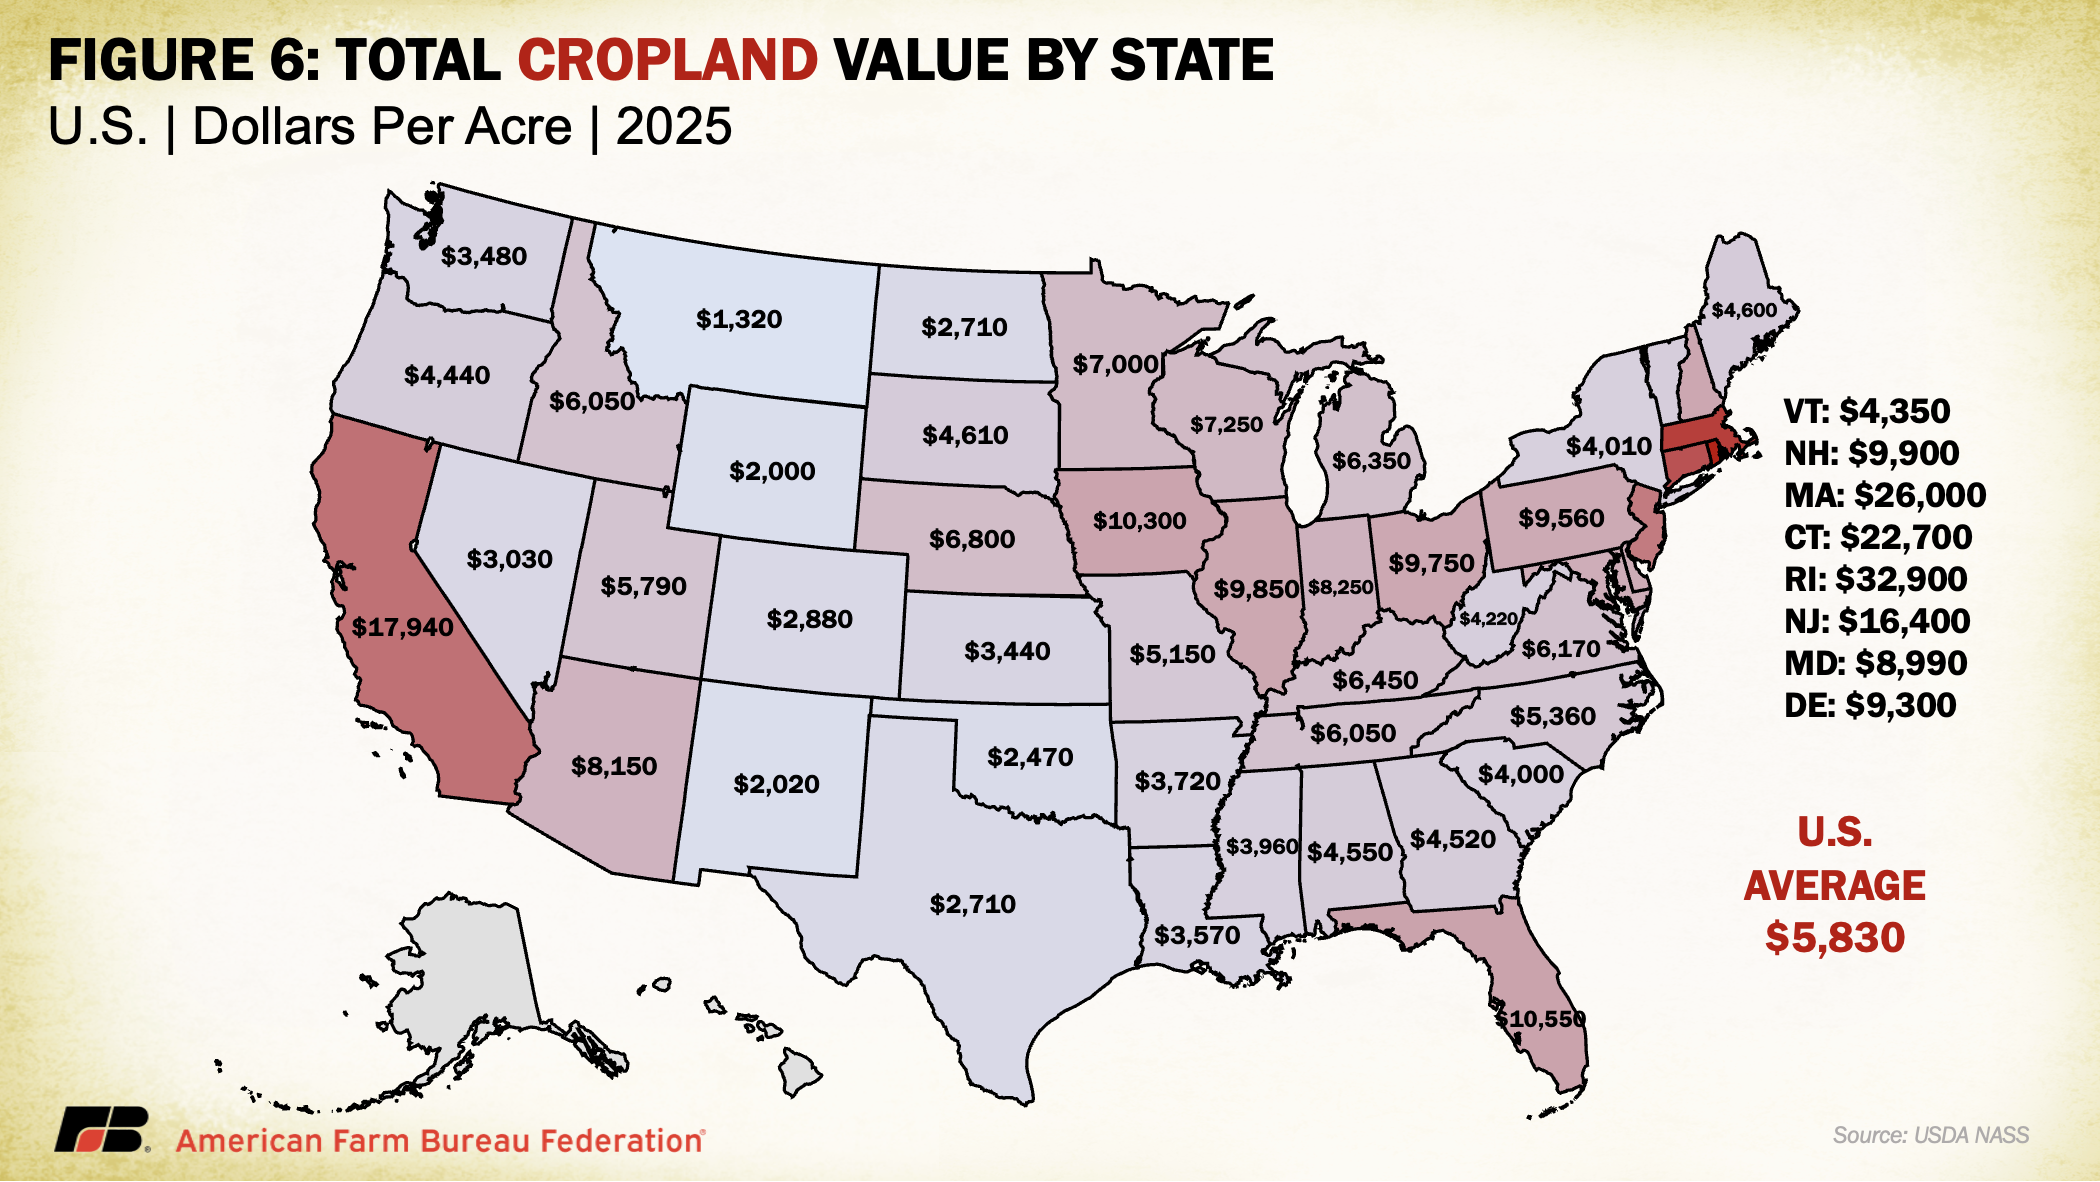
Cropland Value
Like overall farm real estate values, average U.S. cropland values rose to record levels in 2025, reaching $5,830 per acre. This marks a 4.7% increase over 2024, nearly identical to the previous year’s growth but slower than the sharper increases earlier in the decade. In dollar terms, cropland values rose by $260 per acre year over year. Regional patterns remain consistent with broader farmland trends, with California and Northeastern states reporting the highest average cropland values. These are followed by much of the Midwest and Florida, the latter reflecting strong specialty crop production and ongoing residential development pressures. The top three states in percentage growth were Utah (9.7%), Michigan (8.2%) and Tennessee (7.8%). Notably, no states recorded a decline in cropland values.
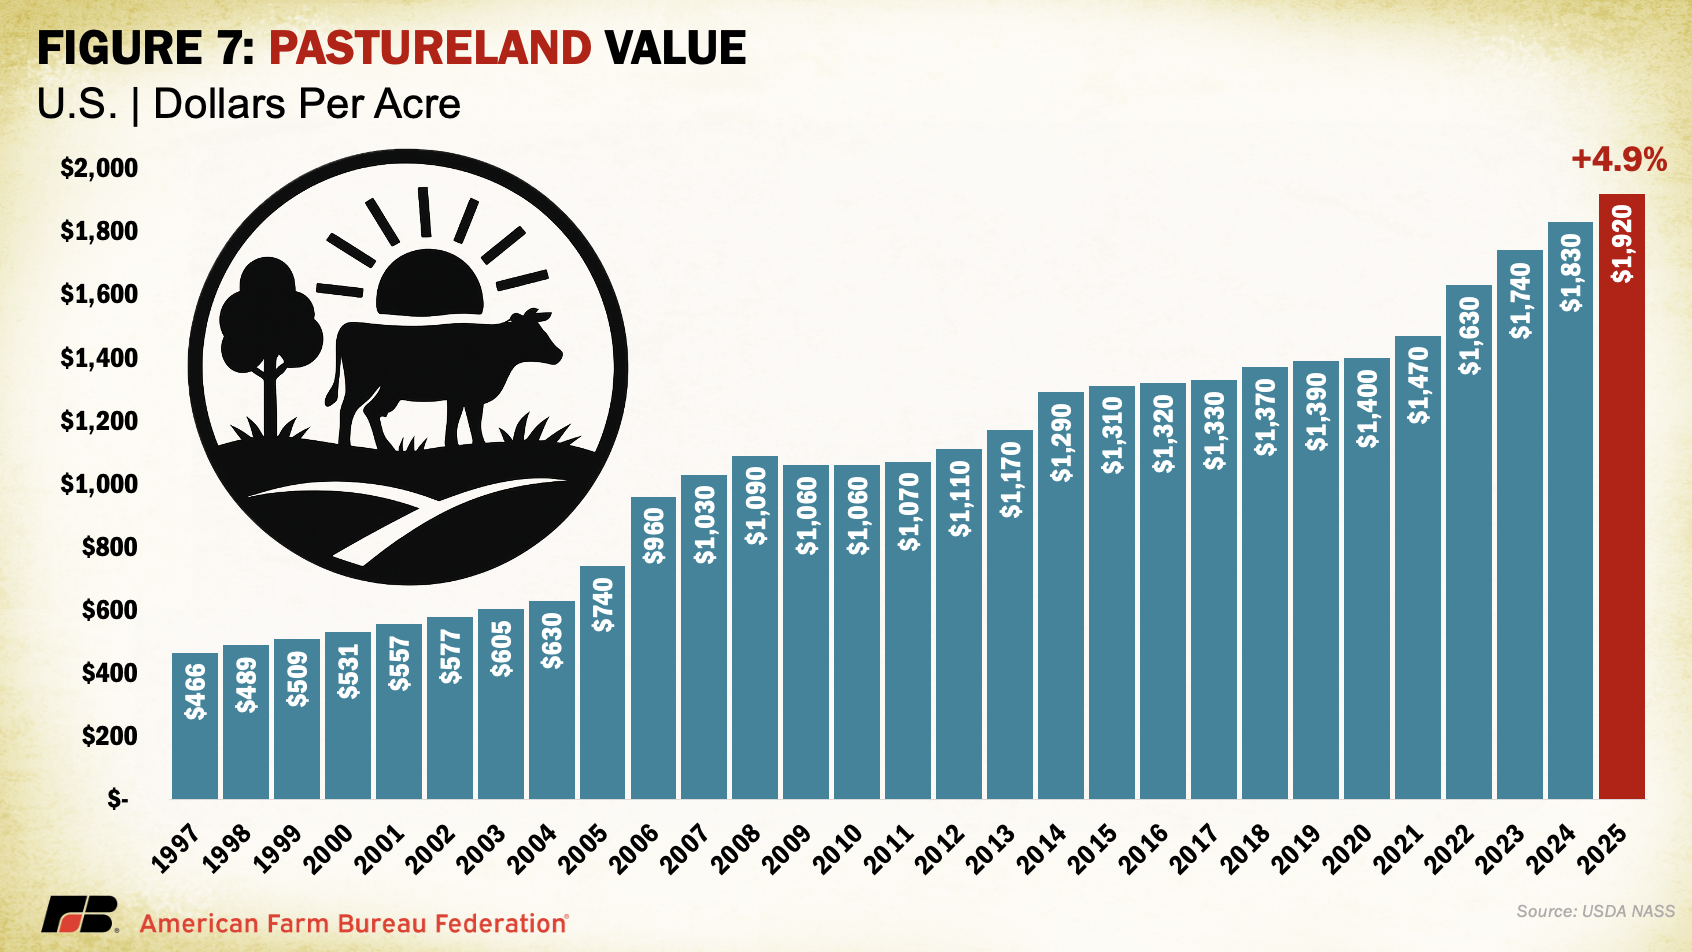
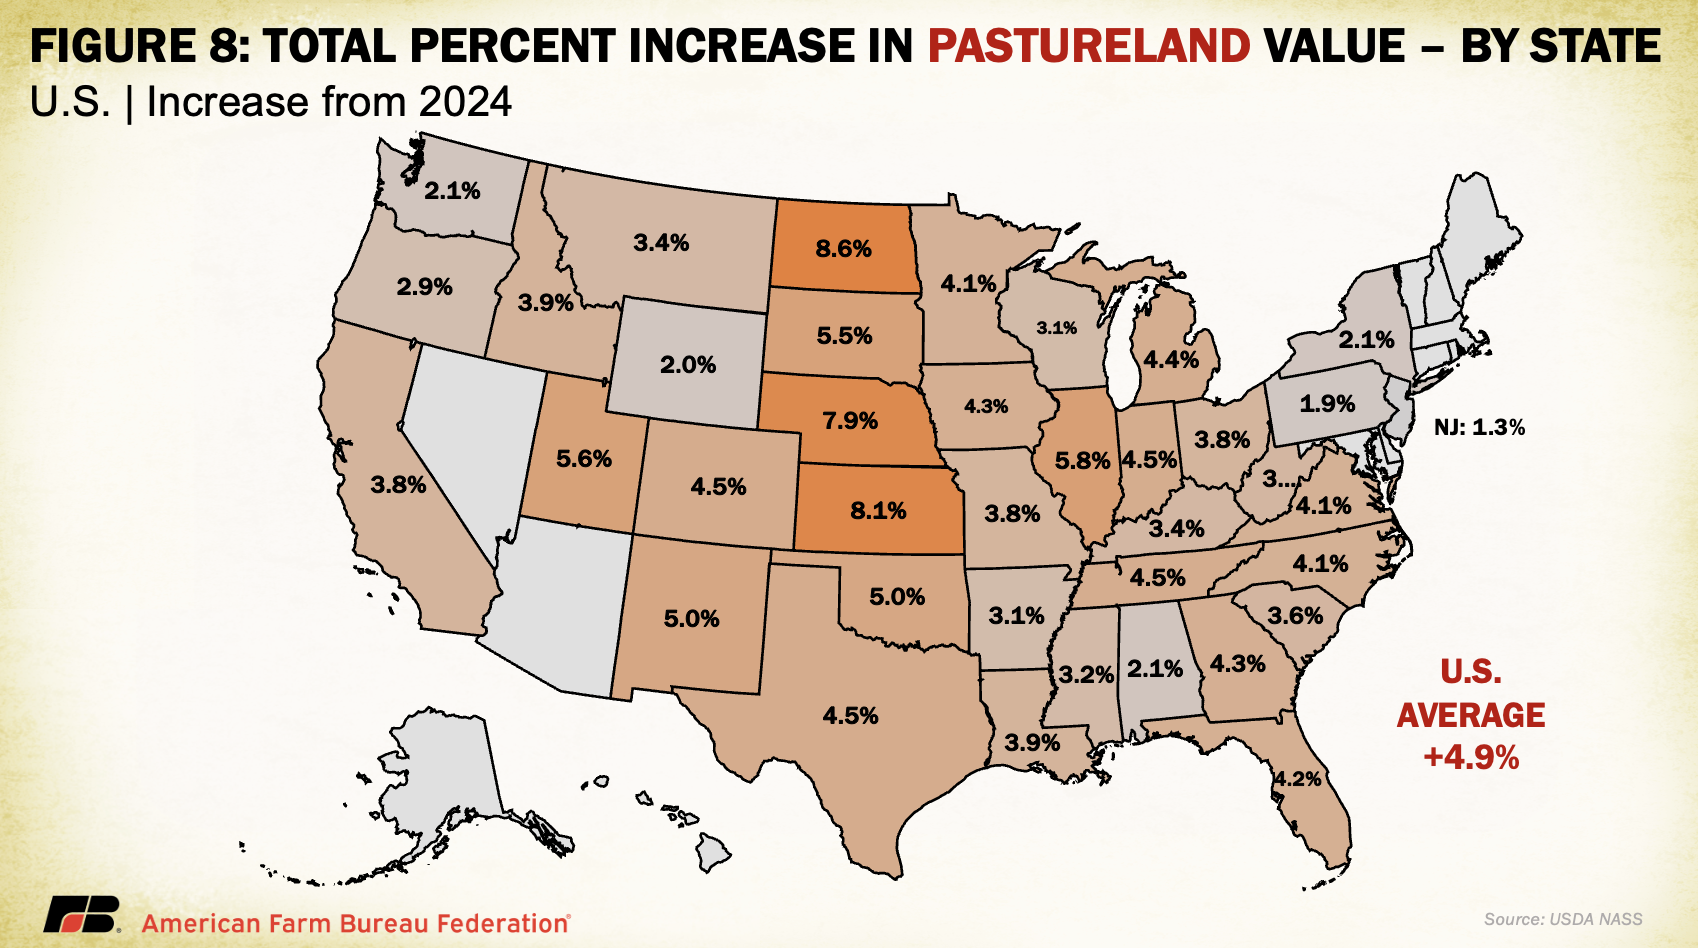
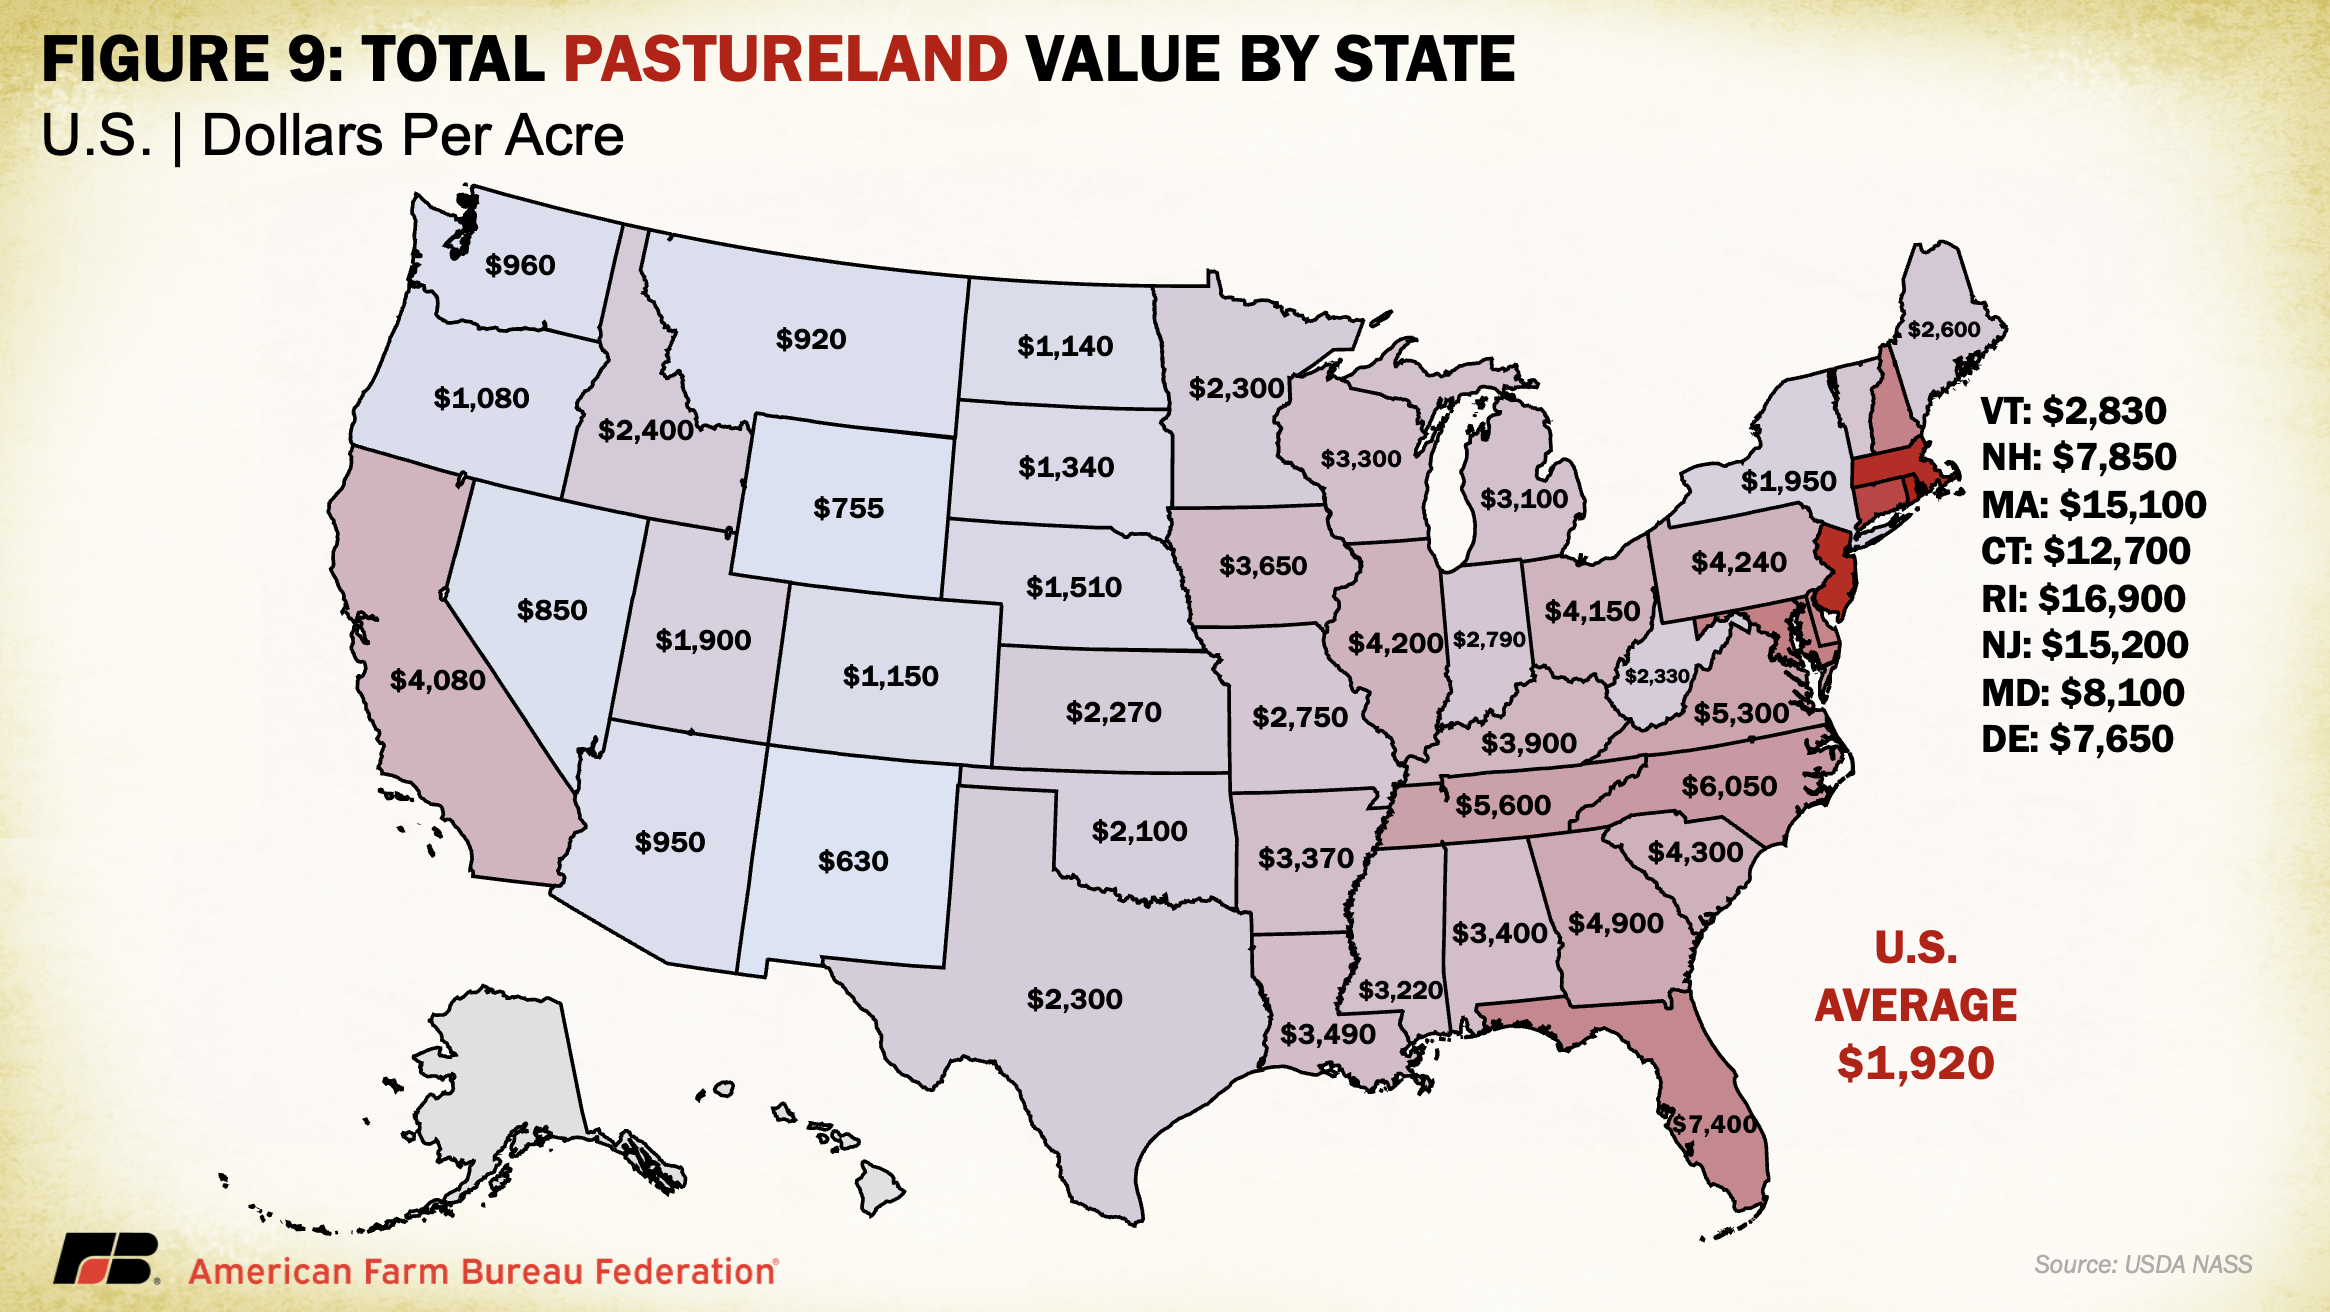
Pastureland Value
U.S. pastureland values continued their upward trend in 2025, rising to $1,920 per acre, a 5% increase over 2024. This growth is nearly in line with last year’s 5.2% gain but remains below the 6.7% increase in 2023 and the sharp 11% jump in 2022, which followed nearly a decade of stagnant values.
Unlike cropland and overall farm real estate, pastureland values are highest along the East Coast and mid-South, where development pressures, land scarcity and lifestyle demand contribute to elevated prices. In contrast, Western and Plains states report lower average values, partly due to lower land productivity and the prevalence of federally owned grazeable land accessed through grazing permits, which reduces market-based competition. In densely populated Eastern states, fragmentation of land and rising competition for open space (whether for grazing, recreation or rural living) continue to drive up per-acre costs for the limited private pastureland available.
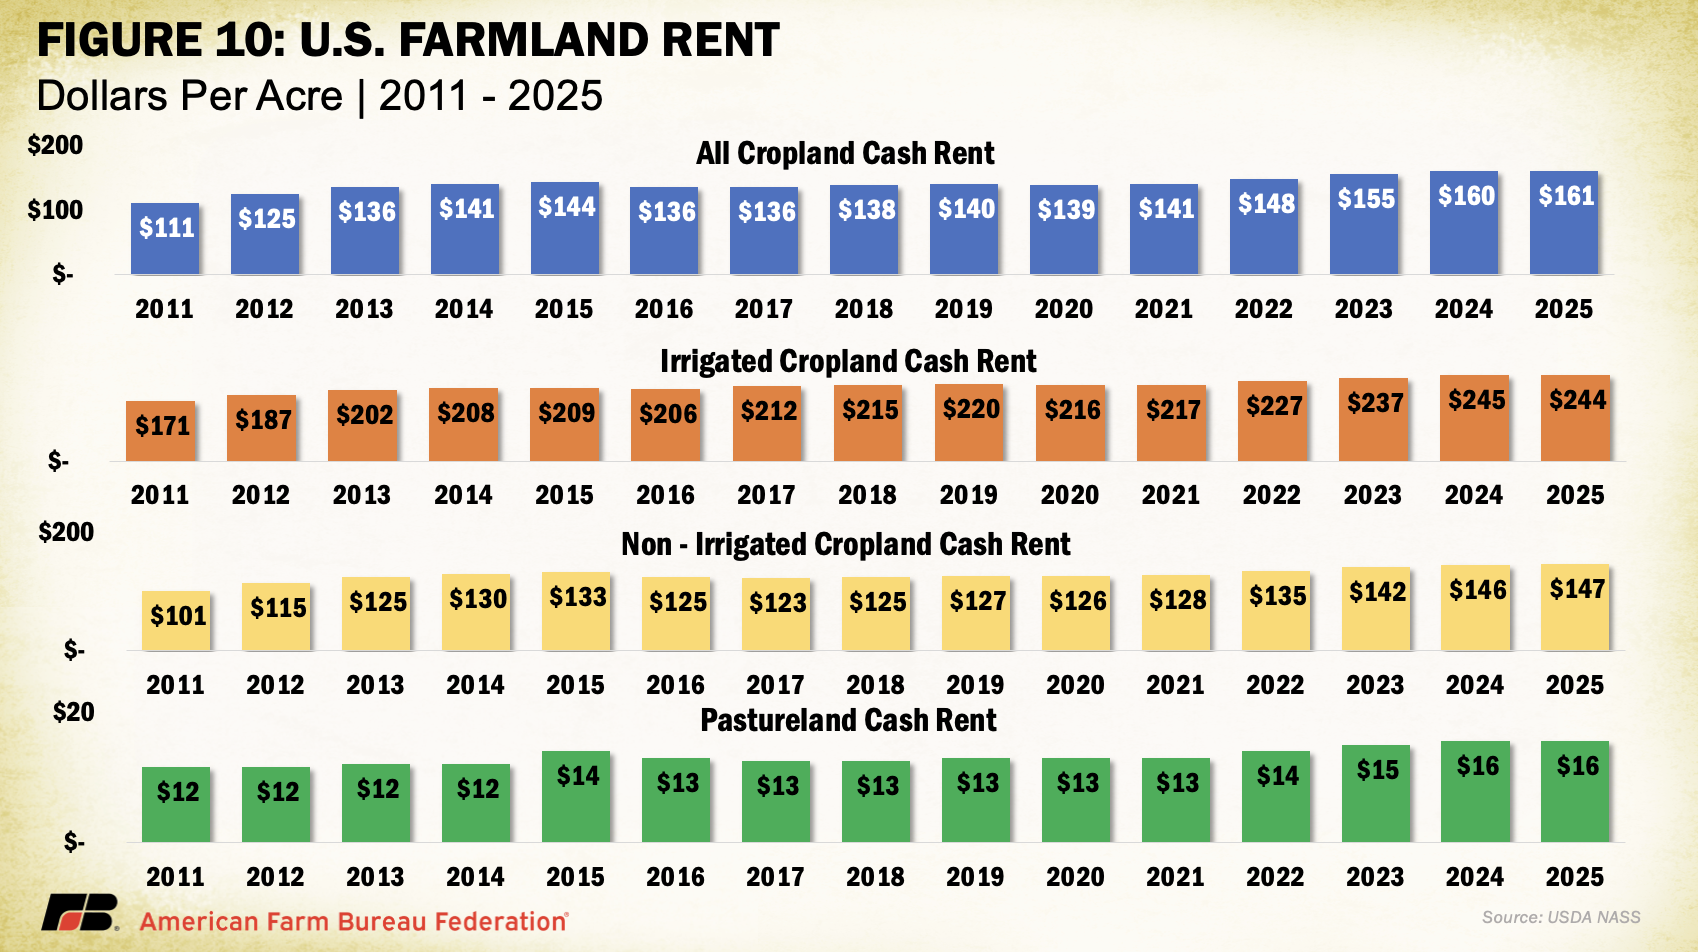
Cash Rent
NASS also released data on cash rents, which tend to lag changes in land values and commodity prices due to early-season lease negotiations. While the reported figures reflect past agreements, they often serve as important benchmarks for future producer-landlord negotiations, especially in areas with variable rent structures. Average U.S. cropland rent increased to $161 per acre in 2025, a modest 0.6% rise over 2024 — just $1 per acre. Irrigated cropland rents declined by 0.4% to $244 per acre, while non-irrigated rents rose 0.7% to $147 per acre. Pastureland cash rents remained unchanged at $15.50 per acre.
Despite minimal national movement, pressures on open land for solar development, suburban expansion and recreation continue to support rental rate growth in select areas, particularly where demand for working land is layered with lifestyle or energy investment interest. Increased telework continues to pull buyers and lessees into rural areas, intensifying local competition for land in certain high-amenity or fast-growing regions.
While earlier rent increases were tied closely to the 2021–2022 commodity price boom, today’s changes are more uneven, shaped by regional water constraints and shifting cropping patterns. In some areas, recent federal disaster assistance may have tempered pressure to renegotiate downward, even as commodity prices weaken and input costs remain high.
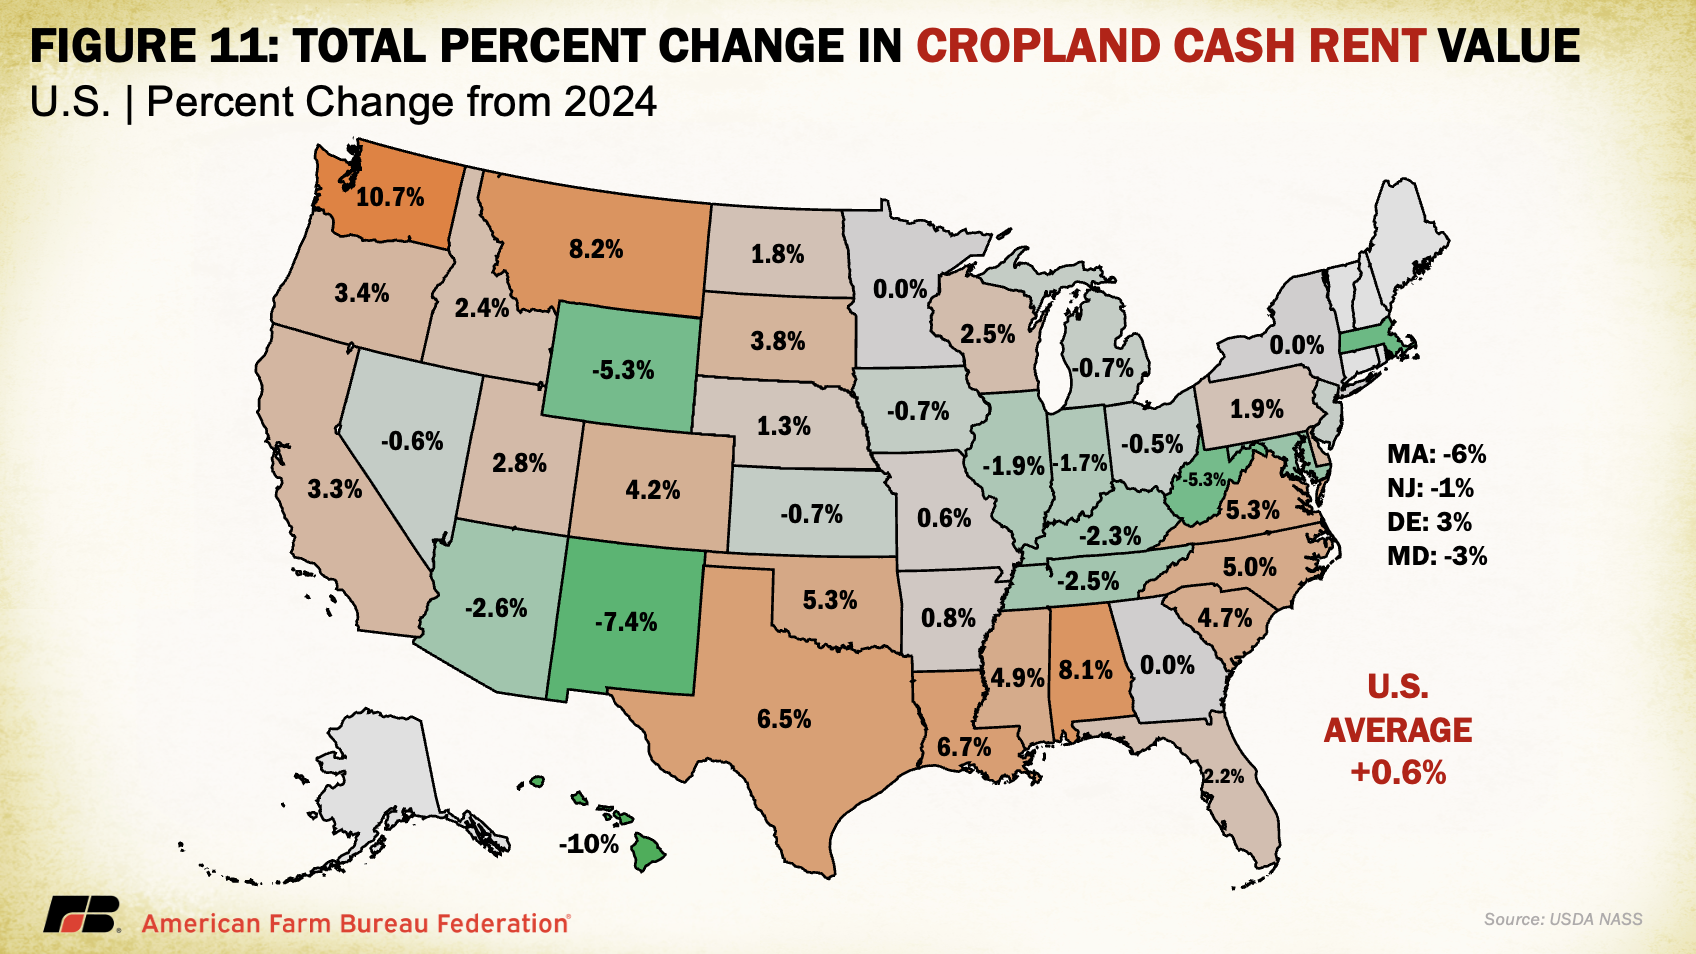
Washington and Montana led the country in cropland cash rent growth, up 10.7% and 8.2%, respectively, followed by Alabama at 8.1%. Meanwhile, cropland rents in Hawaii, New Mexico, Wyoming, West Virginia and Massachusetts declined by more than 5%, likely due to a mix of stabilized drought conditions, changing land use priorities and rebalancing after years of sharp growth.
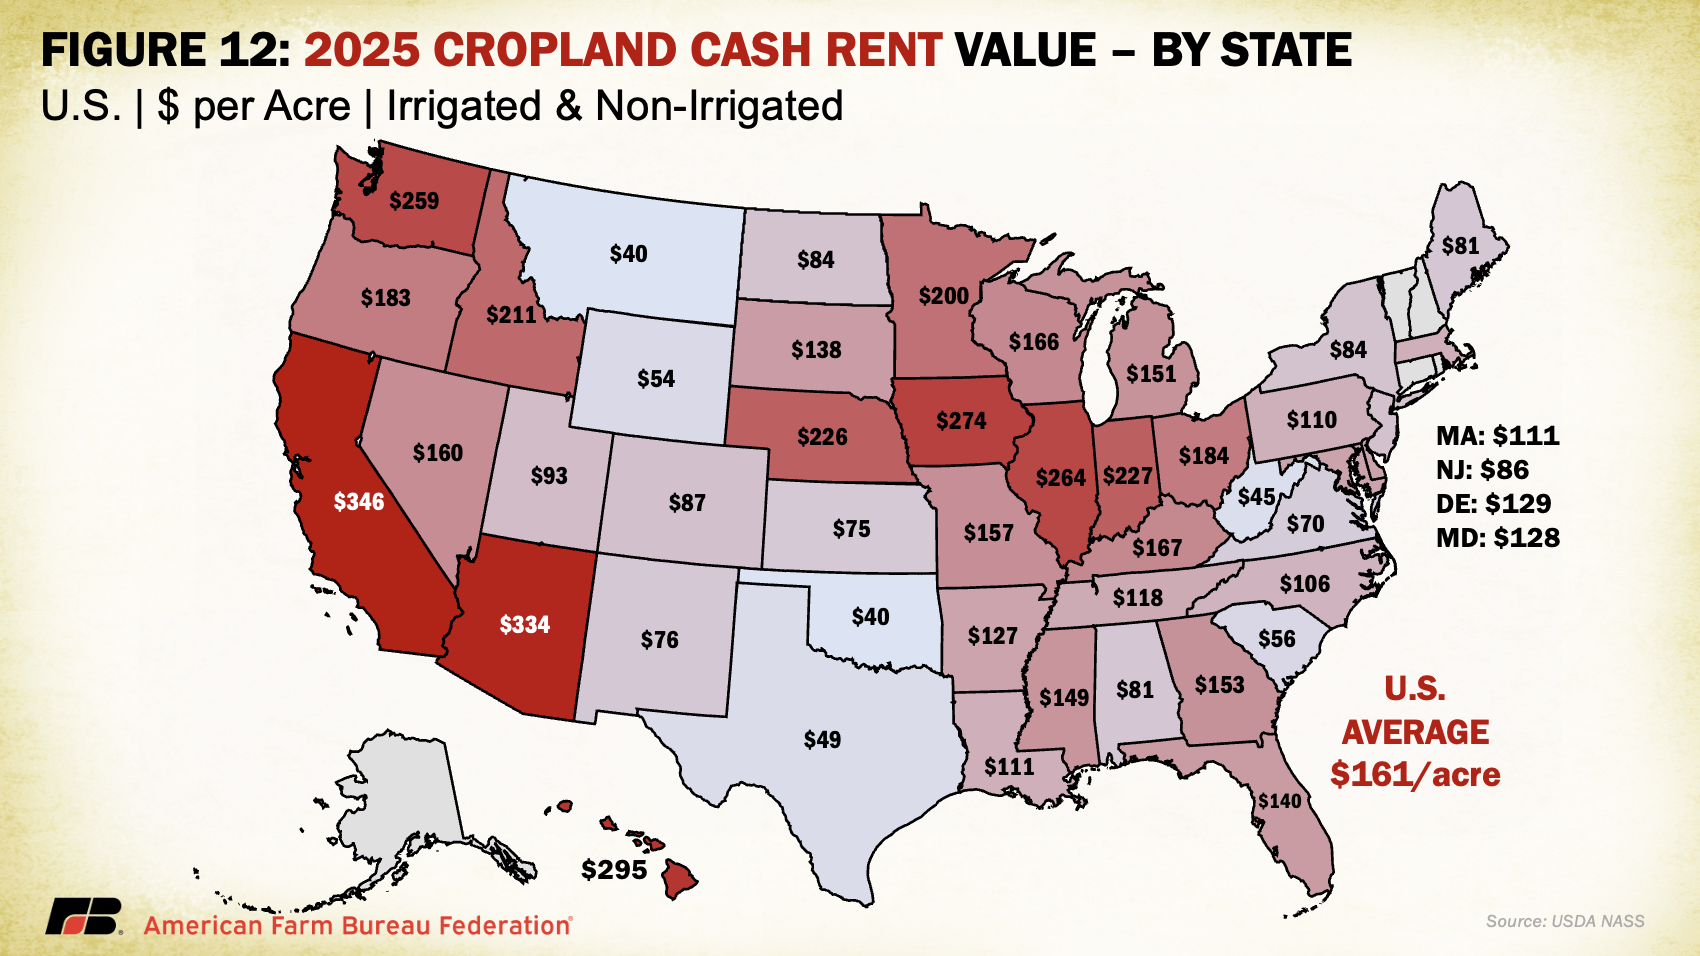
By value, the most expensive cropland rents remain in states with high-value specialty crops, such as California ($346/acre), Arizona ($334/acre) and Hawaii ($295/acre), often driven by contracts tied to irrigation infrastructure and water rights. Iowa, Illinois, Indiana and Washington round out the next tier of high-rent states, reflecting both row crop concentration and specialty crop presence. Water access and cost continue to be major drivers of both land value and rental rates across the Western U.S.
Margins for producers who rely heavily on rented land remain precarious, especially as revenue potentially slips while fixed costs (including rents) remain elevated or inflexible. Beginning farmers and those without land equity are especially exposed, facing steep barriers to accessing operating credit. In a year where net farm income is forecasted to decline without ad hoc support, even modest increases in rental rates can have outsized financial consequences.
Conclusion
The 2025 USDA land values report confirms continued growth in farmland values and cash rents, though at a slower pace than previous years. Average U.S. farm real estate rose by $180 per acre (4.3%), with cropland and pastureland values also posting record highs. Cash rents had minimal changes, reflecting a market beginning to cool.
Yet, these gains come amid softening commodity prices and tight margins. Much of the current support stems from ad-hoc federal disaster and economic aid, not stronger market fundamentals. Development pressure, investor demand and rural demographic trends are also driving localized land competition.
Renters and beginning farmers remain especially exposed, facing high costs with limited equity. As USDA prepares to release updated income forecasts on Sept. 3, this data underscores a key tension: land values remain strong, but long-term farm profitability is increasingly reliant on policy, not price.
Top Issues
VIEW ALL