WASDE: Ample Supplies Keep Crop Prices Low

photo credit: Kansas Farm Bureau, Used with Permission
Faith Parum, Ph.D.
Economist
USDA’s just-released July World Agricultural Supply and Demand Estimates (WASDE) report incorporates updated planted and harvested acreage figures from the June 30 Acreage report. This Market Intel analyzes both the June Acreage and July WASDE reports and explains what the updates mean for U.S. agriculture.
June Acreage Report
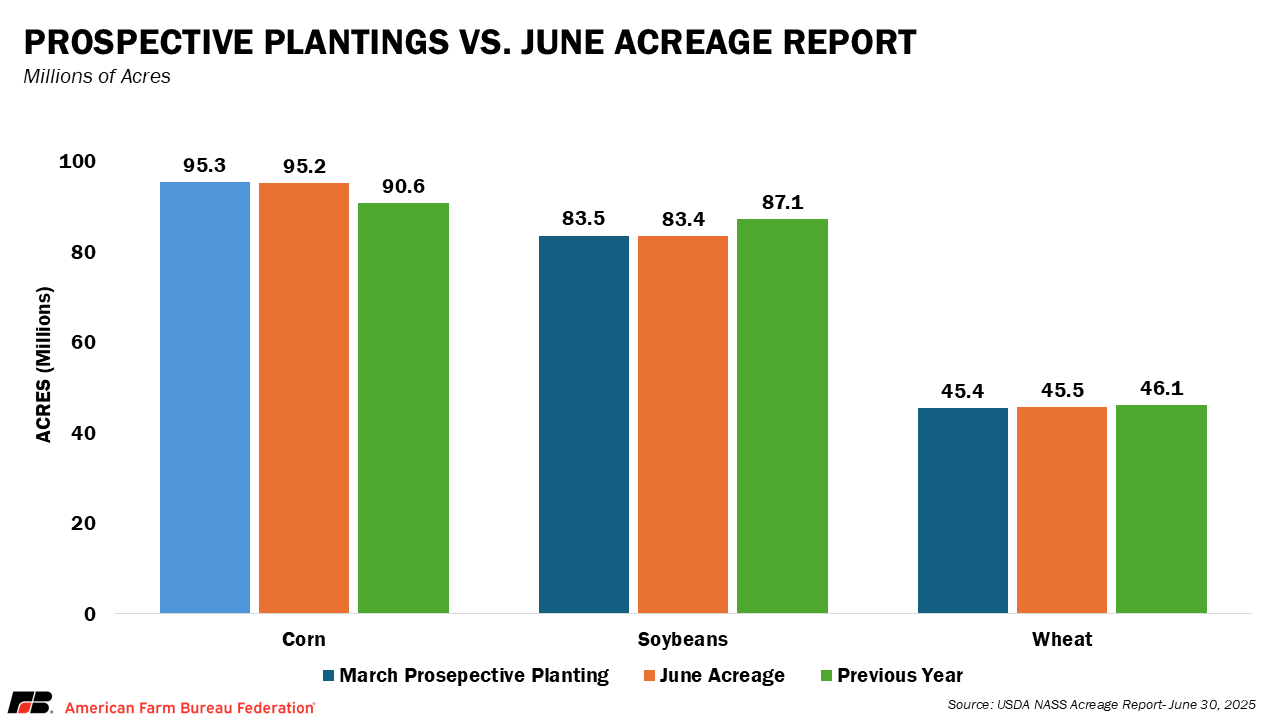
The June 30 USDA Acreage Report showed little to no change from the March 2025 Prospective Planting report and will provide a more accurate baseline for yield and production forecasts in the July WASDE.
Corn
USDA slightly decreased planted corn acreage to 95.2 million acres in the June Acreage report, a revision of less than 1%. from the 95.3 million acres reported in the March Prospective Plantings report. This small decrease is likely due to increased rainfall in the eastern corn belt. Despite the downward adjustment, this marks a record-high year for corn acreage. In comparison, farmers planted 90.6 million acres in 2024/2025, making this year’s estimate 5% higher.
Soybeans
USDA also made a minor adjustment to soybean acreage, lowering it to 83.4 million acres in June from 83.5 million acres in the Prospective Plantings report, again, a change of less than 1%. However, overall soybean plantings are down compared to last year. Farmers planted 87.1 million acres in 2024/2025, making this year’s total 4% lower.
Wheat
Wheat acreage was revised slightly downward, to 45.4 million acres in the June Acreage report from 45.5 million acres in the March report. While the change is minimal, total wheat plantings are still lower year-over-year, down 1% from 2024/2025.
July WASDE Report
Corn
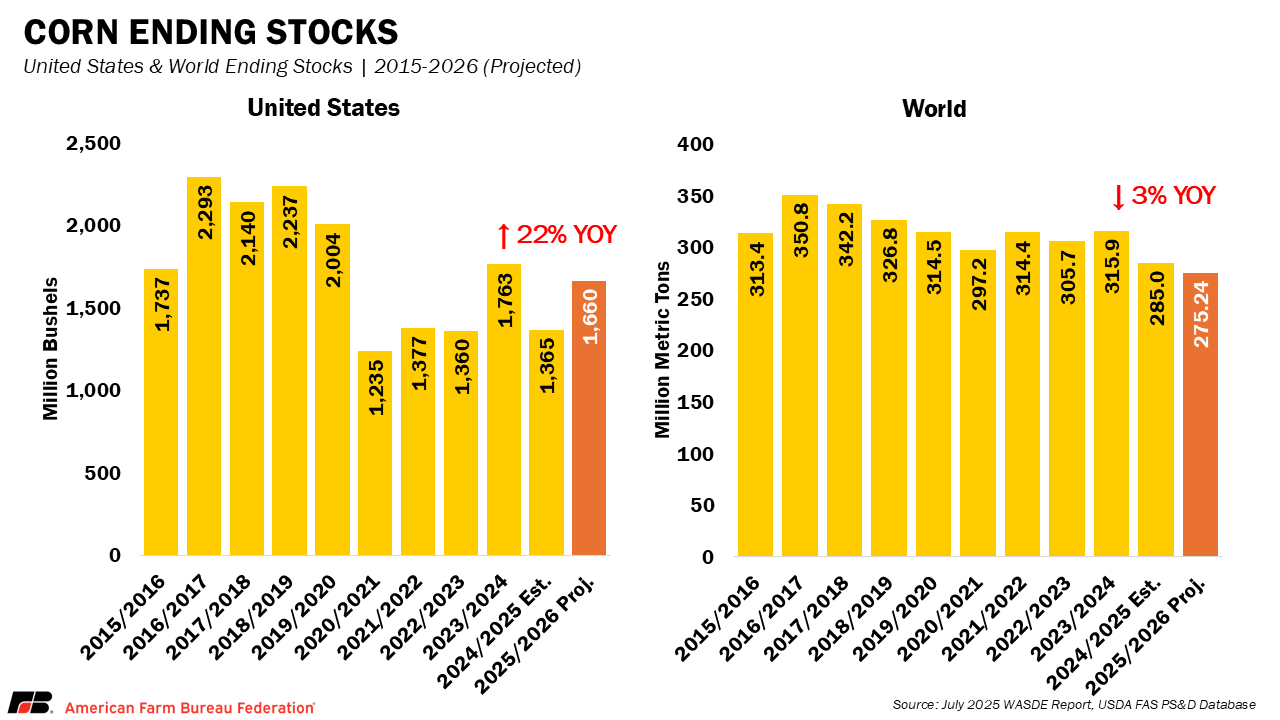
USDA’s July WASDE leaves yield estimates unchanged in the United States but decreases area planted to the 95.2 million acres reported in the June Acreage report (likely due to increased rainfall in certain areas). Based on these revisions, production was updated to 15.7 billion bushels.
Ending stocks for 2025/2026 are now projected at 1.66 billion bushels, lowered from 1.75 billion acres in the June WASDE. This is still above the 2024/2025 ending stocks estimate of 1.34 billion bushels. Also, USDA raised old-crop corn exports by 100 million bushels (now at 2.8 billion bushels), lowering beginning stocks to 1.34 billion bushels. The season-average farm price for corn was adjusted to $4.20 per bushel, unchanged from month’s report and down from $4.30 per bushel for the previous marketing year. Additionally, corn exports are projected to be lower than 2024/2025 with estimates at 2.675 billion bushels. With ample supplies and increased global competition, corn farmers will likely continue to face price pressure this season.
Soybeans
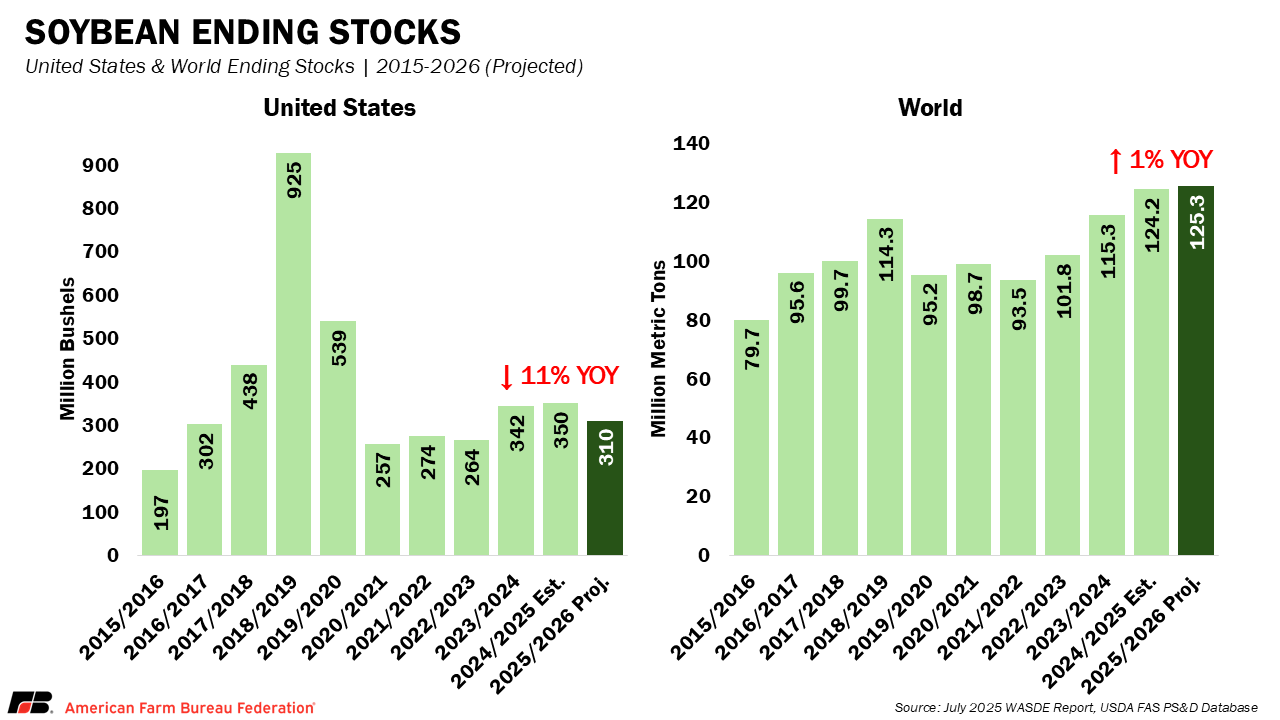
The July WASDE report forecast a yield of 52.5 bushels per acre, unchanged from the June WASDE. Total production is now estimated at 4.34 billion bushels. USDA's June Acreage report pegged planted soybean area at 83.4 million acres, slightly lower than earlier projections, but still enough to support a solid supply outlook.
Ending stocks for 2025/2026 are projected at 310 million bushels, compared to 295 million bushels in June and 350 million bushels in 2024/2025. The average farm price for soybeans is now projected at $10.10 per bushel, compared to $10.25 per bushel in the previous WASDE estimate and $10.00 per bushel last year. Additionally, soybean exports are projected to be lower than 2024/2025 with estimates at 1.745 billion bushels.
USDA raised the 2025/26 soybean crush forecast to 2.54 billion, driven by stronger demand for soybean oil for biofuel, supported by EPA’s proposed RFS rule, limits on imported RINs, and incentives like the 45Z tax credit. Soybean oil use for biofuel is projected at 15.5 billion pounds boosting.
Additionally, USDA lowered its estimate for 2025/26 U.S. soybean exports to 1.745 billion bushels, down from 1.815 million bushels in the June report. The revision reflects increased global competition, as well as slower-than-expected demand from key importers like China. This reduced export outlook contributed to higher projected ending stocks and may weigh on prices in the months ahead.
Wheat
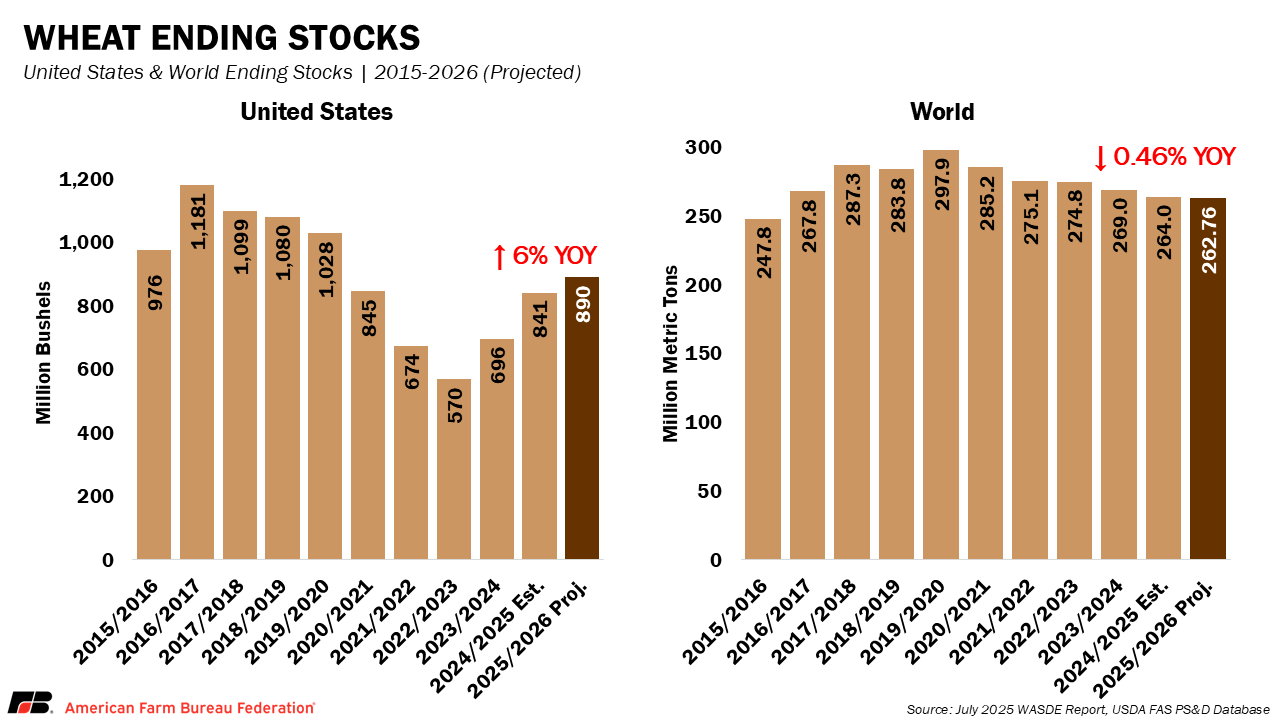
Wheat’s national average yield was revised to 52.6 bushels per acre, compared to 51.6 bushels per acre in the prior WASDE report. As a result, USDA now forecasts total wheat production at 1.9 billion bushels.
Ending stocks for 2025/2026 are forecast at 890 million bushels, a change from 898 million bushels in June. For context, ending stocks in 2024/2025 were 851 million bushels.
The season average farm price for all wheat is now $5.40 per bushel, unchanged from last month and lower than the $5.52 per bushel the prior marketing year. Wheat farmers will continue to face low prices despite an improved crop.
Conclusion
The July WASDE provides a clearer picture of the 2025/2026 crop year, updating yield, stock, and price projections based on finalized acreage. While planted area held steady, changes to yields and ending stocks will shape market expectations heading into harvest. Farmers will still face headwinds on their balance sheets this year, based on the latest updates from USDA. To support long-term stability, producers also need strong trade agreements and greater certainty in global markets, especially as USDA projects lower corn and soybean exports compared to the last several years. Additional investments in the farm safety net under the One Big Beautiful Bill Act (OBBBA), signed into law on July 4, aim to strengthen producer support amid continued market uncertainty. These updates, combined with the announcement of disaster assistance for 2023 and 2024 losses, reflect a broader push to stabilize the agricultural economy.
Top Issues
VIEW ALL