Consumers are Trying
Bob Young
President

photo credit: Donnie Ray Jones, Used with Permission
Bob Young
President
The advance estimates of retail and food service sales for June show consumers are trying to do their part to sustain the economy. Overall, sales were up 7.5% from May levels and, surprisingly, up 1.1% from the same time last year.
Motor vehicles were one of the significant drivers for last month's gains. Recall the May 2020 sales figures were up 49% over April 2020 figures. Any number of reasons likely drove that jump, including pent-up demand coming out, good deals and low-interest rates. June sales rose an additional 8% from the increase posted in May. In addition, motor vehicle sales are up 7.5% over year-earlier levels. To give some idea of the scale of this increase, spending at auto and other motor vehicle dealers fell to $69.9 billion in April, rose to $108.4 billion in May, and was at $114.7 billion in June.
Another category with a major comeback was furniture and home furnishings. Sales in this category dropped from $9.2 billion in February to $3.9 billion in April. The group climbed back up to $7.2 billion in May and recovered further to $9.3 billion in June. It is now running only 3.5% below last year's levels. This is a sector that is nearly fully recovered.
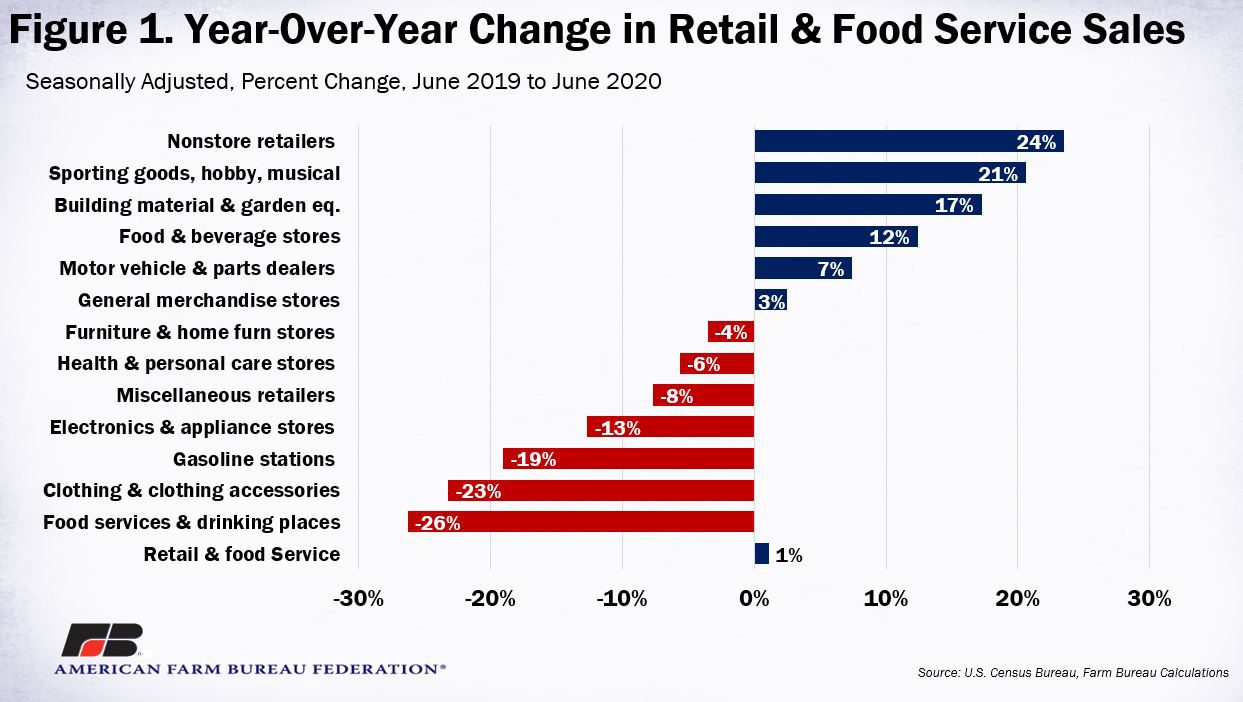
Electronics and appliances, on the other hand, still have a ways to go. June 2020 sales were 13% below last year's levels. Still, that’s a significant improvement from last month when sales were down 37% from April 2020 levels. While the breakout of the June data is not yet available (only the aggregate electronics and appliances category is reported in the advance report), data for May indicated the big drop-off in sales was in the electronics category. Appliance sales in May were up even from February levels. People backed off spending on a new PlayStation or Xbox, but still replaced the refrigerator when it broke.
Food and beverage stores had a slight decline from May, slipping 1%, but they remain 12% over the same period the previous year. On the flip side, gas station sales rose 15% over May but were off 19% from last June's figures.
One of the more amazing figures was the 105% - yes, 105% - rise in clothing and clothing accessory store sales from May. This follows the 177% rise in May over April sales. April sales were down to $2.9 billion from February's $13 billion, clawing back up to $8.6 billion in May. Not to put too fine a point on it, but men's clothing sales dipped to only $90 million in April from $550 million in January. June 2020 clothing sales are back up to $15.9 billion, still well off the $21 billion in sales last year.
Let us dip back into the complicated arena of brick-and-mortar department stores versus the clubs and supercenters versus online sales. Let's begin with department stores (excluding discount department stores). The definition for this category is revealing:
"This U.S. industry comprises establishments known as department stores that have separate departments for various merchandise lines, such as apparel, jewelry, home furnishings, and linens, each with separate cash registers and sales associates. Department stores in this industry generally do not have central customer checkout and cash register facilities."
So in other words, if you go to a store that sells lots of stuff but has registers scattered throughout the store, it's a department store. If they have one set of registers at the exit, it is a discount store.
Sales at department stores classified as non-discount collapsed to only $12 million in April 2020. Recall even men's clothing stores sold $90 million in the same month. In February 2020, these same stores had $3 billion in total sales, so even in the good times, they were not raking in large numbers. But to go from a few billion dollars a month to something just over $10 million is a substantial hit.
We do not have the breakout for June sales data yet, but sales for the combined department store category – discount and non-discount – rose by 20% in June over May, but remain 11% below last year's mark.
Sales for non-store retailers – read that as online sales – actually dipped in June compared to May levels, but sales are 23.5% higher this year when compared to June 2019. And to put things in perspective, those non-discount department stores with sales of only $3 billion in the good months compare to $80 billion for the non-store retailers.
Last but by no means least on the list are food services and drinking places. This is a very large subcategory in the leisure and hospitality grouping. It is one of the largest employment categories. In June 2019, 12.3 million people worked in food services and drinking places. Sales in these categories have come back strong since April, moving from $30 billion in April to $48 billion in June. But that compares to $66 billion in sales in June 2019. Employment in this category is down roughly 3 million people from last year's level – or 24%. Until and unless those sales figures regain something north of $65 billion, it will be difficult for us to return to 12 million employees in this sector.
A final note: These sales occurred on the backend of the stimulus checks and while people were still receiving enhanced unemployment support. Congress is still working on its next move, but another hefty support package is not a given. Without one, expect these numbers to be down noticeably for September and beyond.
Top Issues
VIEW ALL