Dairy Margin Coverage Payments Triggered for Seventh Consecutive Month
TOPICS
USDA
photo credit: New York Farm Bureau member Laura Audrey Hanehan
Daniel Munch
Economist
The Farm Service Agency reports more than 18,900 operations or 75% of all dairy farms with established production history are enrolled in the Dairy Margin Coverage program for the 2021 calendar year (enrollment closed Dec. 11, 2020). This is a 50% increase from 2020 when just over 50% of all dairy operations were enrolled. Part of this increase is due to the extreme price volatility experienced as a result of COVID-19 pandemic induced market fluctuations that pushed many to enroll in an attempt to manage future risk exposure. Recent news of a seventh consecutive month of payouts has many producers grateful for their enrollment decision.
The Dairy Margin Coverage program (DMC) exists to provide a level of risk protection to dairy producers under low margin conditions when milk prices are low and or feed costs, on average, are high. This voluntary program provides payments when the calculated national margin falls below a producer’s selected coverage trigger. The margin is the difference between the average price of feedstuffs (the price of hay, corn, and soybean meal) and the national all-milk price.
Producers are required to select a margin trigger rate and a percentage of production history to be covered (traditionally capped at 5 million pounds). Coverage is available for margins between $4.00 and up to $9.50 under a Tier I CAT (Catastrophic) level or between $4.00 and $8.00 for a Tier II level in $0.50 increments. Producers who select coverage triggers at or above the $4.50 level must pay per hundredweight premiums ranging from $0.0025 to $1.813 per hundred pounds of milk enrolled depending on the tier and trigger rate selected. All enrolled producers must also pay a $100 administration fee. Producers who only select the $4.00 coverage trigger do not pay premiums. Production history selection ranges from 5% to 95% (in 5% increments) of a producer’s established production history.
Under the Agriculture Improvement Act of 2018 (2018 farm bill), production history for each operation is established using the highest of the operation’s marketings from the 2011, 2012 or 2013 calendar years. Under this framework, production history for an operation would not change even if farm characteristics such as the size of the herd were altered. Last December, under the Consolidated Appropriations Act of 2020, supplemental DMC based on 75% of the difference between 2019 marketings and the old base calculation (2011-2013 milk marketings) number was passed into law. The new policy allows operations to option for higher milk production coverage if changes to herd size were made since the 2011-2013 basis years. Though currently the law of the land, USDA has yet to release further guidance or details on when or how the program change would be implemented leaving the 2018 farm bill framework currently in effect.
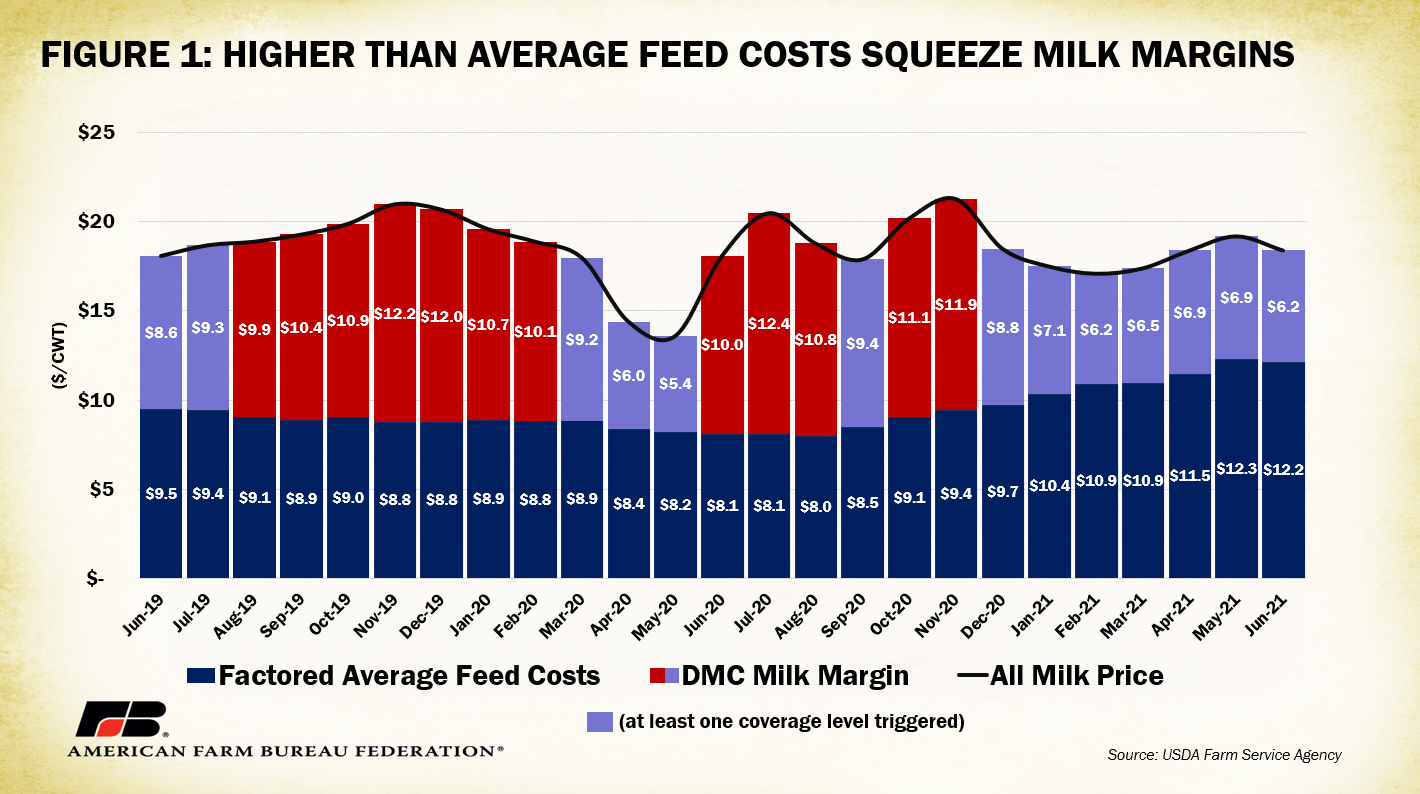
June was the seventh consecutive month with calculated margins below the upper $9.50/cwt trigger cutoff. At $6.24/cwt, the June margin triggered payments under the Tier I level ranging from $0.26/cwt at the $6.50 selection rate and up to $3.26/cwt for those at the $9.50 selection rate. The $6.24 also triggered Tier II level payments ranging from $0.26/cwt at the $6.50 selection rate up to $1.76/cwt for those with the $8.00 selection rate. The FSA expects to pay out over $540 million in DMC payments this year with an average of $28,696 per operation. One of the primary culprits for reduced overall margins is increased feed costs. The factored average feed cost used to calculate DMC margins reached $12.31 in May and $12.16 in June, the highest levels since the program began in 2019. Figure one displays factored average feed cost (dark blue) used to calculate the DMC Margin (red) for the last two years. Subtracting the factored average feed cost from the USDA reported all milk price gives you the DMC milk margin responsible for triggering payments for producers with relevant protection levels.
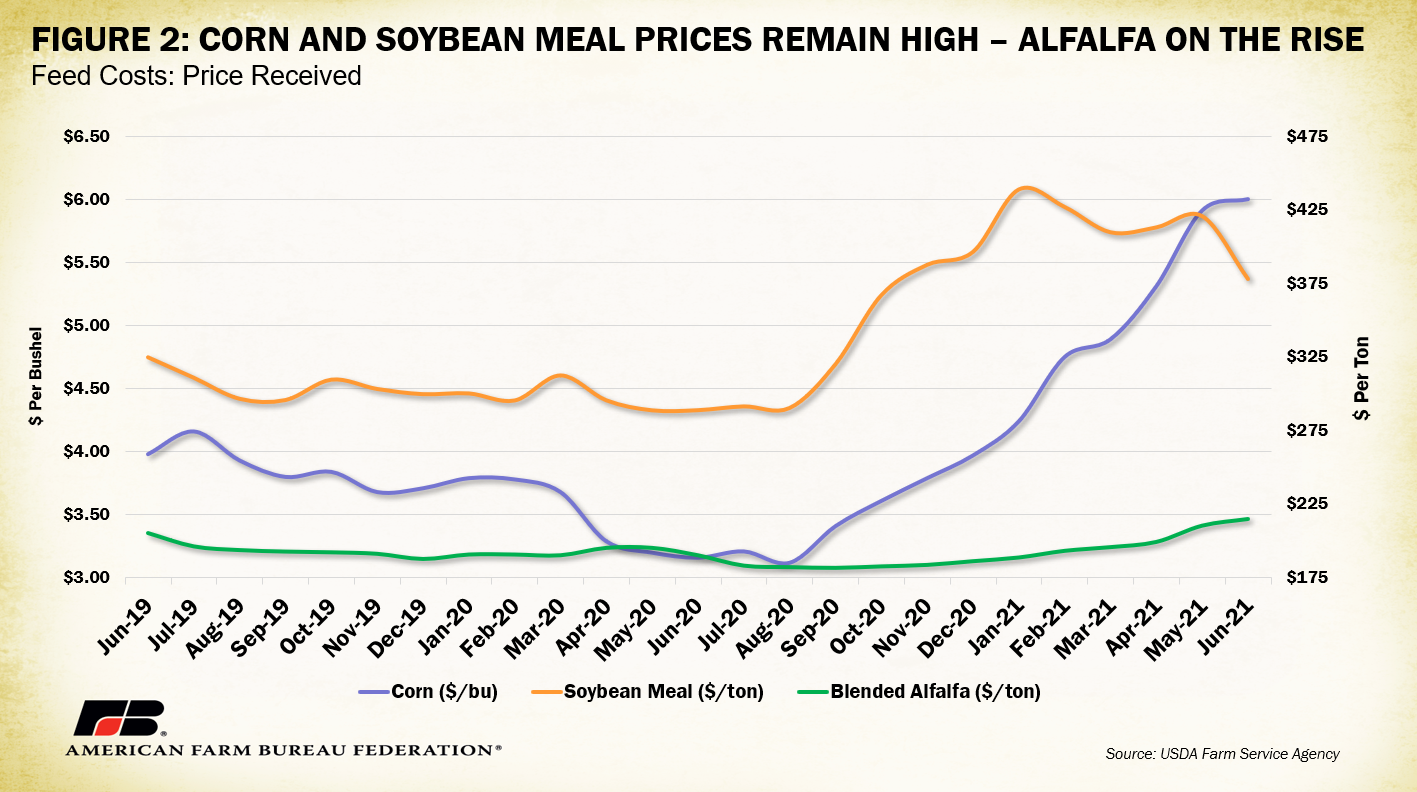
Most of the upward trend in feed costs can be linked to corn and soybean meal prices that have remained higher than average since last summer. Backed by strong exports and lower supply expectations, globally, higher feedstuff prices further pressure the solvency of livestock and dairy farms. Though not as severe of an increase, the blended alfalfa price has experienced a recent upward tick. This is at least partially linked to severe drought conditions across western states that account for 57% of the nation’s hay production by value.
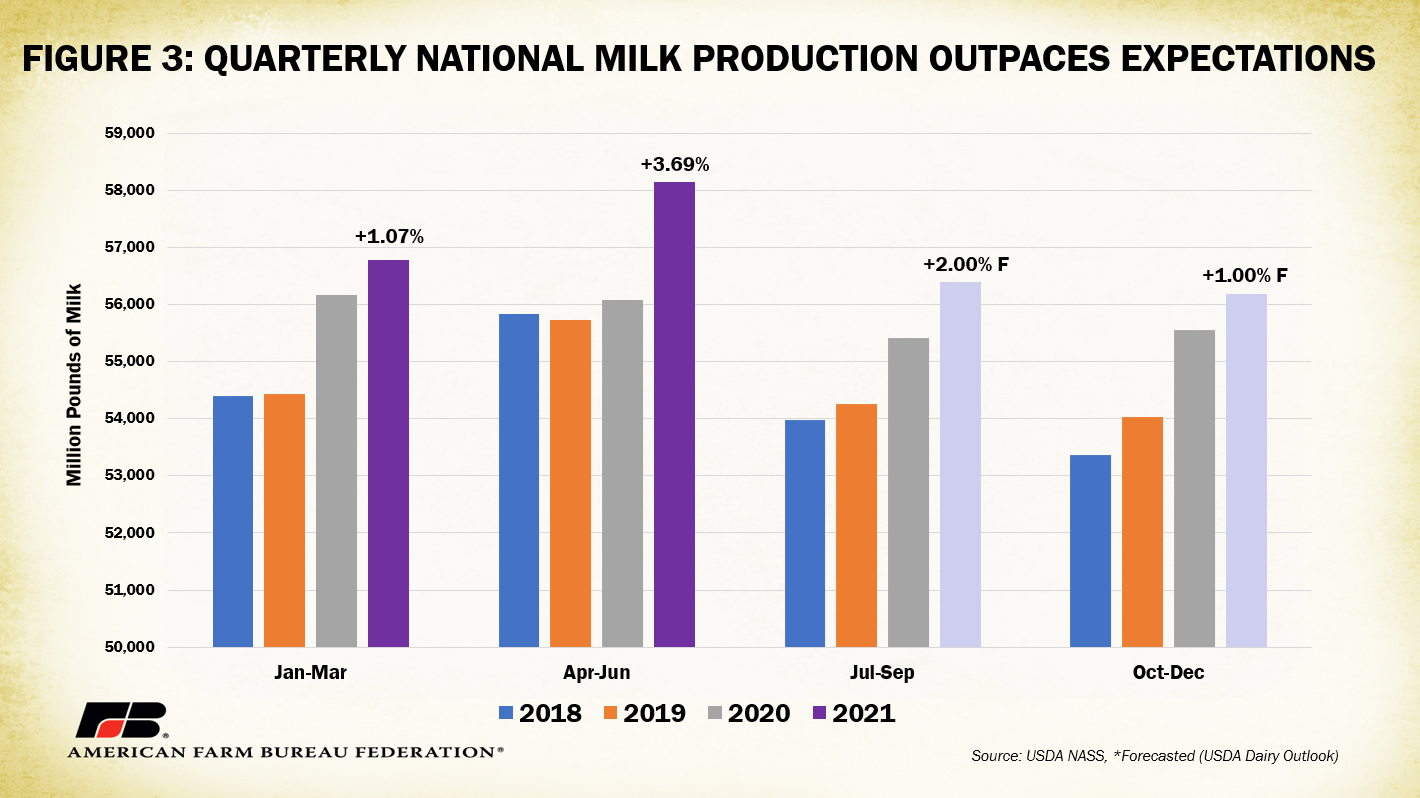
Dairy farmers have also outpaced milk production expectations across the board. Milk production per cow was up 0.2% in Q1 and 2.2% in Q2 from 2020 levels thanks to continued advancements in dairy herd management including further adoption of more efficient milking systems, improved nutritional plans, and effective health and husbandry procedures. In its February outlook, USDA forecasted a 1% increase in national milk production in Q1 and a 3.59% increase for Q2, surpassed by actual increases of 1.07% and 3.69%, respectively. Record supply can be linked to a record national dairy herd over 9.5 million strong as of July 1. In addition, new processing plants in the upper Midwest increased demand for milk, prompting several large-scale expansions in the region, helping drive the increase. Heavy supply conditions negatively pressure milk prices and margins, especially in regions with lower regional consumption.
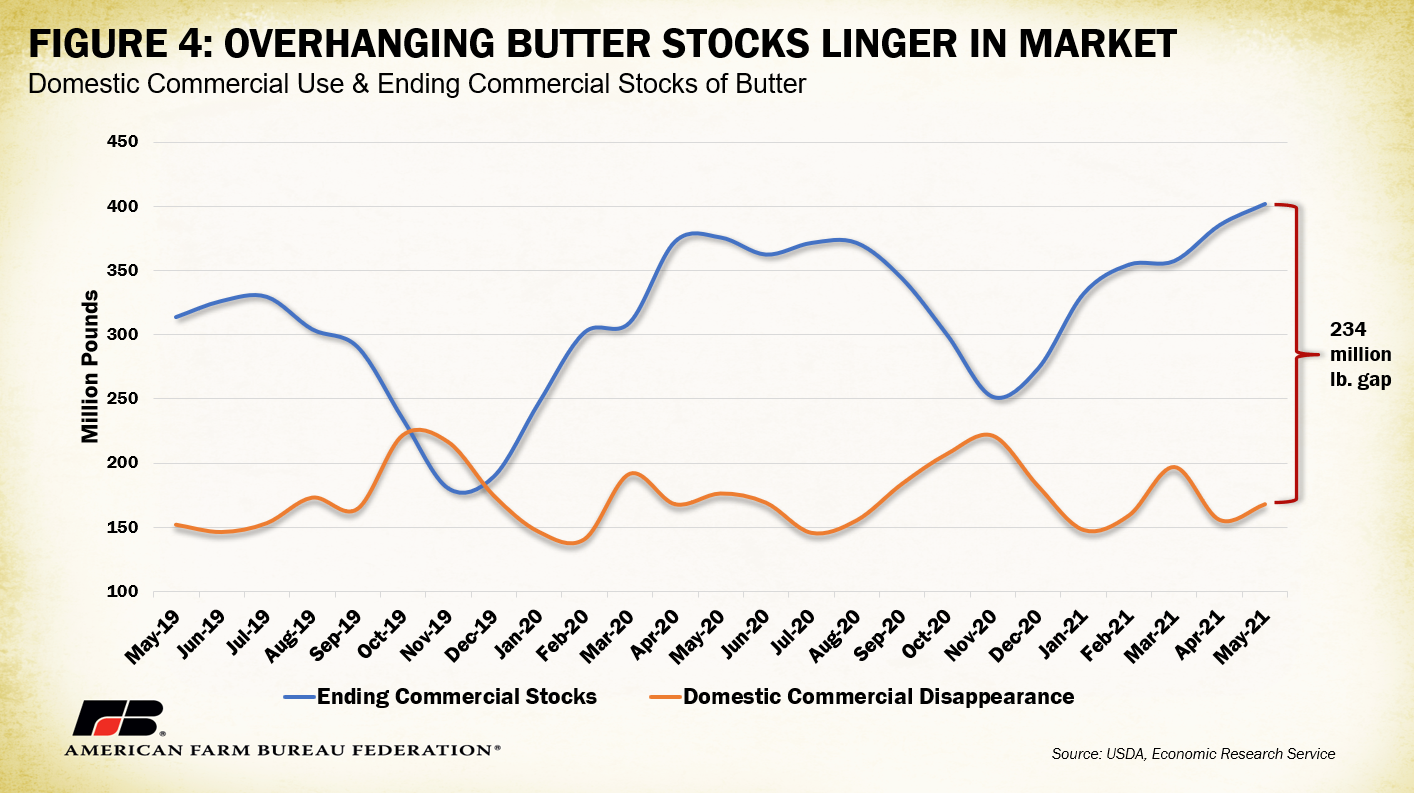
Record butterfat levels, reaching over 4.05% for 2021 (up from 3.95% in 2020), have contributed to historic overhanging butter stocks. In May, ending commercial stocks outpaced domestic commercial disappearance by 234 million pounds. Further additions to stored butter product threaten Class IV prices with related futures prices on a downward trend.
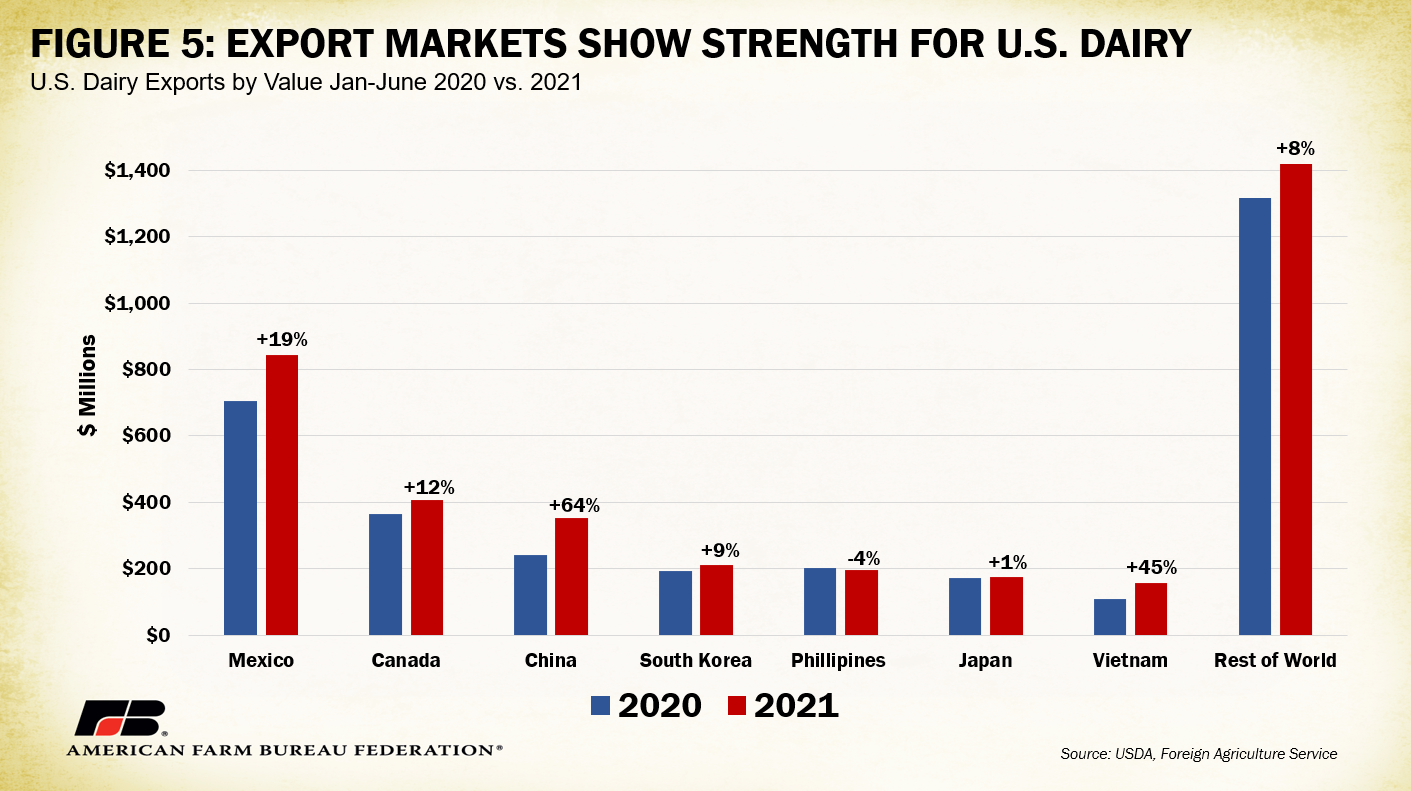
Strong export conditions for U.S. dairy present a positive note for farmers struggling from domestic margin rates. In the latest export data, January-June 2021 showed the highest levels of dairy product exports by value in history with $3.739 billion worth of product sold across borders (compare to $3.308 billion in 2020 and $2.896 billion in 2019). This translated to $1.379 million metric tons of dairy product exported from U.S. borders, a 12% increase in volume from 2020. Mexico leads the pack with $844 million in dairy purchases (285 thousand metric tons), a 19% increase in value purchased from 2020. Mexico’s primary purchases were non-fat dry milk ($453 million) and cheese/curds ($225 million). Canada follows with $408 million in dairy purchases (97 thousand metric tons), a 12% increase in value from 2020. Canada’s primary purchases were “other dairy products” ($264 million). Quickly approaching in third place is China with $353 million in purchases (236 thousand metric tons), a whopping 64% value increase from 2020. China’s primary purchase was whey ($145 million). Export markets remain a viable outlet to move U.S. product and reduce harmful market effects of oversupply. Continued work with international markets to develop opportunities for U.S. dairy can reduce pressure on risk management programs.
Conclusion
Risk management programs like the DMC program provide a revenue buffer for producers feeling the tight squeeze of shrunken operational margins. Persistently high feed prices, strong domestic supply and large product stocks will continue to pressure these margins from both the cost of production and market price angle. Although exports offer an opportunity for supply relief, short-run market conditions have triggered DMC payments for producers at or above the $6.50 margin rates for Tier I and II protections. Until feed costs recede or the all-milk price increases to a margin higher than $9.50, at least some producers will continue to receive program payouts.
Top Issues
VIEW ALL