Heat Wave Could Impact Butter Production
AFBF Staff

photo credit: Mark Stebnicki, North Carolina Farm Bureau
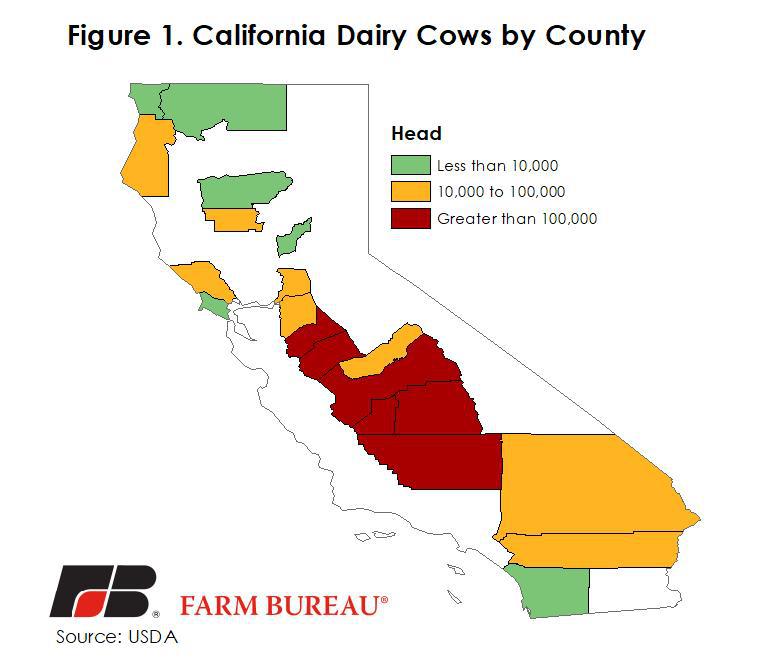
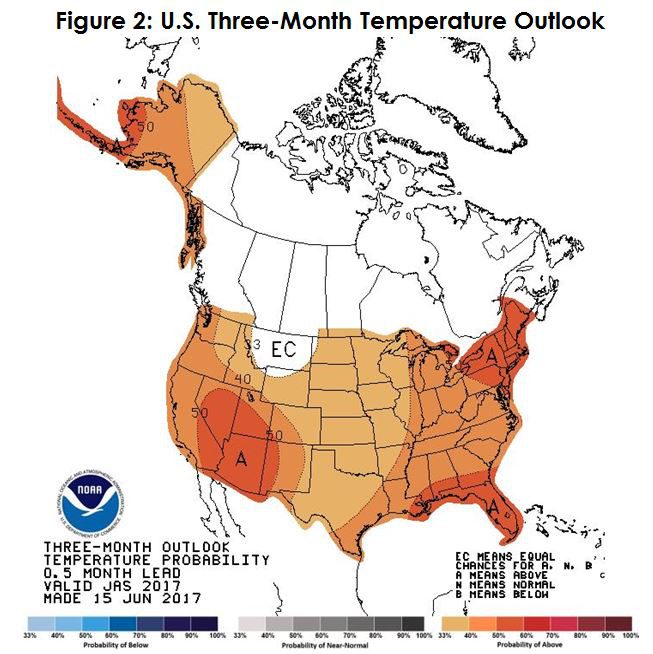
California is the largest milk producing state, representing 20 percent of U.S. milk production every year. The Central Valley has nearly 1.5 million dairy cows and one of the highest concentrations of livestock in the nation, Figure 1. The Central Valley has faced some extreme heat already this year, with nine days in June over 100 degrees. The historical average daily temperature in the Central Valley is 87 degrees, with a record of 111 degrees. This year, the temperature averaged 91 degrees and peaked at 109 degrees. July is typically the warmest month for this region, averaging a high of 95 degrees. However, the first seven days of July shows this could be an unusually warm month as well. Temperatures were between 97 and 101 degrees July 1-7, with daily forecasts for the next two weeks all above 100 degrees. Figure 2 shows the three-month outlook from the Climate Prediction Center.
Milk production takes a significant hit during times of high heat due to animal stress. However, it’s not just yields that will be affected. Extreme heat can reduce component levels and affect downstream processing by changing the yield in dairy products such as butter and cheese.
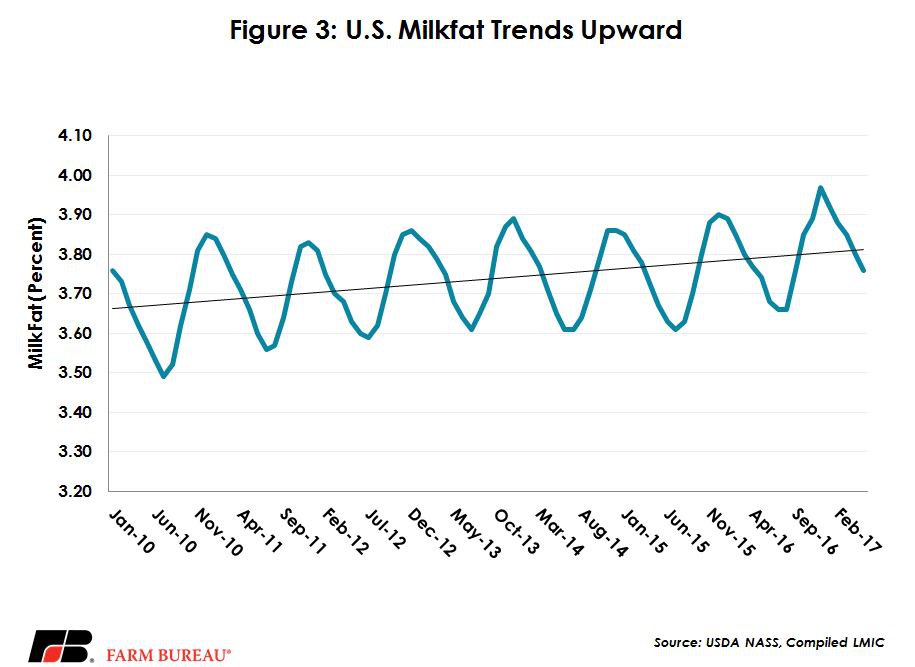
California is home to 14 of the 86 butter production facilities in the U.S. These butter facilities produce over 30 percent of the nation’s butter production on an annual basis, averaging about 603 million pounds per year. Butter contains at least 80 percent milkfat and the remainder is water, protein and salt. Because of this heavy milkfat component, yield per pound of milk is highly dependent on the milkfat content. The rule of thumb is 1 pound of butter takes about 21 pounds of whole milk. U.S. milkfat has been climbing steadily higher as components have become a larger and larger piece of the dairy complex. Figure 3 shows the trend line of higher milk fat content over time as well as the seasonality.
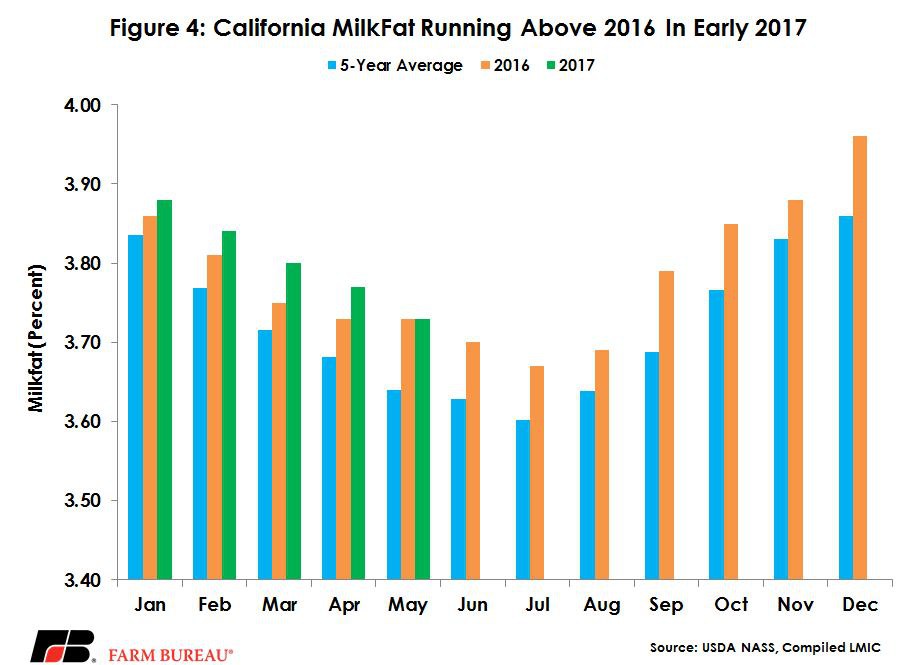
Milkfat can be affected by many factors, including weather, nutrition and genetic variability. The seasonality alone on average varies 7 percent from the depths of summer to the highest point in December. California milkfat has been running high this year, about 1 percent above last year. However, data has been released only through May. June data, which should show the impact of the hot weather, will be released July 31, 2017, by USDA’s National Agricultural Statistics Service. Figure 4 shows California’s milkfat relative to last year and the five year average.
The direct impact heat has on butter production may be difficult to tease out, because California butter plants have been producing less butter this year anyway. Year-to-date, California has produced 6 percent less butter through May, while New York is up 2 percent, Pennsylvania, up 1 percent and other states increased 1 percent. California is also entering into the seasonal low for butter production. In addition, cheese production has increased slightly this year, up about half a percent year to date. If milk components take a big hit in June, its likely cheese production will also be affected. Lower yields on dairy products could prop up the demand for whole milk as it will take larger quantities to produce the same amount of cheese or butter. However, let’s not bet the farm that higher milk prices will follow. Butter and cheese inventories are still at fairy higher levels on a historical basis and exports have dragged notably in the butter complex this year. Total U.S. butter exports through May are down 25 percent, and although cheese exports are up 22 percent, this heat wave is largely regional. California produces a much larger proportion of butter than cheese relative to the national picture. Cheese production in California was about 21 percent of national production in 2016.
Top Issues
VIEW ALL