Historical Bias of USDA’s Acreage Estimates

photo credit: Right Eye Digital, Used with Permission
John Newton, Ph.D.
Vice President of Public Policy and Economic Analysis
The market is currently anticipating fewer corn acres and additional soybean acres planted in 2017. The average trade estimate is for 89.9 million acres of corn and 89.75 million acres of soybeans planted in 2017. These totals are down 93,000 acres and up 268,000 acres, respectively, from the March intentions for corn and soybeans.
The highly anticipated June Acreage report will be released Friday, June 30, 2017, and will either confirm trade expectations or lead to a market surprise. A larger than anticipated change in corn and soybean acreage will likely increase uncertainty in new-crop corn and soybean prices. For soybeans, any large increase in soybean acres will be in addition to record-large South American production and increasing domestic inventories.
Given the price and marketing implications of the June Acreage report, today’s article will review the historical accuracy of USDA’s June estimates and test for any upward or downward bias. Evidence of bias in the June estimates would suggest market participants should not overreact to any bearish market information.
Bias in March to June Acreage Changes
The 1996 Farm Bill, or Freedom to Farm Act, decoupled direct payments from planted acreage and increased planting flexibility by allowing farmers to plant outside their commodity-specific base acreage. This flexibility allowed farmers to alter crop rotation patterns to respond to market price signals and expected crop returns.
A review of acreage changes from USDA’s March Prospective Plantings report to the June Acreage report from 1996 to 2016 shows that on average the June survey reports an increase of 304,000 soybean acres and an increase of 424,000 corn acres. For soybeans, these acreage changes range from -3 million acres in 2007 to an increase of 3.4 million acres in 2014. For corn, the acreage changes range from -1.2 million acres in 1997 to an increase of 2.4 million acres in 2007. As a percentage change from March to June, USDA’s acreage estimate increases an average of 0.4 percent and 0.5 percent for soybeans and corn, respectively. The distribution of percentage changes for corn and soybeans is highlighted in Figure 1.
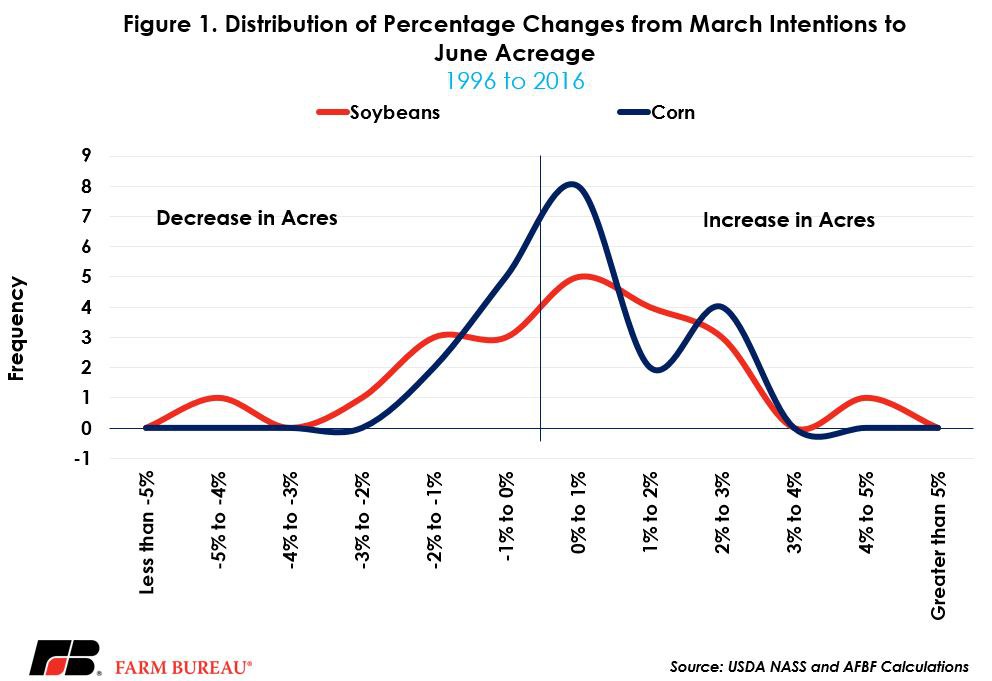
For corn, the distribution is centered to the right of zero and exhibits a bi-modal distribution. For soybeans, the distribution is non-normal, and instead is wide with heavy tails. The shape of the March to June soybean and corn distributions suggests there may be some bias in the USDA estimates. Bias in the estimates would occur if the estimates were consistently different than zero, in any direction. For example, if the USDA consistently reports increases in corn and soybean acreage in the June report, relative to March intentions, the market would build this pattern into their expectations, e.g., a muted price response to large acreage changes.
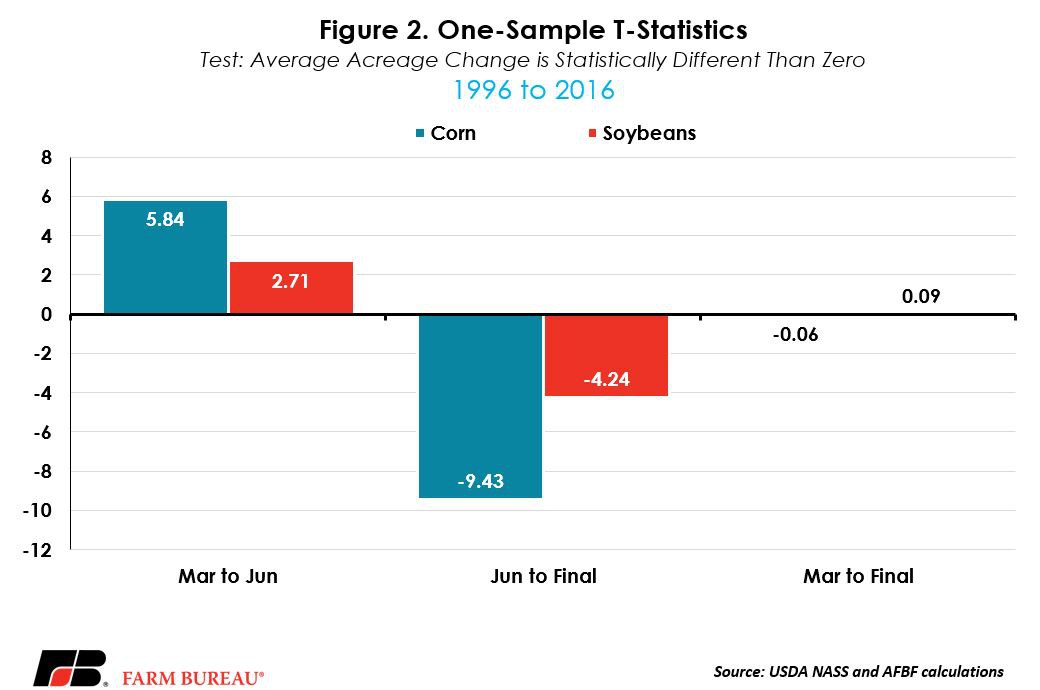
In order to test the null hypothesis that March to June acreage changes are not statistically different than zero, a one-sided t-test is conducted. The t-test to determine if a sample is different than zero is defined as the ratio of the sample mean and the sample standard deviation adjusted for the sample size. The critical values of the t-test for rejecting the null hypothesis at a 95 percent confidence level is 1.725, in absolute value, and using 20 degrees of freedom. The alternative hypothesis is that the acreage changes are significantly different than zero. If the t-test is greater in absolute value than 1.725, the null hypothesis is rejected in favor of the alternative, and evidence of bias would be confirmed.
The t-tests for March to June acreage changes, using data from 1996 to 2016, for corn and soybeans, respectively, are 5.84 and 2.71. These test statistics indicate that the null hypothesis should be rejected for corn and soybeans, and that the alternative hypothesis should be accepted. Figure 2 shows the t-test calculation using 1996 to 2016 acreage changes.
So why are the March to June acreage changes for corn and soybeans statistically different than zero? A likely reason for the high t-test is that U.S. growers have consistently reported increased acreage in response to supply and demand signals that may not have been fully realized in the spring survey of intentions. For example, from the time planting begins until the first two weeks of June when the survey is completed, growers are responding to weather conditions, the pace of planting, crop conditions, and the pace of old-crop consumption. These factors impact the economic returns associated with new-crop corn and soybeans – potentially altering acreage allocations.
For corn and soybeans, historical acreage changes, combined with the results of the t-test, implies that large positive changes are possible in the June Acreage report. The following question is, will large changes to acreage hold, or is USDA’s final estimate of crop acreage also biased? If additional bias is found, then the market response to the June acreage estimate could be muted, as the market would expect future revisions.
Growers Usually Plant Less Than June Survey
Each year, the January Crop Production report provides final estimates for the prior year’s planted crop size. Historical revisions to corn and soybean acreage show that, on average, USDA reports fewer corn and soybean acres by the final January report relative to the June survey. For soybeans, acreage revisions range from a low of -2.9 percent to a high of 1.6 percent, and average -0.4 percent or -311,000 acres. For corn, January acreage revisions range from a low of -2.1 percent to a high of 0.9 percent, and average -0.5 percent or -429,000 acres. The distribution of June to January percentage changes in acreage is highlighted in Figure 3.
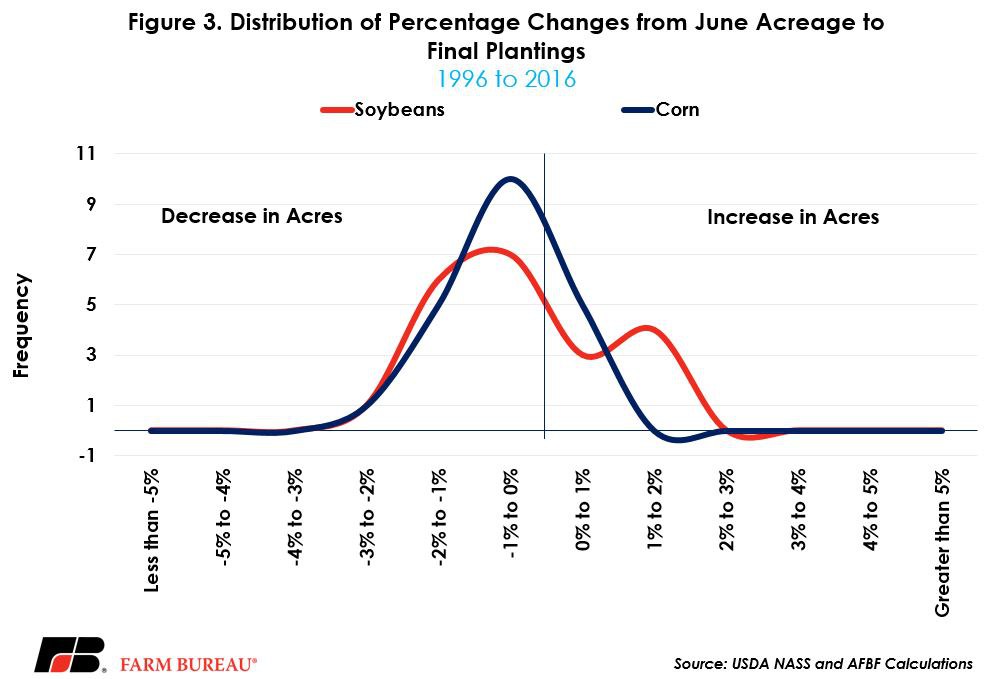
Each distribution is centered to the left of zero, suggesting that the final acreage changes could be downward biased. For both corn and soybeans, the one-sided t-test statistics are greater than the critical value of 1.725 in absolute value. The t-tests confirm that January acreage revisions are downward biased. The positive then negative bias suggests the following pattern: the June survey responses suggest an increase in June-estimated acreage, likely in response to market signals received during the spring, but by January many of those acres are ultimately never planted, again due to changing market signals, leading to downward revisions to crop acreage.
Market signals constantly change. Consider that during 1996 to 2016 growers responded to a variety of market signals that emphasized the planting of one crop over another. Decoupled farm program payments, the increased use of corn for ethanol beginning in 2007, increased Chinese demand for soybeans, and more competitive South American crops. Each year is different.
March is a Good Barometer of Final Plantings
Many in the trade look at USDA’s historical supply and demand estimates for patterns. For example, does a big crop always get bigger? In this case, does the June acreage always overestimate corn and soybean plantings? The results of this analysis suggest there may be some truth to this claim.
The changes in USDA’s acreage estimates emphasize how growers respond through the planting season to market signals – at least in their survey responses. The net impact of positive bias in June and negative bias in January is that March intentions generally prove to be a decent barometer of final plantings.
Since 1996, the average deviation in actual plantings from March intentions was -7,000 acres for soybeans, approximately -0.01 percent, and was -5,000 acres for corn, or -0.01 percent. Importantly, the t-tests for corn and soybeans are below the critical value of 1.725 in absolute value, indicating that the difference between the final acreage estimate and March intentions is not statistically different than zero.
To increase accuracy USDA consistently seeks to improve reasonableness and consistency of the estimates by examining the historical relationship of official estimates to survey data. Farmers can also help USDA improve the accuracy by providing timely and accurate information on these important surveys.
Top Issues
VIEW ALL