House and Senate Farm Bills Contribute to Deficit Reduction
TOPICS
Market Intel
photo credit: AFBF Photo, Philip Gerlach
John Newton, Ph.D.
Vice President of Public Policy and Economic Analysis
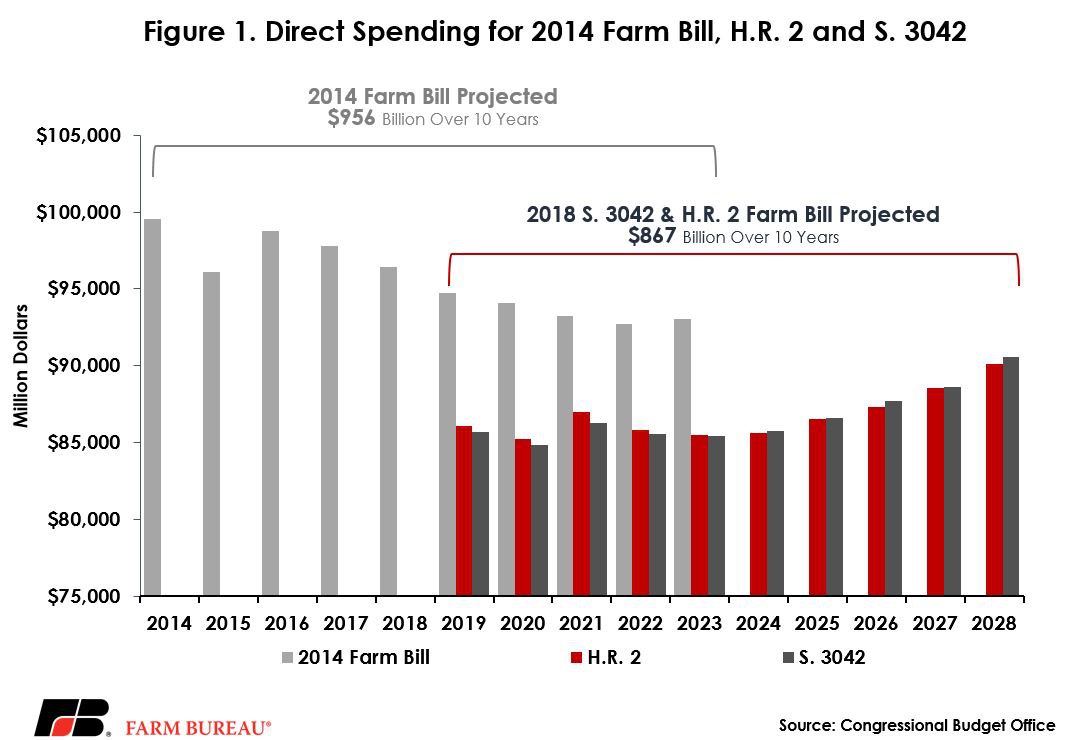
The Congressional Budget Office's May 2013 Baseline for Farm Programs projected farm program spending over a 10-year period at approximately $978 billion. CBO’s most recent May 2018 baseline for USDA’s mandatory farm programs projected 10-year outlays at $867 billion. The most recent CBO cost estimates for the House and Senate committee-passed farm bills show that from fiscal years 2019 to 2023, H.R. 2 would reduce direct spending by $7 million and S. 3042 would reduce direct spending by $107 million – meaning both bills are effectively budget-neutral.
A comparison of the House and Senate committee-passed farm bills to the May 2013 baseline shows a cumulative difference in farm bill spending of approximately $112 billion over a 10-year period – driven by both the 2014 and 2018 committee-passed farm bill reforms. That’s more than $100 billion toward deficit reduction — a strong signal that agriculture is doing its part to reduce the federal deficit by cutting spending in several key farm program categories such as nutrition and crop insurance. Figure 1 shows farm bill direct spending by fiscal year for the 2014 farm bill and both the House and Senate committee-passed farm bills, highlighting their significant contribution to deficit reduction and the reductions achieved in overlapping years.
House and Senate Farm Bill Spending
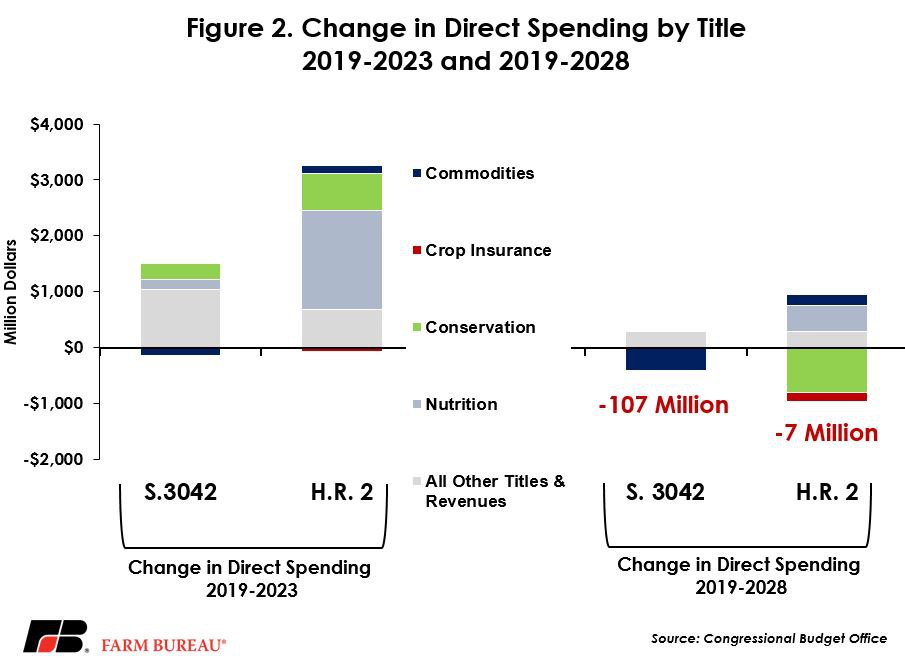
CBO estimates that H.R. 2 would increase direct spending by $3.1 billion over the 2019-to-2023 period. While H.R. 2 increases direct spending over a 5-year period, over a 10-year period the House committee-passed farm bill slightly reduces spending, i.e. it is budget-neutral. The budget-neutral status is achieved by reducing conservation spending by $795 million, reducing crop insurance spending by $161 million, increasing direct spending in commodity programs by $193 million, increasing nutrition spending by $463 million, and increasing spending in all other titles by $294 million. Combined, over a 10-year period, the House committee-passed farm bill saves $7 million compared to the May 2018 CBO baseline for USDA’s mandatory farm programs.
CBO estimates that under the Senate committee-passed farm bill direct spending would increase by $1.4 billion over the 2019-to-2023 period. However, over a 10-year period, CBO also projects the Senate committee-passed farm bill to be mostly budget-neutral, with a spending reduction equivalent to a hundredth of 1 percent. The spending reduction is achieved by reducing commodity program spending by $395 million, reducing nutrition spending by $6 million, reducing crop insurance spending by $2 million, leaving conservation spending unchanged and increasing spending in all other titles by $294 million. Combined, the Senate committee-passed farm bill is projected to reduce direct spending by $107 million over 10 years. Figure 2 highlights House and Senate committee-passed farm bill spending changes by title over a 5- and 10-year baseline period.
Summary
Agriculture is doing its part in contributing to deficit reduction. The 2014 farm bill reformed commodity programs by eliminating direct payments and making farm program payments need-based, triggered by declines in market prices or revenues. The 2014 farm bill also strengthened the ability of farmers and ranchers to protect and preserve the environment through conservation initiatives, all while reducing deficit spending by billions of dollars. Based on the House and Senate versions of the legislation, the 2018 farm bill is expected to continue this trajectory, which evolved from key reforms made in 2014. Additionally, when considering managers’ and floor amendments both bills are like to contribute even more to deficit reduction.
With farm income at decade-low levels, farm debt climbing, interest rates rising, and trade tensions heightening, now is not the time to ask farmers and ranchers to tighten their belts even more by reducing the effectiveness of their risk management programs.
Top Issues
VIEW ALL