Increasing Freight Rail Rates Put Additional Pressure on Farm and Ranch Income
TOPICS
Transportation
photo credit: Getty
Daniel Munch
Economist
The domestic rail transportation network is vital to the movement of products and goods supplied by America’s farmers and ranchers. In 2019, over 33 million carloads of U.S. goods navigated the nearly 140,000-mile U.S. rail system, generating over $85 billion in total rail revenue. According to the Surface Transportation Board (STB), an independent federal agency tasked with economic regulation of freight rail, farm products contributed nearly 7.4%, or $6.3 billion, of total rail revenue, with an additional 13%, or $11 billion, from the transportation of food, textile mill, wood, and paper and pulp products. This Market Intel dives into the continued upward trend in freight rail rates contributing to heightened farm-level business expenses.
Unlike roadways, U.S. freight railroads are privately owned. As independent businesses they are responsible for the maintenance and efficiency of their railways as well as for selecting competitive rates (tariffs) and formulating contracts. Approximately 94% of the revenue generated by the rail system belongs to seven Class I railroad-operating firms. Class I rail firms are defined as having inflation-adjusted annual carrier operating revenue of $900 million or more and include: Burlington Northern and Santa Fe Railway (BNSF), Canadian National Railway (CN), Canadian Pacific Railway (CP), CSX Transportation, Kansas City Southern Railway (KCS), Norfolk Southern Railway (NS) and Union Pacific Railroad (UP).
An interactive map of Class I railways can be found here: https://www.arcgis.com/apps/mapviewer/index.html?webmap=841e4f742d444a5aa38957cbd84518fc
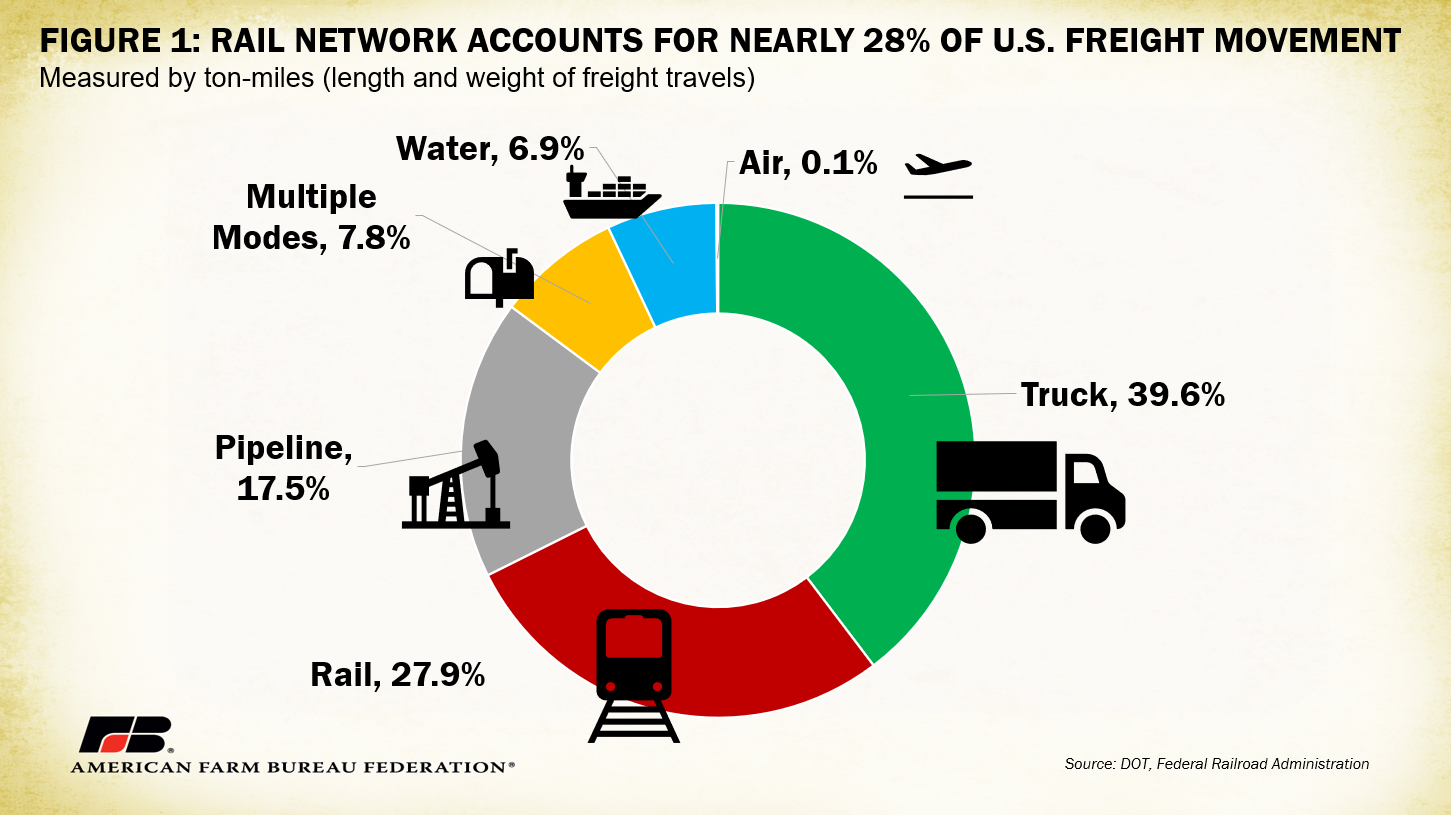
Non-Class I railroads, or regional and short line railroads, number 584 and 22, respectively, and account for 32% of freight rail mileage. Compared to other freight transportation methods, the combined structure of U.S. railways accounts for nearly 28% of freight movement, the second-largest share behind trucks. Depending on cost and market conditions, competition between transportation options may increase, impacting how product is delivered to its final destination.
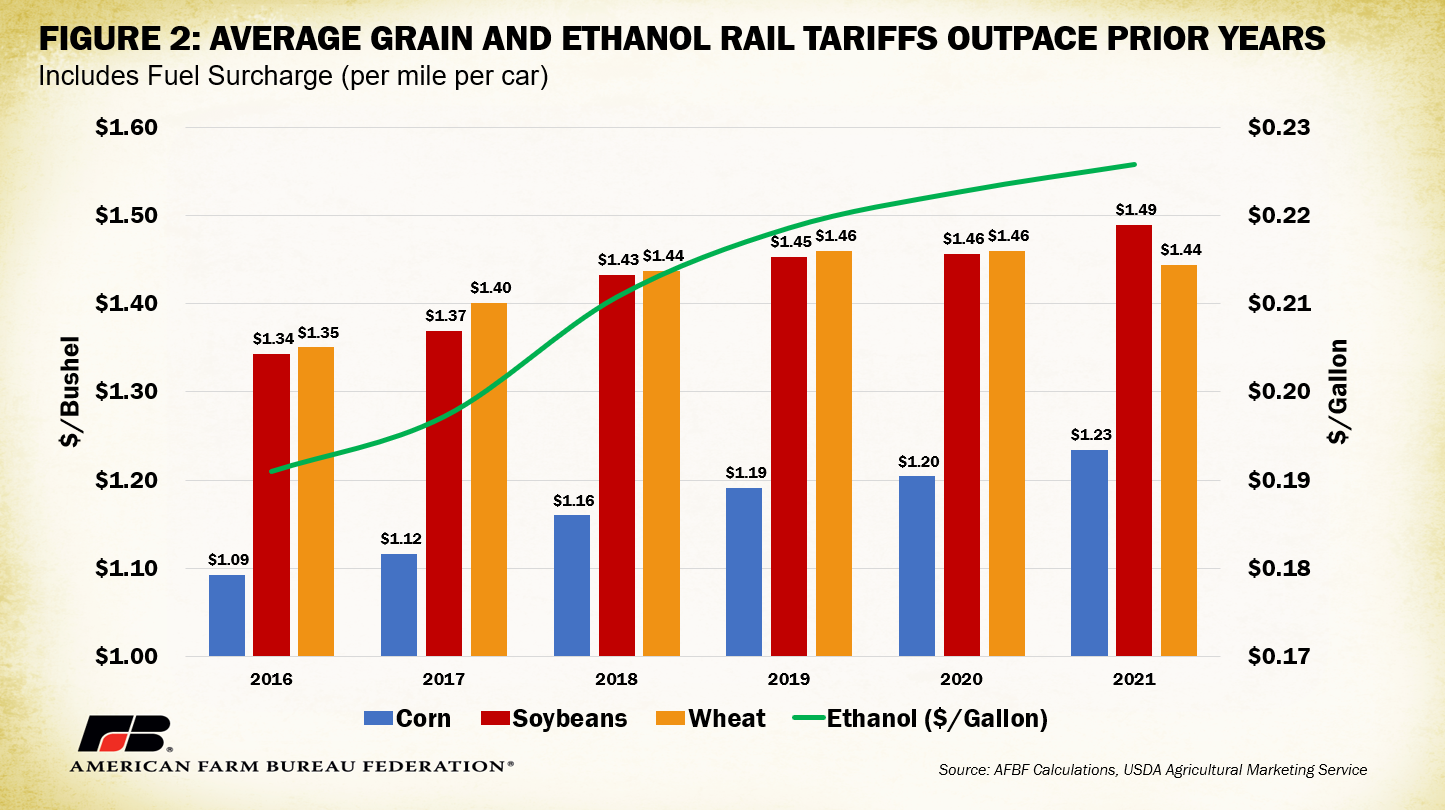
Over the last five years, the cost of shipping grain on railways has increased. Rail rates on corn, soybeans and wheat, including fuel surcharges, have gone up 13%, 11% and 7%, respectively, since 2016. Similarly, rates to transport ethanol via rail have increased 18%, or about $0.04/gallon.
USDA’s Agricultural Marketing Service includes tariff data from four Class I railroads responsible for over 80% of 2021 domestic rail-based grain movements: CN, UP, BNSF and CSX. Considering rates individually, since 2016, both UP and CSX reported double-digit rate increases of 10% and 20%, respectively, amounting to an average of $1.23/bu and $1.62/bu. CN has remained fairly stable, hovering around $1.03/bu and BNSF has increased by approximately 5% to $1.41/bu. These numbers signify much of the overall increase in average grain tariff rates may be linked to specific railways and do not necessarily reflect trends across the entire market.
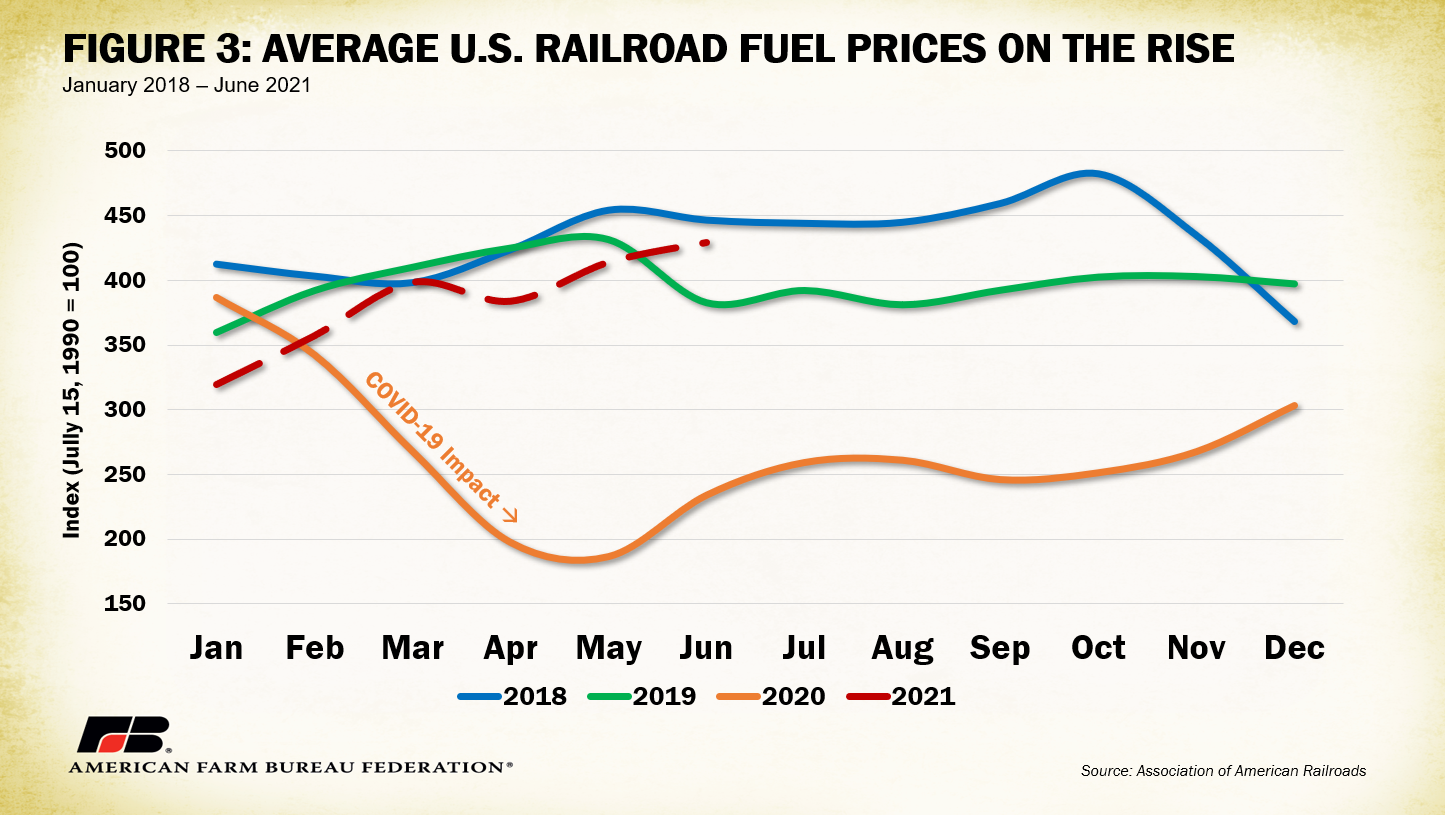
Given increasing fuel prices in the broader economy, one could expect any increase in freight rail rates would be linked. The Association of American Railroads’ three-year fuel price index shows a modest increase in rail fuel prices, though that’s primarily a recovery from COVID-19-related price drops linked to reduced consumption during early 2020 lockdowns. In the first half of 2021, prices have all but returned to 2018 and 2019 levels.
Additionally, railways often adjust for excess fuel costs in the form of fuel surcharges (FSC), reducing the burden of fuel costs on the underlying base rate. Fuel surcharges on grain have increased from an average of 1.6 cents per car-mile in 2016 to 6.5 cents per car-mile in the first half of 2021, which translates to a near 300% increase over five years. It is important to note, fuel surcharges are still drastically below 2010-2015 levels, which averaged 31.8 cents per car-mile, though overall tariff rates during the same timeframe were 18% lower than 2021 levels.
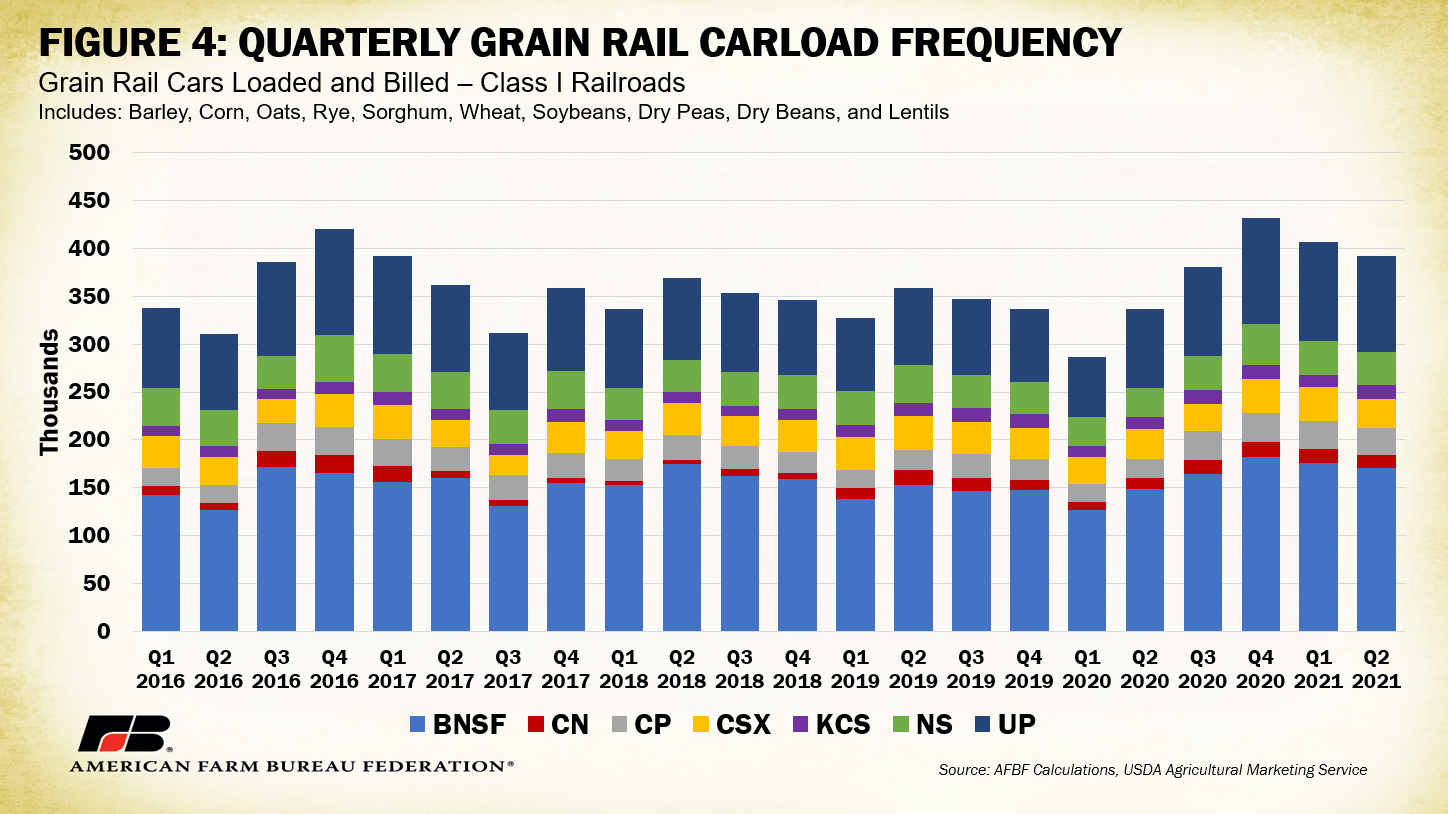
Considering the frequency of rail cars loaded, there is no obvious upward trend that would signify a clear increase in rail demand over the past five years. Overall, the number of grain cars loaded and billed by Class I railways hovered between a low of 286,000 in the first quarter of 2020, likely another COVID-19 related shock, and highs of 419,000 in the fourth quarter of 2016 and 430,000 in the fourth quarter of 2020. Both peaks appear to be linked to periods during which export sales of corn, soybeans and wheat reached record levels; the upward trend in the latter half of 2020 likely relates to record grain purchases by China as a result of the Phase I trade agreement. Keep in mind the significance of harvest, which positively influences carload frequencies in the third and fourth quarters. The proportion of cars loaded and billed by each railway firm remained stable over the period analyzed, with BNSF and UP claiming approximately 68% of the total annually.
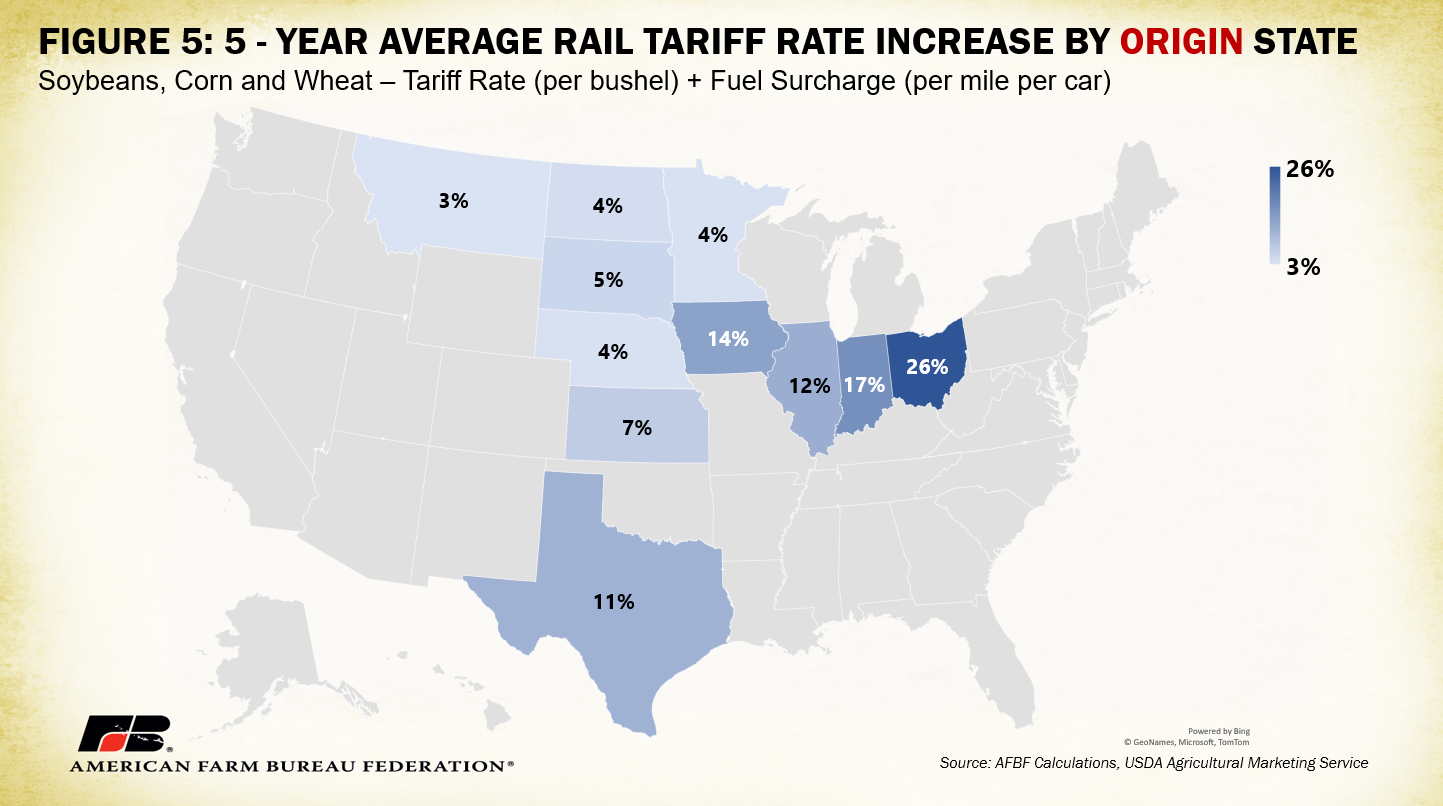
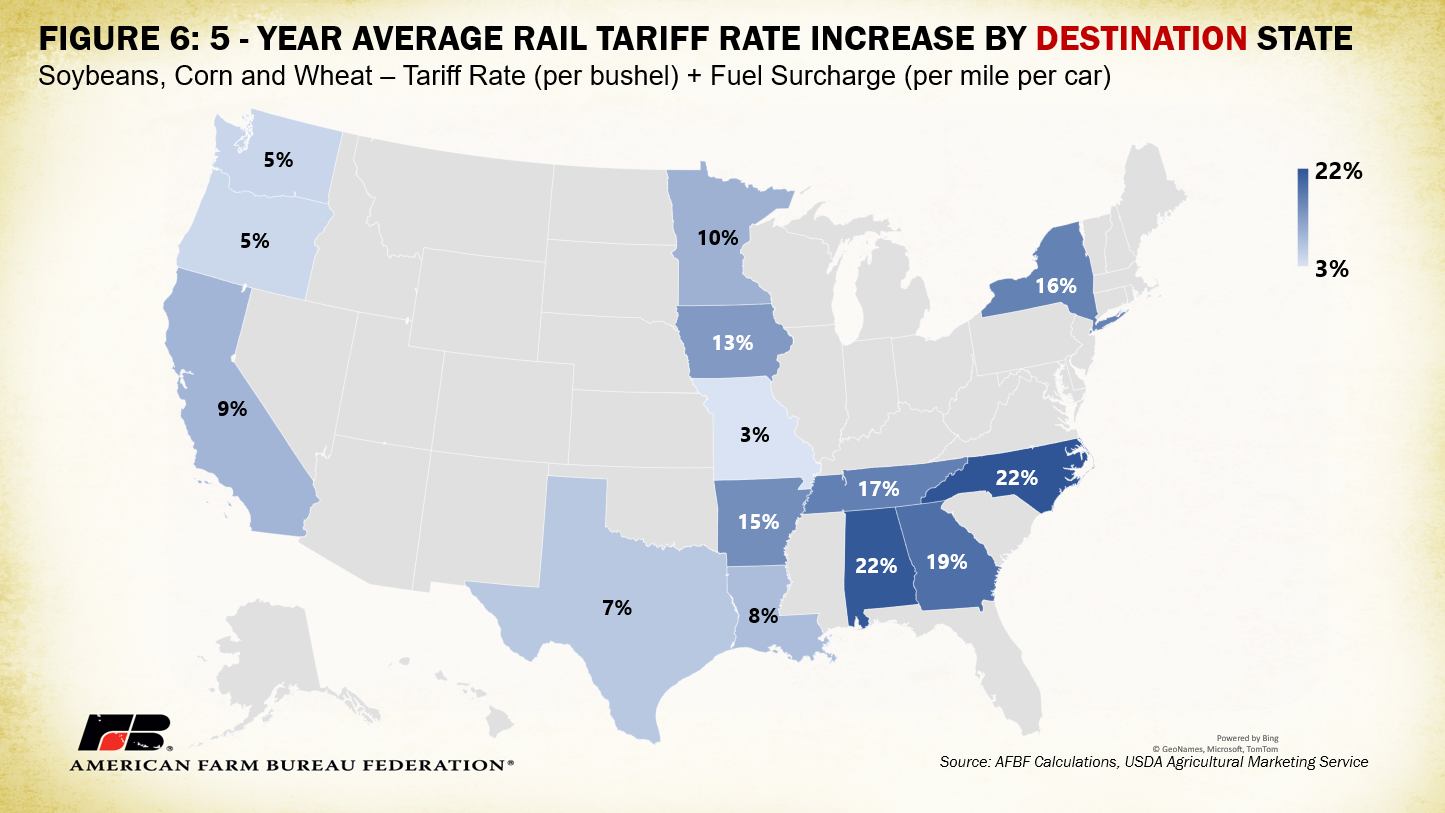
Digging into regional differences in rail markets provides a better understanding of the uniformity or lack thereof in tariff increases. Figures 5 and 6 show the five-year average tariff rate increase by origin state and destination state, respectively, for soybeans, corn and wheat. Ohio experienced the highest rate increase (26%) by origin, with an average rate (including FSC) of $1.70/bu. Based on destination, North Carolina had the highest increase (22%), with an average rate (including FSC) of $1.60/bu.
There are many reasons certain states experienced higher rate increases than others. Crop productivity increases in certain areas can pressure structurally limited freight terminals, restricting the supply that can be shipped to or from certain locations and positively influencing local tariff rates. The end use of a particular crop may also play a role, including whether a carload is bound for international borders via seaports that may also be structurally constrained in their ability to accept more shipments.
Notably, CSX and NS railways are the primary Class I operators in states with both the highest origin state rate increases (Indiana and Ohio) and destination state rate increases (North Carolina, Alabama, New York and Tennessee). As previously mentioned, CSX had the most significant rate increase of the reported Class I railways, a 20% rise since 2016, a statistic that is clearly reflected in these regional increases. Private investments railways make to improve their infrastructure and services may also be reflected in increased rates specific to certain lines.
Results from a June Rail Customer Coalition analysis on railway consolidation and rate increases prompted this AFBF analysis. Partly in line with the conclusions of that report, the organizational structure of the railway market also plays a role in tariffs rail freight customers, such as farmers and ranchers, pay. Under the Staggers Rail Act of 1980, which provided a jolt of deregulation needed to put a then-withering U.S. railway industry back on its feet, railroads were afforded some flexibility in their pricing procedures. The STB evaluates rate increases based on if a specific railway movement is market dominant (non-competitive), defined by the ratio of revenue to variable costs for that movement (a ratio less than or equal to 180% is not considered a market dominant movement). Railway movements that are found to be market dominant are not strongly influenced by competitive factors from other modes of transportation or railways and generally must have proposed rate increases examined though formal STB cases. Certain movements within a particular railway company’s jurisdiction may be categorized as market dominant while others are not, meaning not all revenue is considered competitive or non-competitive within a specific firm.
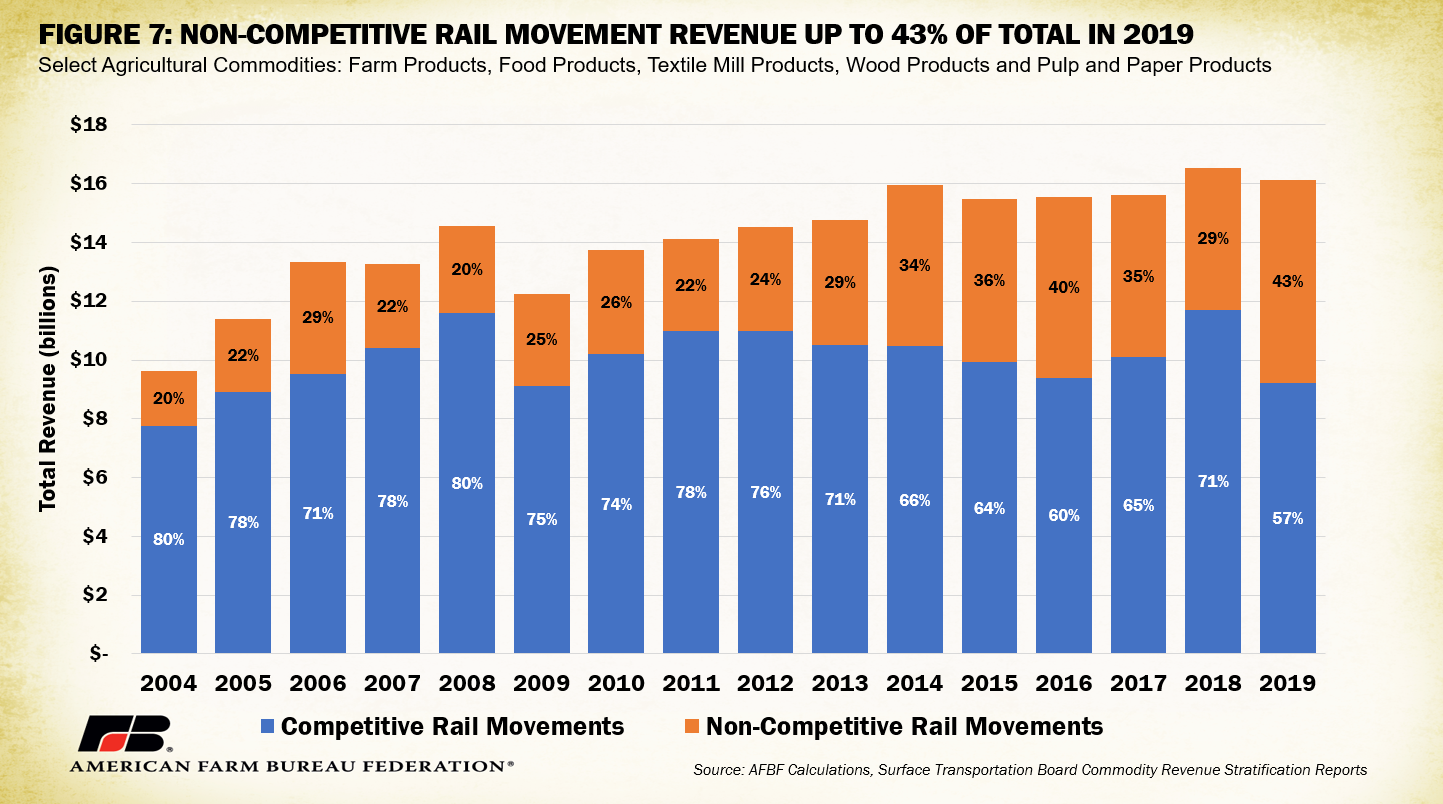
Figure 7 illustrates 2004-2019 agriculture-specific rail revenue by its underlying categorization from competitive or non-competitive rail movements. Commodities represented in the revenue number include farm products, food products, textile mill products, wood products and pulp and paper products. Since 2004, the proportion of total revenue from non-competitive movements has increased two-fold (20% to 43%). This means a larger percentage of revenue is from movements not subject to strong competitive forces, a possible incentive for railways to exhibit price setting behavior. If the STB fails to evaluate rate increases on all non-competitive movements, rate increases can slip under the radar and disproportionally impact customers limited in their ability to choose other transportation options. Since deregulation in 1981, however, average inflation-adjusted freight rates were still down 43% in 2019.
Conclusion
In 2020, farm services, which include transportation and marketing expenses, accounted for over 12% of total farm-level production costs. Tightening margins due to increasing production costs across the spectrum put the solvency of farms and ranches at risk. Railways, a vital piece of the supply chain, are an efficient way to get agricultural goods to their final destination. Increasing tariff rates associated with railways put additional pressure on producers’ bottom lines, especially in locations with weak competitive forces, high product supply, constrained transportation infrastructure and increased fuel prices.
Top Issues
VIEW ALL