From Grocery Carts to Doorsteps: 2024 Food Spending

Daniel Munch
Economist
A lot happens between harvest and when a consumer sits down for breakfast. Changing tastes across generations continue to influence what, where and how people eat. At the same time, the push for convenience and speed is reshaping how farmers and ranchers get their products to processors, retailers and even delivery apps. Market-moving forces such as prolonged inflation and rapid growth in digital ordering have accelerated long-term shifts, often creating new and unexpected avenues for consumption. This article reviews the latest food expenditure data to highlight evolving trends that will define competitiveness in today’s food economy.
USDA-Economic Research Service’s (ERS) Food Expenditure Series tracks the value of the U.S. food system by reporting on total food and beverage spending. This spending data is categorized as food consumed at home or food consumed away from home, like restaurants or hotels. For both the food at home and food away from home categories, spending is broken down further by the type of retail or food service outlet from which food and beverages were purchased.
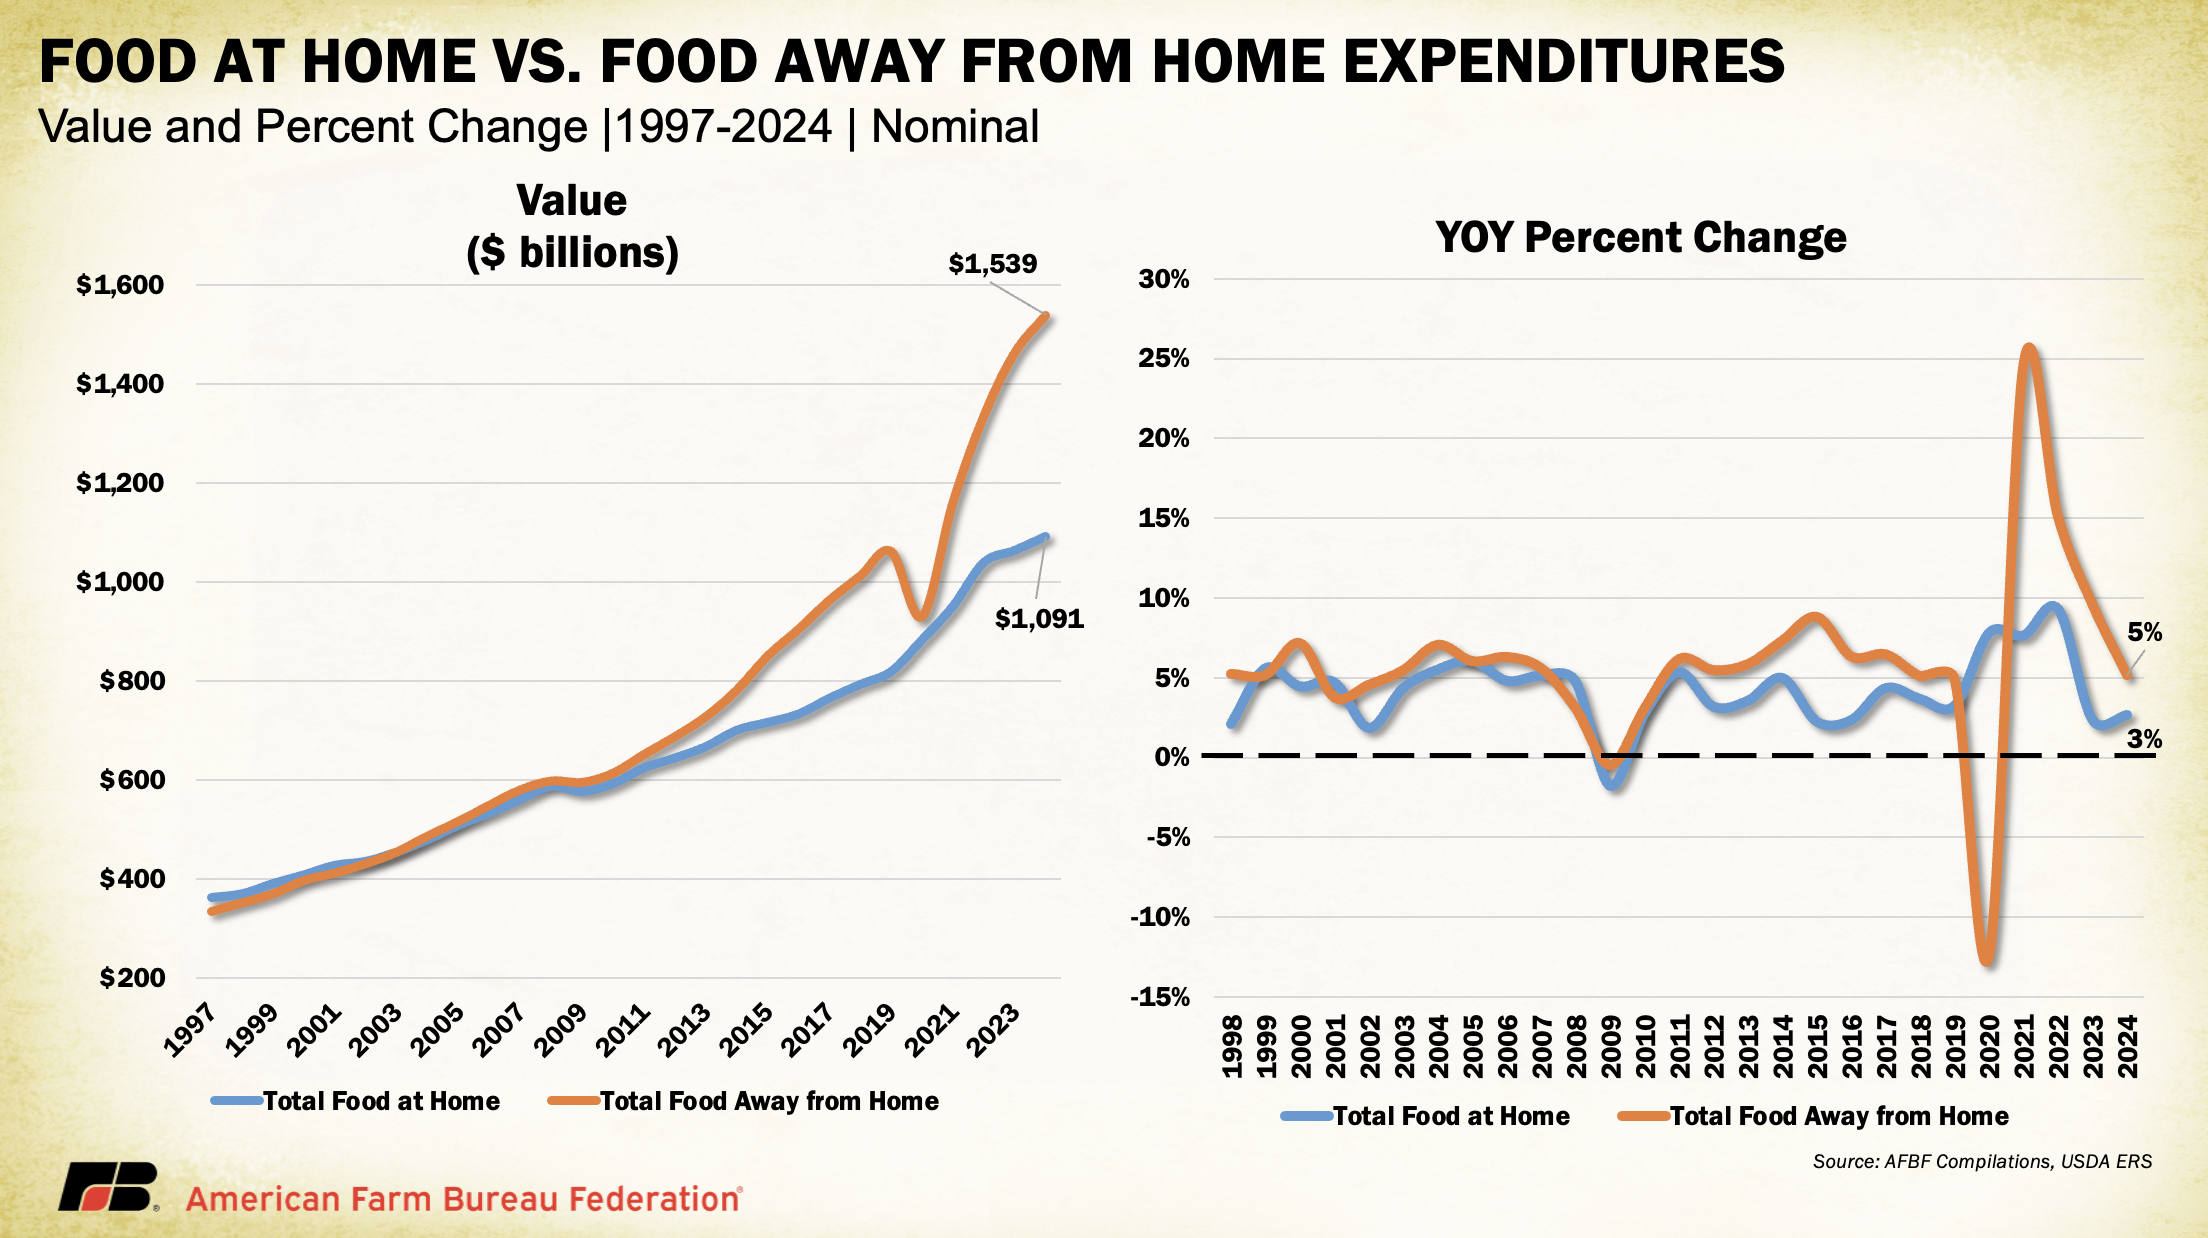
From 1997 to 2024, U.S. spending on food at home rose from $363 billion to $1.091 trillion, while food away from home surged from $336 billion to $1.539 trillion. Inflation explains much of the increase, but consumer habits also shifted, with away-from-home spending overtaking food at home in 2002 and staying well ahead except during the Great Recession and briefly in 2020.
The pandemic caused the sharpest break in the trend: between 2019 and 2020, food at home spending rose 8% as food away from home fell 12%. Once restrictions eased, spending outside the home rebounded 25% in 2021 and 15% in 2022.
Longer-term, food away from home has grown faster, about 7% annually since 2010 compared to 4% for food at home, and closer to 9% when excluding 2020. In 2024, Americans spent $447 billion, or 40%, more on food away from home, as convenience, quick-service options and rising grocery costs narrowed the price gap with eating out.
Food at Home
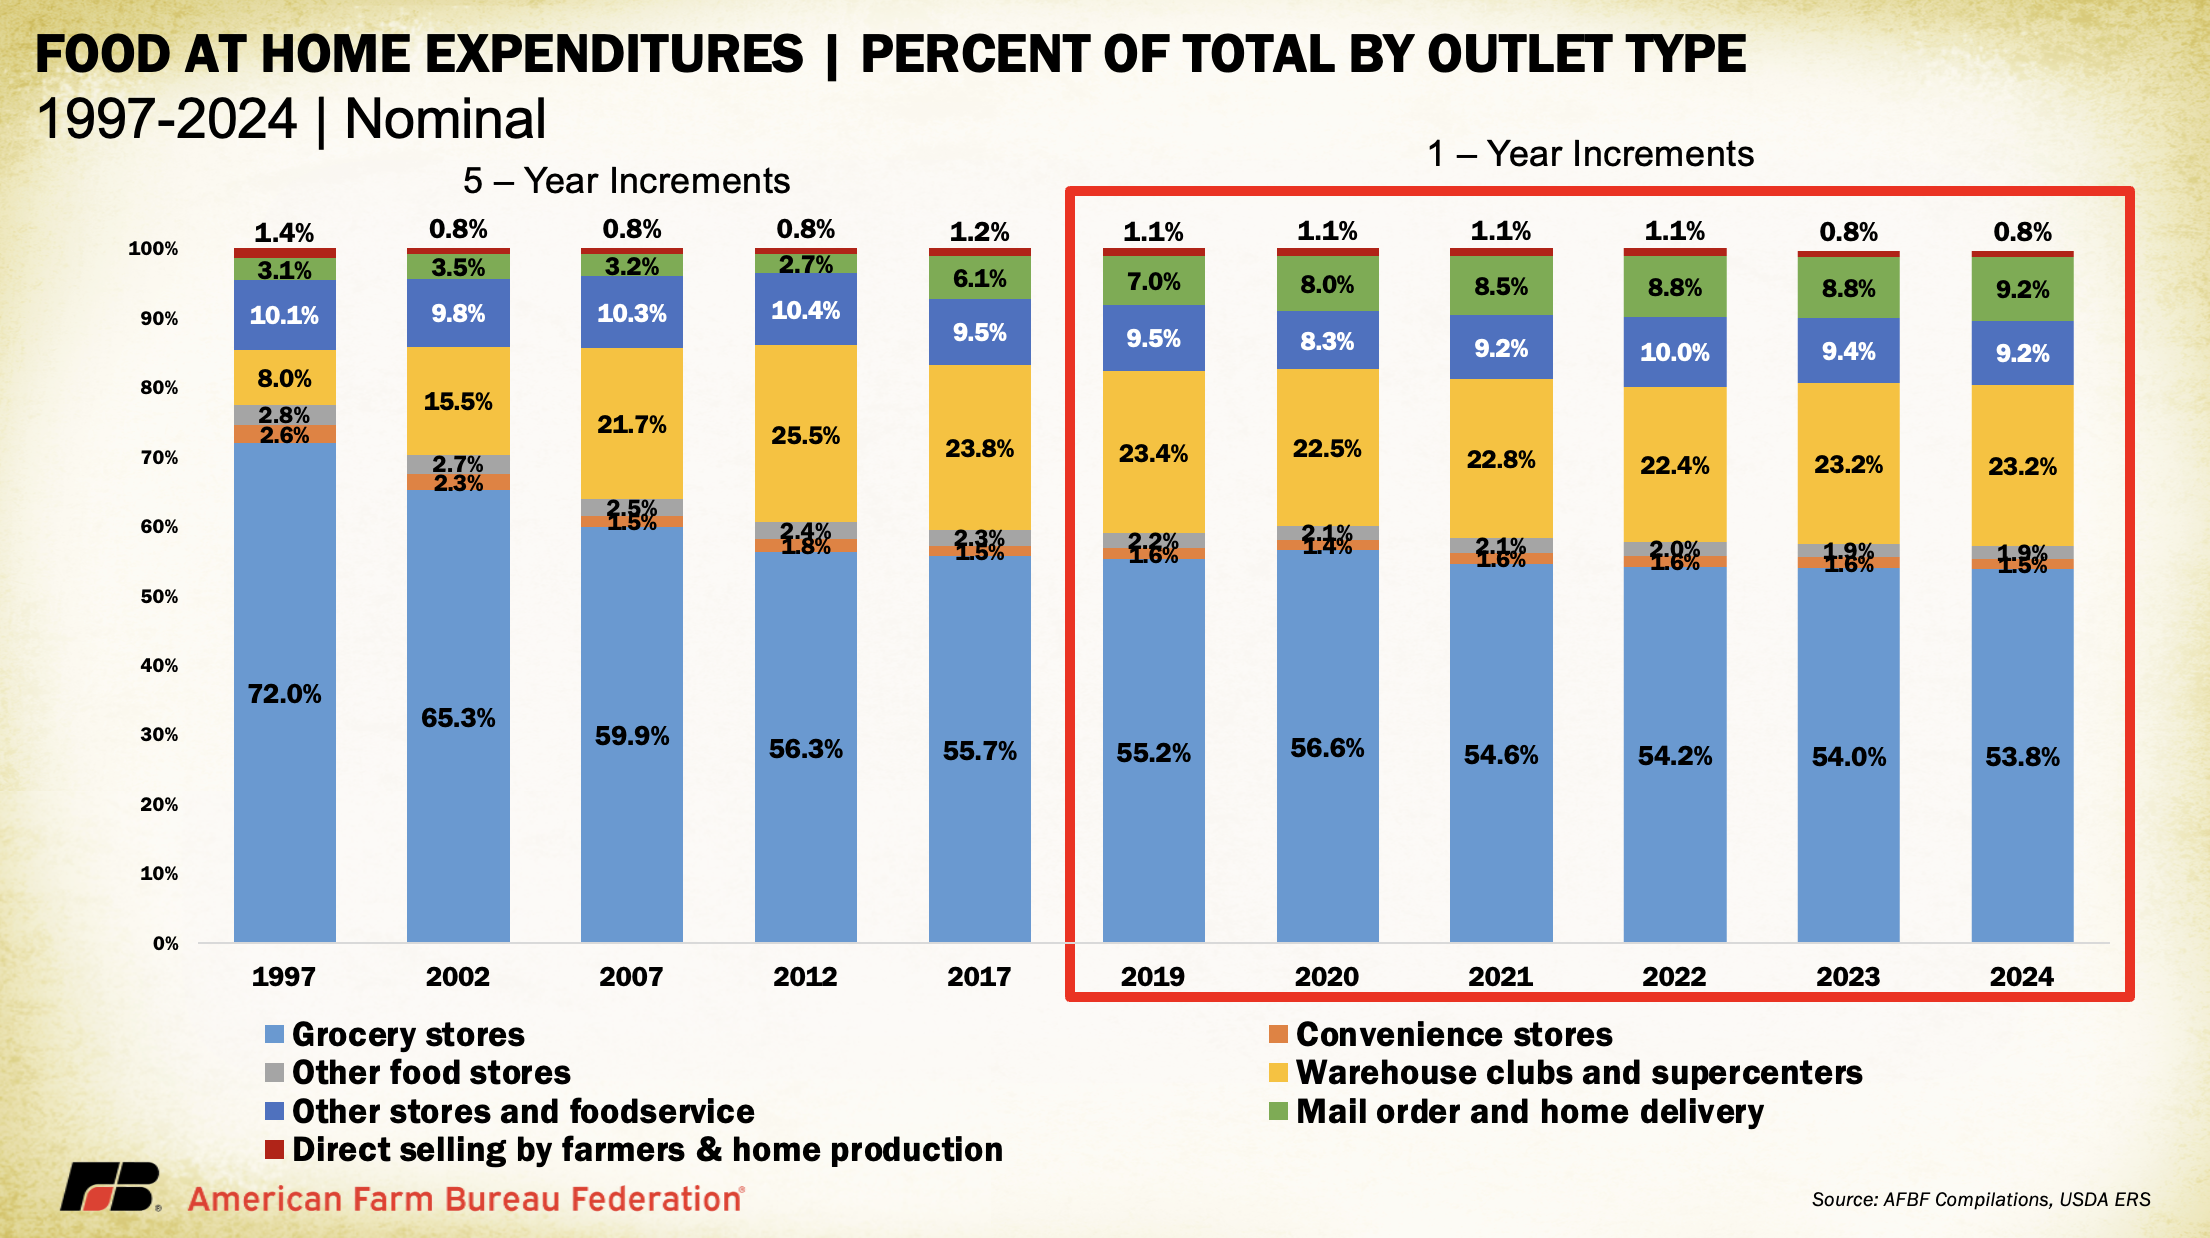
Grocery stores have long captured the largest share of food-at-home spending, though their dominance has steadily eroded. In 1997, they accounted for 72% of at-home expenditures, but by 2002 their share had slipped to 65%, falling below 60% in 2007 and landing at just 54% in 2024. The only temporary rebound came during the 2020 lockdowns, when consumers returned to grocery outlets in larger numbers. Much of the lost ground reflects the rise of warehouse clubs, supercenters and, more recently, home delivery.
Warehouse clubs and supercenters (including Costco and Sam’s Club) grew from 8% of at-home spending in 1997 to 25.5% in 2012, as bulk savings appealed to larger households. Their share has since eased to 23.2% as home delivery surges, rising from just 2.7% in 2012 to 9.2% in 2024. Spending on delivery topped $100 billion for the first time in 2024, fueled by demand for convenience, meal kits, prepared food services and online grocery platforms. By contrast, direct purchases from farmers, manufacturers, wholesalers and home production have remained a small, steady slice of the market, holding between 0.8% and 1.4% since 1997.
The dollar figures highlight just how dramatic these shifts have been. From 1997 to 2024, grocery store food expenditures rose from $270 billion to $587 billion — a 118% increase. Over the same period, spending at warehouse clubs and supercenters surged from $25 billion to $253 billion, a staggering 911% jump. Even more striking, food delivery expenditures skyrocketed 924%, climbing from $9.8 billion in 1997 to $100.5 billion in 2024. In today’s consumer landscape where convenience is king, delivery spending is poised to keep climbing, though any potential recessionary slowdown could nudge households back toward cost-saving choices. Emerging innovations in at-home food services may also reshape the trajectory of these trends.
Food Away from Home
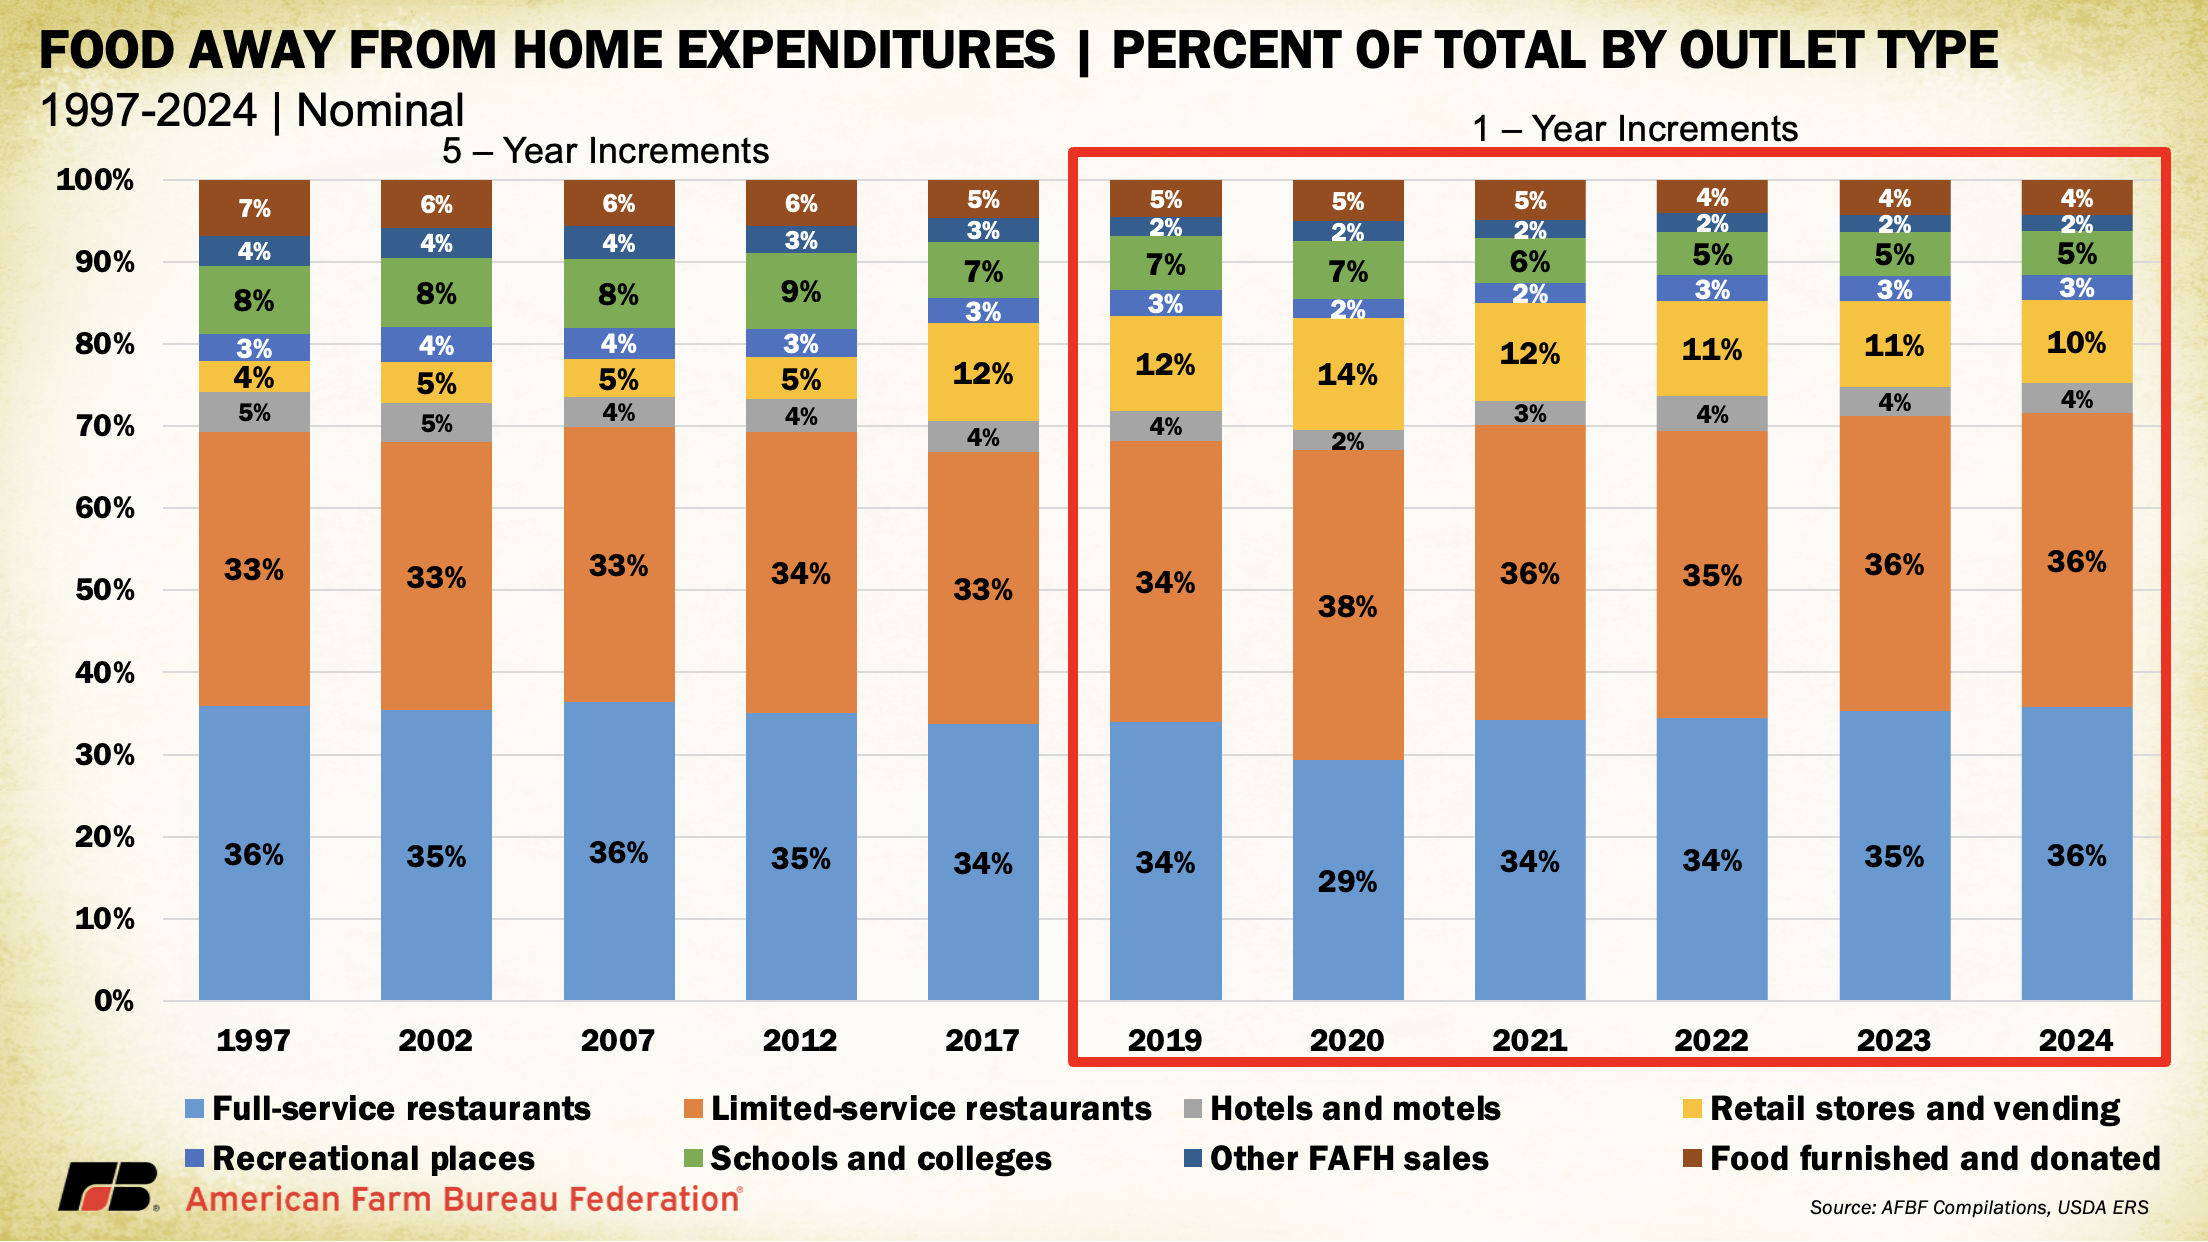
When it comes to food consumed away from home, limited-service and full-service restaurants have long competed for the largest share of spending. Limited-service outlets (where customers order and pay before receiving food, with little or no table service) include fast-food chains like McDonald’s, Taco Bell and Subway, as well as fast-casual concepts like Panera and Chipotle. Full-service restaurants, by contrast, provide the traditional sit-down experience with waitstaff, along with catering services. Between 1997 and 2024, each category captured an average of about 35% of away-from-home spending. The widest gap emerged during the pandemic: in 2020, limited-service restaurants held 38% of spending compared to just 29% for full-service. Their structural advantages including drive-through lanes, app-based ordering and pickup options made them far more resilient to lockdowns than sit-down establishments.
Other outlets have also gained ground. Food purchased in retail stores or from vending machines rose from just 4% of away-from-home expenditures in 1997 to a peak of 14% in 2020, settling at 10% in 2024. Retailers that once focused solely on merchandise have increasingly turned to in-store food service or take-away offerings, while technological advances have expanded the variety and freshness of vending options. Together, these shifts have carved out a meaningful niche in the away-from-home market.
In dollar terms, the transformation has been striking. Spending at full-service restaurants climbed from $120 billion in 1997 to $546 billion in 2024, a 353% increase. Limited-service restaurants grew even faster, from $112 billion to $548 billion — up 388%. Retail and vending surged the most, skyrocketing from $11 billion to $156 billion, a 1,270% increase. Today, the central question for consumers is whether the atmosphere of a full-service restaurant outweighs the convenience and cost savings of alternatives, a trade-off shaped increasingly by disposable income, digital ordering habits and the value people place on speed over experience.
Regional Considerations
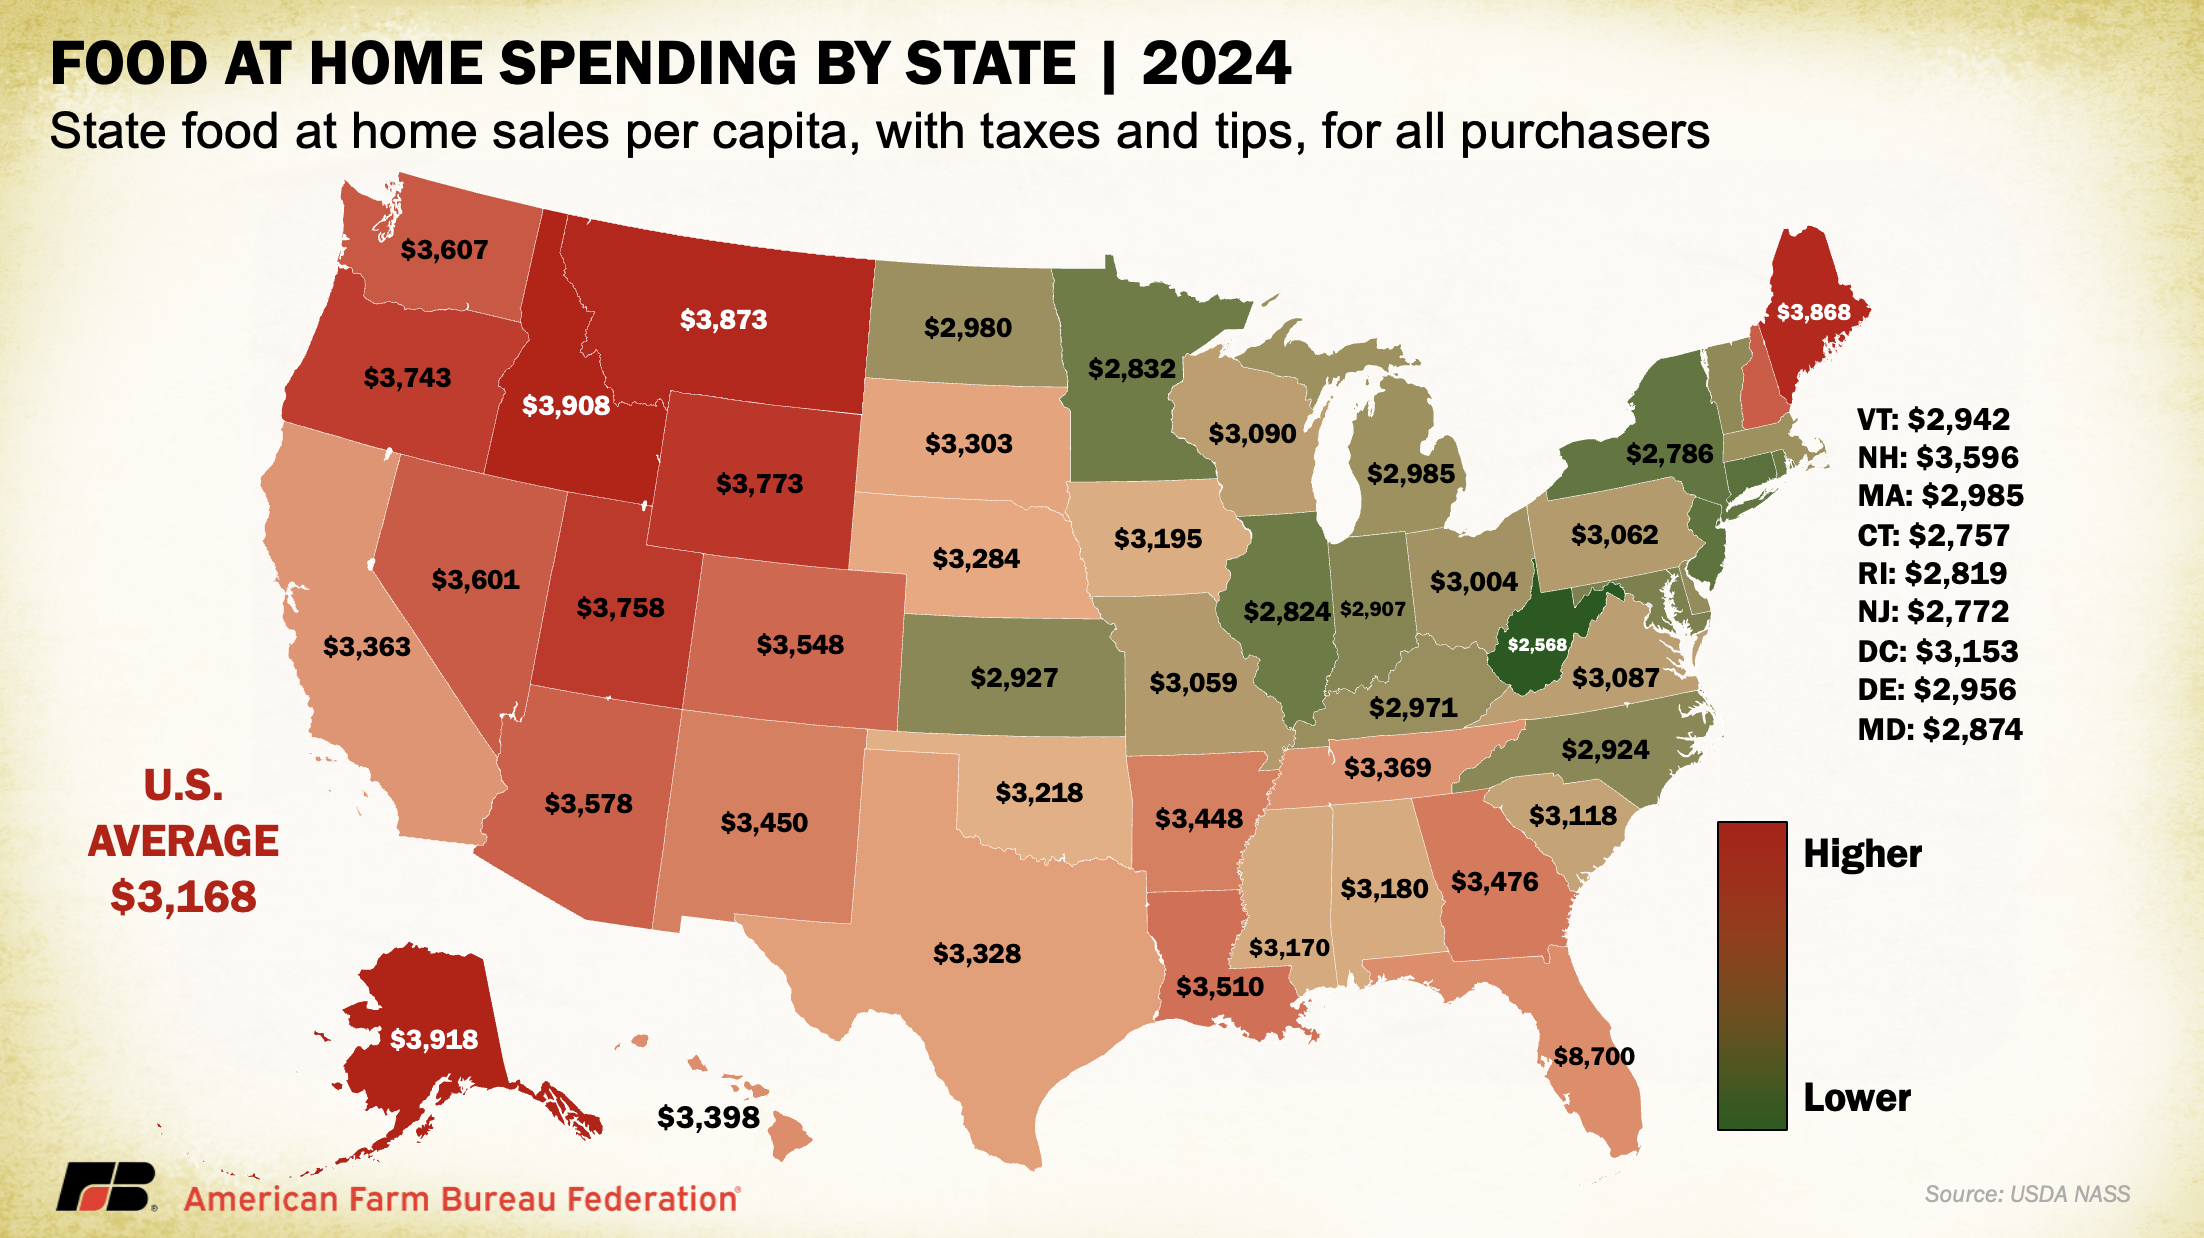
Food spending behavior also varies by state and region. Per capita food at home spending was highest in Alaska ($3,918), Idaho ($3,908), Montana ($3,873) and Maine ($3,773) and lowest in West Virginia ($2,568), Connecticut ($2,757) and New Jersey ($2,772). Much of this distribution reflects a mix of state-level food prices and cultural preferences around eating at home. In states like Alaska, Idaho, Montana and Maine, more rural lifestyles are likely to drive both higher prices and a greater reliance on home-prepared meals. On the other hand, states such as Connecticut and New Jersey rank near the bottom despite relatively high food prices, suggesting stronger preferences for dining out in densely populated, more urbanized areas. Likewise, New York and Illinois, despite comparatively high food costs, also rank in the bottom 10, reflecting the influence of large urban populations and strong preferences for dining away from home.
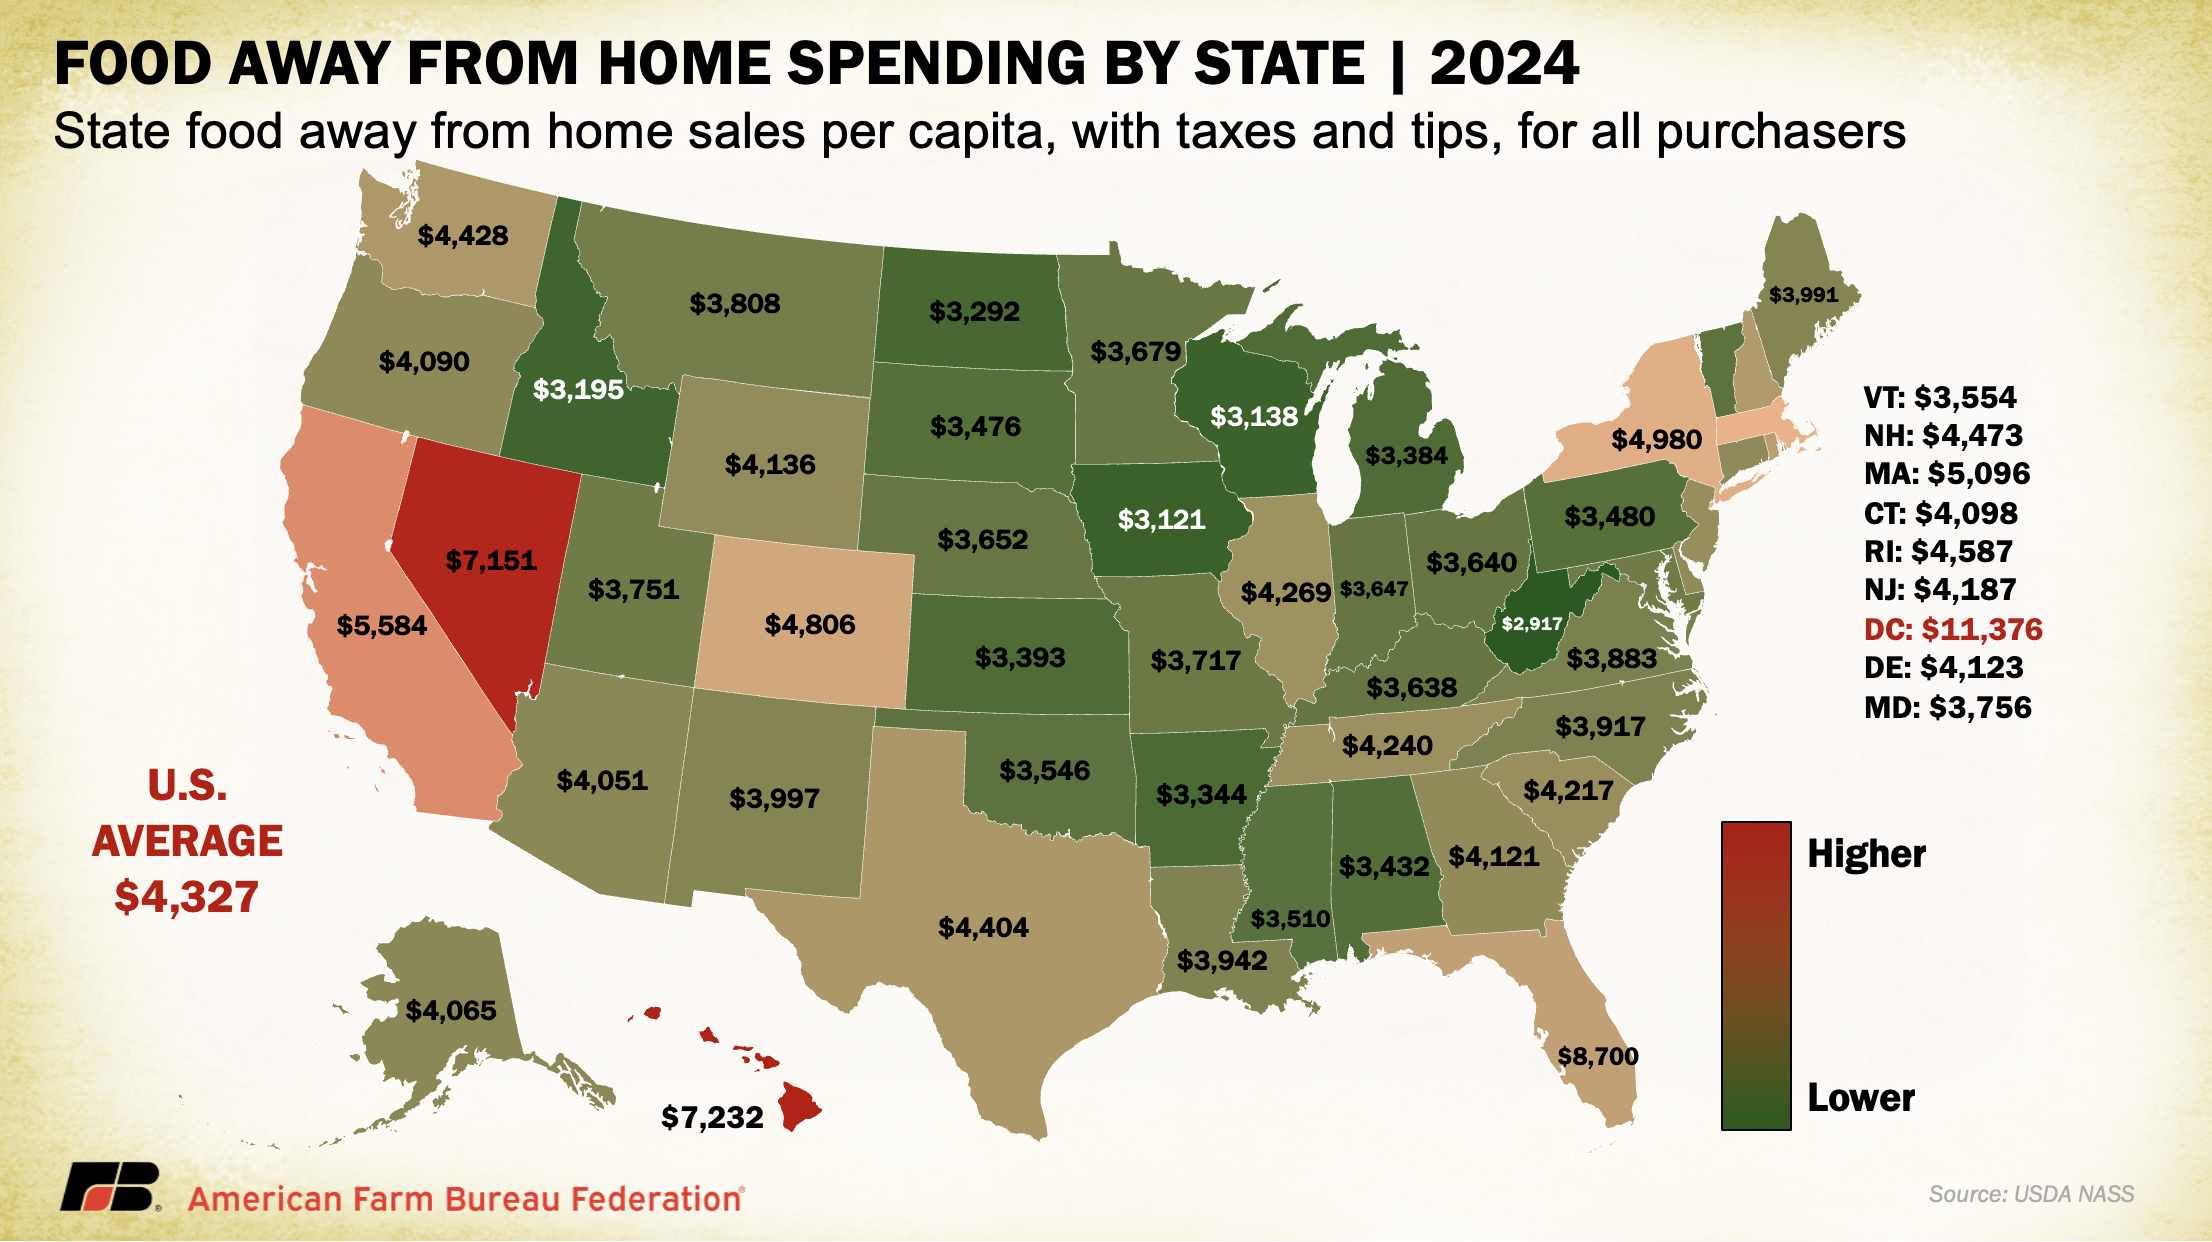
These hypotheses are further supported by distribution of away from home spending. Washington, D.C., ranks the highest in annual per capita spending on food consumed away from home (a whopping $11,376), followed by Hawaii ($7,232), Nevada ($7,151) and California ($5,584). The lowest away from home spending states were West Virginia ($2,917), Iowa ($3,121) and Wisconsin ($3,138). As with food-at-home expenditures, both regional food prices and broader economic activity shape these patterns. Nevada’s Las Vegas and Hawaii’s tourism industries heavily drive high away-from-home spending. By contrast, states like Iowa and West Virginia reflect more rural, cost-conscious populations with stronger cultural preferences for eating at home. These state and regional characteristics not only shape consumer behavior but also influence how food is marketed, distributed and priced, requiring producers and retailers to continually adapt their business strategies.
Conclusions
How and where Americans purchase food continues to reshape every link in the supply chain, from transportation and packaging to storage, processing and preparation. The 2024 data underscore a clear pattern: convenience and time savings remain the dominant forces in food consumption, fueling the rapid growth of delivery, takeout and quick-service outlets, while full-service restaurants compete by offering experiential value that justifies higher costs. Inflation, regional price differences and cultural preferences all add complexity, but disposable income and digital accessibility increasingly determine whether consumers choose to dine out, order in or cook at home.
On average, Americans spent 10.6% of their disposable personal income on food in 2024, one of the lowest shares in the world. This means that even though higher food prices put pressure on household budgets, U.S. consumers dedicate far less of their income to food than families abroad. That relative affordability is a defining feature of the American food system, and it helps explain why convenience and choice play such an outsized role in shaping demand. Looking ahead, further innovation in meal delivery, automation and retail diversification is likely to accelerate these shifts. For farmers and ranchers, staying aligned with evolving consumer behaviors will be critical to ensuring market access and capturing value in an increasingly competitive and dynamic food economy.
Top Issues
VIEW ALL