Interest Expenses Threatening Farm Financial Health

photo credit: AFBF Photo, Mike Tomko
Bernt Nelson
Economist
According to USDA’s 2017 Ag Census, about 97% of the United States’ 2.1 million farms are considered family farms and 88% of all U.S. farms have a gross cash farm income of less than $350,000 annually, putting them in the small family farm category. This means that most farms in the U.S. are small, family-owned businesses that rely on the availability of finance options to fund the high cost of producing the food, fiber and renewable energy our country and the world rely on every day.
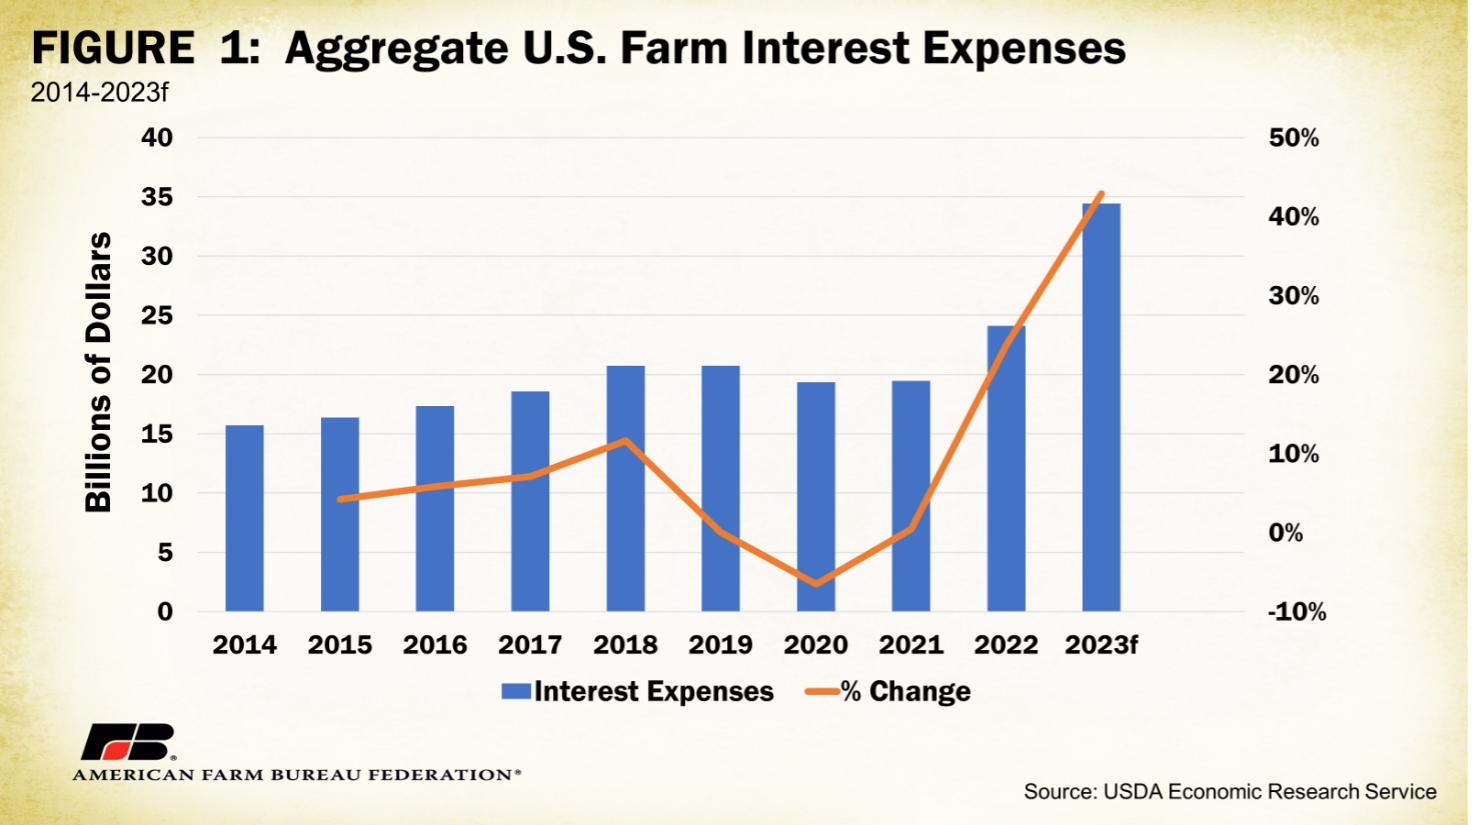
According to USDA’s most recent Farm Sector Income Forecast, interest as an expense increased by about 43%, or $10.3 billion, to $34.42 billion in 2023 (Figure 1). Interest rate hikes have not only increased the cost of credit as an input but have also limited farmers’ ability to use it. This Market Intel will give you a glimpse of farmers’ credit world and explain how changes in that environment could lead to challenges with liquidity, a problem that is hard to fix.
What is Liquidity and why is it Important?
An extremely important part of farm finances, farm liquidity is “the ability of a farmer to generate cash quickly and efficiently in order to meet his or her financial obligations.” Some assets, such as corn in storage, can be sold and turned into cash quickly and are considered assets with high liquidity. Others, such as a crop that was recently planted or livestock that have not yet been born, take more time to turn into cash and can require additional input expenses to become the final product for sale, such as grain or marketable livestock. When farms get tight on cash due to the high cost of operating or from overspending, lack of liquidity can become a real problem.
According to the 2023 Ag Lenders Survey conducted by the American Bankers Association in partnership with Farmer Mac, liquidity was farm lenders’ top concern in 2023 followed by farm income. Lenders listed rising interest rates as their number one reason for liquidity concerns.
How is Liquidity Measured?
Liquidity is measured using several different accounting ratios. Before diving into the different ratios, it is important to first understand working capital. Working capital is not a ratio, it is a measure in dollars of total assets minus total liabilities. This is a measure of available cash. When evaluating this measure, the question often asked is, “How much working capital does a farm need?” Working capital needs are highly variable by farm size, exposure to risk and volatility of the overall business environment. When net returns are more variable, more working capital is needed. Due to these differences, it is helpful to measure working capital by either gross revenue or value of farm production. More on this later.
One of the most used liquidity ratios is the current ratio. The current ratio (sometimes called the “working capital” ratio) measures a business’s or farm’s ability to pay off debt due within one year. It is the ratio of current assets divided by current liabilities (due within one year). A current ratio of 2 or higher is considered good. Anything below 2 is cause for concern.
The debt service ratio, sometimes called the term debt coverage ratio, measures a farm’s ability to use operating cash flow to pay debt obligations. Lenders typically like this ratio to be 1.5 or greater. A ratio of 1 would mean that the farm has adequate cash flow to meet payment obligations. A ratio less than 1 would mean the farm falls short and will have to rely on other resources to service debt.
As previously addressed, it is helpful to evaluate working capital needs in comparison to gross revenue or value of farm production. The working capital-gross revenue ratio is a measure of whether or not a farm has adequate working capital for its level of gross revenue. A farm with a ratio of 30% or greater is considered strong, 10%-30% is cause for concern, and a ratio less than 10% is considered vulnerable. For example, a farm that has a ratio under 10% will rely heavily on borrowed money to operate because they will run out of their own money early in the year. A farm with a ratio above 30% will rely on borrowed money, but not as heavily and not as quickly.
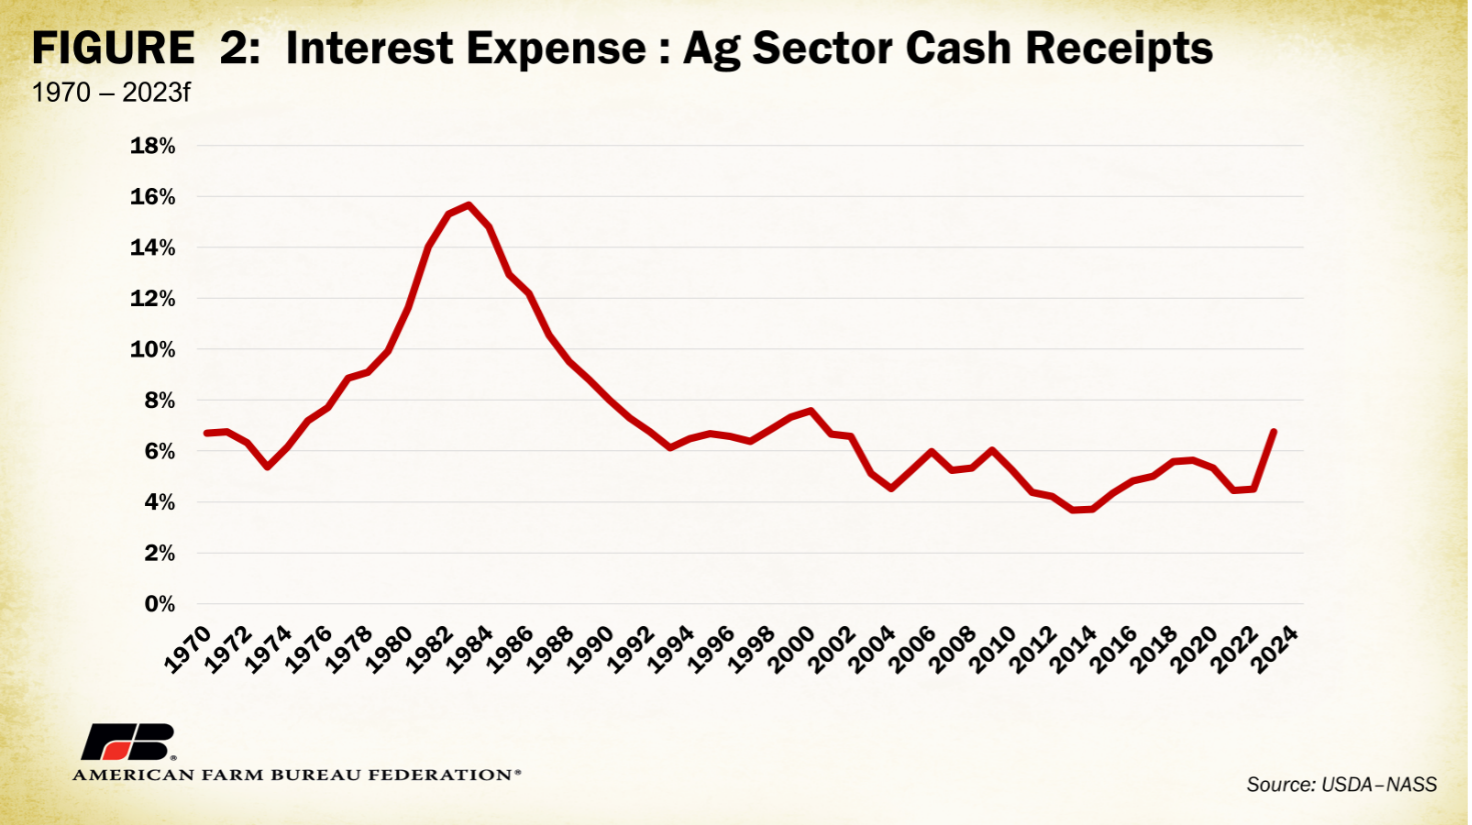
One ratio that has not been widely used since the ‘80s is the interest expense ratio. This ratio shows how much gross income is being used to pay interest on debt. In years when interest rates are low, this ratio may be overlooked as it remains well within healthy parameters. However, when interest rates go up, the interest expense ratio can be a stark reminder that taking on unnecessary debt or too much debt can be costly. When more capital is being used to pay for interest, it means less capital is being paid toward equity-building principal. Figure 2 illustrates the ratio of total U.S. ag sector interest expense to total U.S. ag sector cash receipts. Note the 2.25% increase in this ratio from 2022 to 2023, the largest year over year increase since 1981.
What are Some Common Liquidity Problems Farmers Face?
Farmers have many recurring annual costs such as land rent, input expenses and debt payments. A farm with strong liquidity has cash available to pay these recurring costs and potentially pay for growth such as new land or equipment purchases.
Problems with liquidity can arise from changes in the financial environment. For example, when costs of inputs such as fertilizer, seed and fuel go up, it takes a greater amount of working capital to pay for them. This means working capital is depleted faster, potentially limiting a farmer’s ability to meet cash flow needs. When working capital is depleted, farmers have a variety of options to help liquidity. Selling cash assets such as crops in storage may be an option but may be costly if market conditions are not favorable. One of the most common solutions to liquidity is through a variety of credit-based solutions such as operating loans, which will be addressed in more detail later in this article. While credit-type solutions can be a great option, they can be expensive and endanger the long-term sustainability of a farm if relied on too heavily when interest rates are high. Liquidity problems of this nature can turn into a cycle that is increasingly hard to break for the farmer.
What does U.S. farm sector debt and liquidity look like?
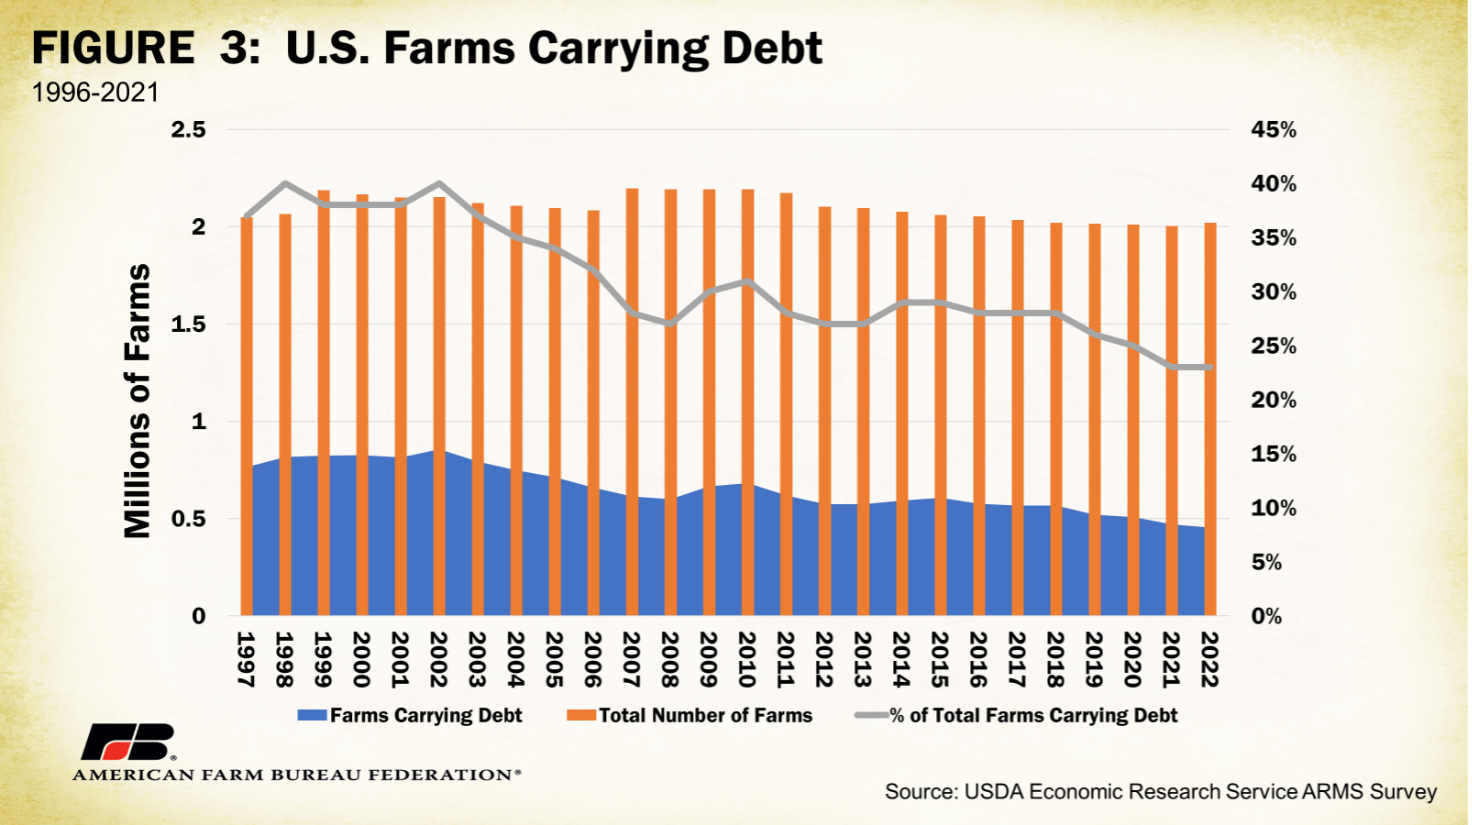
U.S. farm sector liquidity has been good and strengthening since 2020. However, the recent drop in ad hoc government assistance combined with Federal Reserve-driven interest rate hikes and increasing operating costs have changed the financial environment. According to USDA-Economic Research Service’s Agricultural Resource Management Survey, approximately 23% of U.S. farms carried some form of debt in 2022, down 4% from 28% in 2018 (Figure 3 ). While this data provides a general feel for farms carrying debt through 2022, it does not capture which farms are carrying debt. So even though the percentage of farms carrying debt has come down, it is not necessarily an indication of a healthier farm economy.
[1] U.S. Farm Sector Financial Ratios are calculated using national aggregate data, which is different than national average data. The data used in these calculations comes from farms that carry debt. However, not all farms carry debt so it’s not fair to say these liquidity ratios are a measure of the average U.S. farm.
Recall from earlier in the article, a good current ratio is above 2. According to the U.S. Farm Sector Financial Ratios published by ERS, the U.S. ag sector had a current ratio below 2 from 2015-2021. This ratio has remained above 2 since 2021 but is forecast to fall from 2.15 in 2022 to 2.09 for 2023, just above the threshold for caution.
The debt servicing ratio used by ERS is a modified version of the term debt coverage ratio. USDA uses this ratio to measure the share of production plus direct government payments that are used to pay off farm sector debt. A higher debt servicing ratio implies that a greater share of production is needed to pay off debts, and thus less liquidity in the farm sector. ERS forecasts the ratio to rise from .21 in 2022 to .24 in 2023. Higher cost of debt from sustained elevated interest rates could lead to continued debt servicing ratio growth in 2024. For comparison, the debt service ratio reached a record level of .46 in 1983. This means that 46% of all farm sector production and government subsidies were used to pay for farm debt.
What are Some Tools Farmers Have That Assist with Liquidity Problems?
Management – One of a farmer’s greatest financial resources can be their lender. Loan officers are more than just a face at a lending institution. They become friends and advisors, in addition to financial service providers. Helping farmers avoid problems with liquidity is typically in the lender’s best interest as well as the farmer’s, so it’s important they work together. When problems come up with liquidity, operating loans can be a go-to solution. Operating loans can be refinanced to adjust for operating cash needs. However, it is important to note that refinancing costs money in the long run, and every time a refinance occurs, there are fewer options available the next time around. Refinances can become a danger zone if used improperly. This is why the relationship between a farmer and their lender is so important.
Farm operating loans and revolving lines of credit are an essential tool to help farmers manage day-to-day expenses. They are available through federal programs such as USDA-Farm Service Agency’s Direct Farm Operating Loans or through commercial ag lenders. These loans are designed to provide financing for the cost of operating a farm and can help provide much-needed liquidity when capital gets tight. Operating loans can be used for a variety of purposes including supply costs, repairs, land development, and livestock and equipment purchases. The terms of repayment vary but operating loans are typically renewed on an annual basis.
FSA’s commodity loans such as marketing assistance loans (MALs) and loan deficiency payments (LDPs), can help mitigate liquidity problems. Both of these tools can offer financial support to farmers at and after harvest.
MAL
An MAL is a nine-month loan that provides producers with interim financing at the time of harvest to meet cash flow needs without having to sell their commodity under current market conditions. There are two types of loans, recourse and non-recourse. During the life of the loan, farmers are allowed to store the covered commodity so they can sell it when market conditions (hopefully) improve. Under non-recourse loans, USDA must accept the commodity, pledged as collateral, as payment. A recourse loan must be repaid in full as principal and interest. These loans are valued using county-level, commodity-specific loan rates established by the 2018 farm bill. For non-recourse loans, if local prices rise above the loan rate, the farmer may repay the loan and keep the pledged commodity. If local prices fall below the loan rate, the farmer can repay the loan at the lower market price or surrender the pledged commodity in lieu of repayment. The farmer would then receive the difference between the lower market price and the MAL loan rate.
LDP
LDP provisions specify that a farmer, though eligible for a non-recourse MAL, may choose to receive an LDP instead. The payment is equal to the LDP rate times the quantity that is eligible for a loan. An LDP payment is triggered when the posted county price drops below the county loan rate. An LDP is the difference the producer would have received if a loan was repaid at the lower market price, a direct benefit that does not need to be repaid. The farmer may then store or market the covered crop however they choose.
Term Loans
One more solution available for farmers when capital is depleted and liquidity is an issue is a term loan. Agricultural term loans are long-term loans that are used to finance investments and operations. These loans are collateralized and are different than an annually renewed operating loan. Using a term loan for short-term needs is often a last resort because it is expensive when interest rates are at decade highs and is not an indicator of good financial health.
Summary and Conclusions
While ag sector liquidity has been strong in recent years, the financial environment has changed and high interest rates are adding another expense to farmers’ lists of rising input costs. Operating loans and other forms of financing cost farmers a whopping 43% more in 2023 than in 2022 and are forecast to remain elevated for much of 2024, causing working capital (cash) stocks to decline faster and forcing farmers to lean on expensive credit to provide liquidity. When farmers pay more for interest on that credit, less money gets paid toward principal. The amount of income being used to pay interest on farm debt in the U.S. has increased at a rate not seen since the 1980s. There are many tools available to help farmers persevere when liquidity makes their business vulnerable, but it’s important for decision makers to remember a lesson from the 80’s. Short-term borrowing during times of vulnerability can turn into costly long-term debt. Excellent management and decision making are a must to remain resilient during times of vulnerability.
Top Issues
VIEW ALL