WASDE: Robust Crops, High Input Costs, Strained Margins
TOPICS
WASDE
Faith Parum, Ph.D.
Economist
USDA’s August World Agricultural Supply and Demand Estimates (WASDE) report incorporates the first field-based yield projections for the 2025/26 crop year. Updated forecasts for row crops adjust production and stock levels that will influence prices heading into harvest. Meanwhile, USDA’s latest Farm Production Expenditures report shows near-record costs for farmers, underscoring the challenge of maintaining margins in today’s uncertain market conditions.
August WASDE Highlights
USDA’s August WASDE sets the stage for fall markets by including actual field data.
Corn
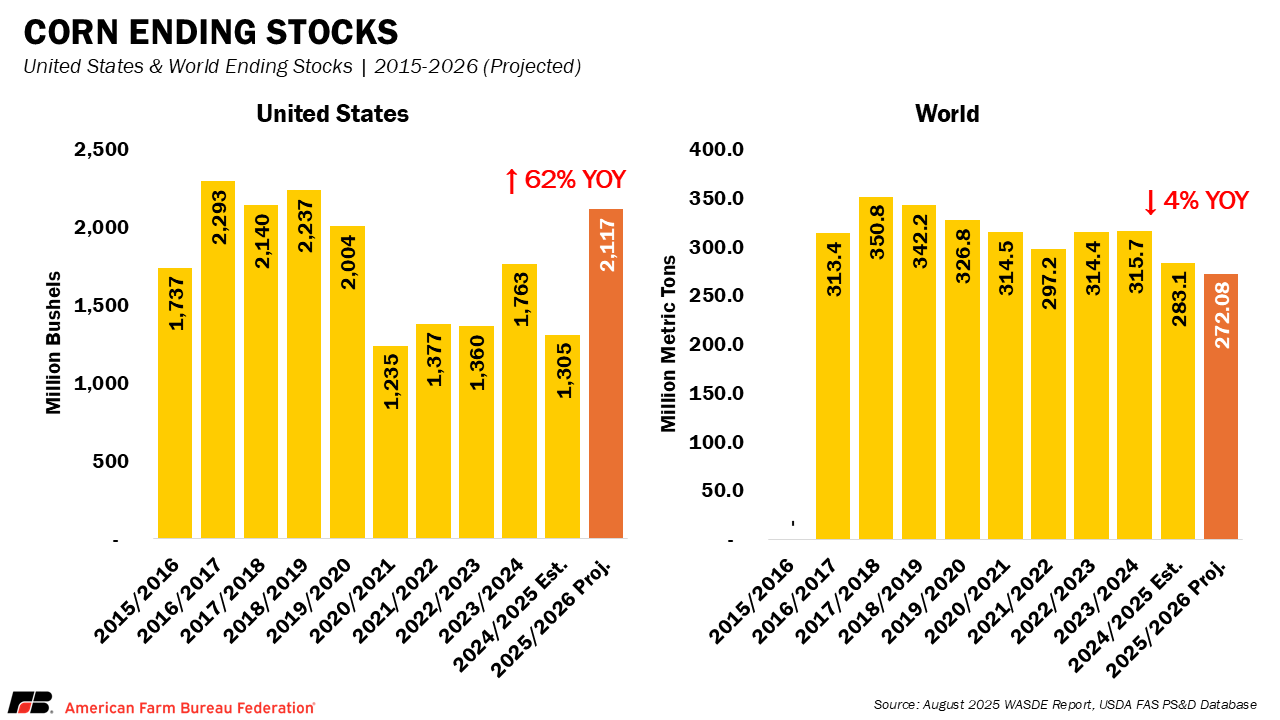
Corn yields are projected at 188.8 bushels per acre, up 7.8 bushels (4%) from last month’s estimate. If realized, this would be a record yield coupled with record acreage after a 1.9-million-acre increase in harvested area from last month. This would bring projected 2025/26 production to 16.7 billion bushels, 1 billion more than last month’s forecast and 1.4 billion above the previous record set in 2023/24. USDA raised 2025/26 total corn use by 545 million bushels from last month, including a 250-million-bushel increase in feed and residual use, 100 million more for ethanol and a record 2.9 billion bushels projected for exports.
Even with higher use, supply growth outpaces demand, pushing ending stocks up to 457 million bushels from last month to 2.1 billion bushels, the highest since 2018/19 and about 60% above the 1.34 billion carried into 2024/25. The season-average price is lowered 30 cents from last month to $3.90 per bushel, reflecting the pressure of a record crop and expectations for relatively low global prices. Following the release of the report today, the December 2025 corn futures contract fell 13 cents to $3.94, which marks the first close below $4 for any 2025 corn contract other than September.
Soybeans
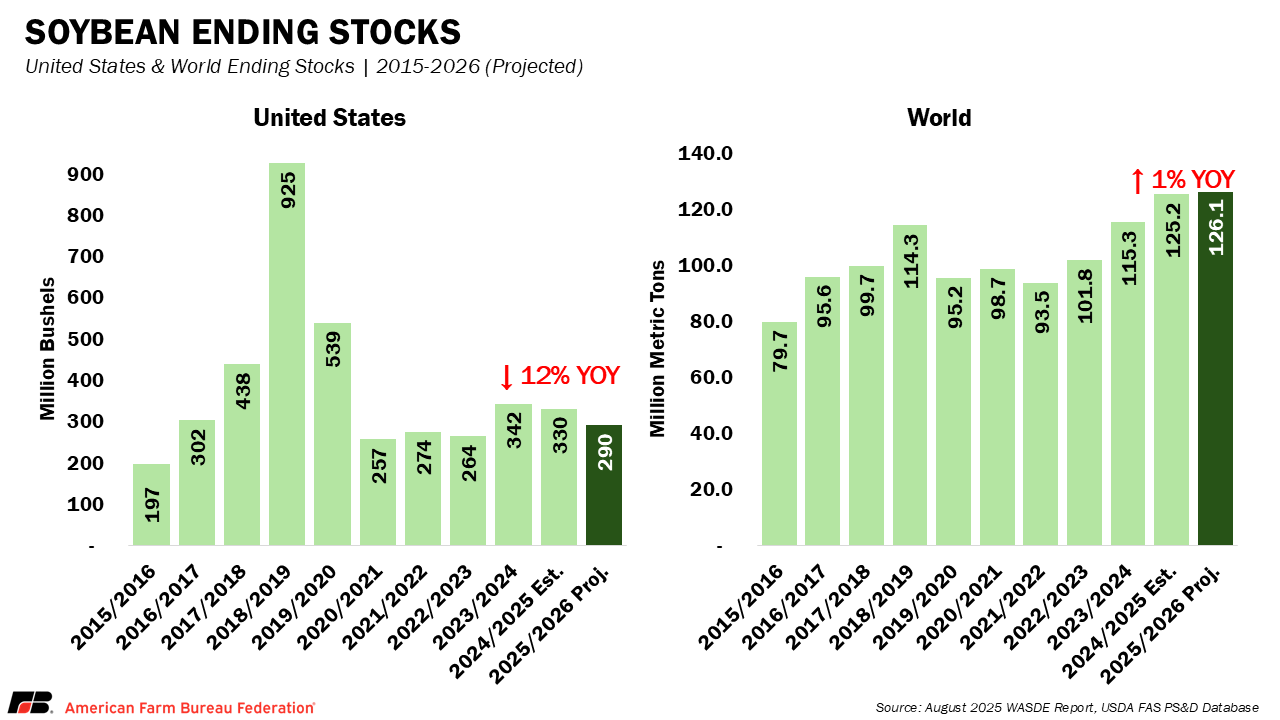
Soybean yields are projected at 53.6 bushels per acre, up 1.1 bushels from last month’s estimate, but harvested area is down 2.4 million acres from last month to 80.1 million. This results in 2025/26 production of 4.3 billion bushels, down 43 million bushels from the July estimate and 290 million bushels below last year’s 4.36 billion. Beginning stocks are lowered by 20 million bushels from last month due to higher crush volumes and exports in 2024/25.
With lower supply and slow early-season export sales, USDA reduced export projections by 40 million bushels to 1.7 billion. Crush remains unchanged at 2.54 billion bushels. Ending stocks are projected at 290 million bushels, down 20 million from last month and 40 million below the 330 million carried into 2024/25. The season-average price is unchanged from last month at $10.10 per bushel. The November soybean futures contract responded positively, closing up 21 cents at $10.32 following the report.
Wheat
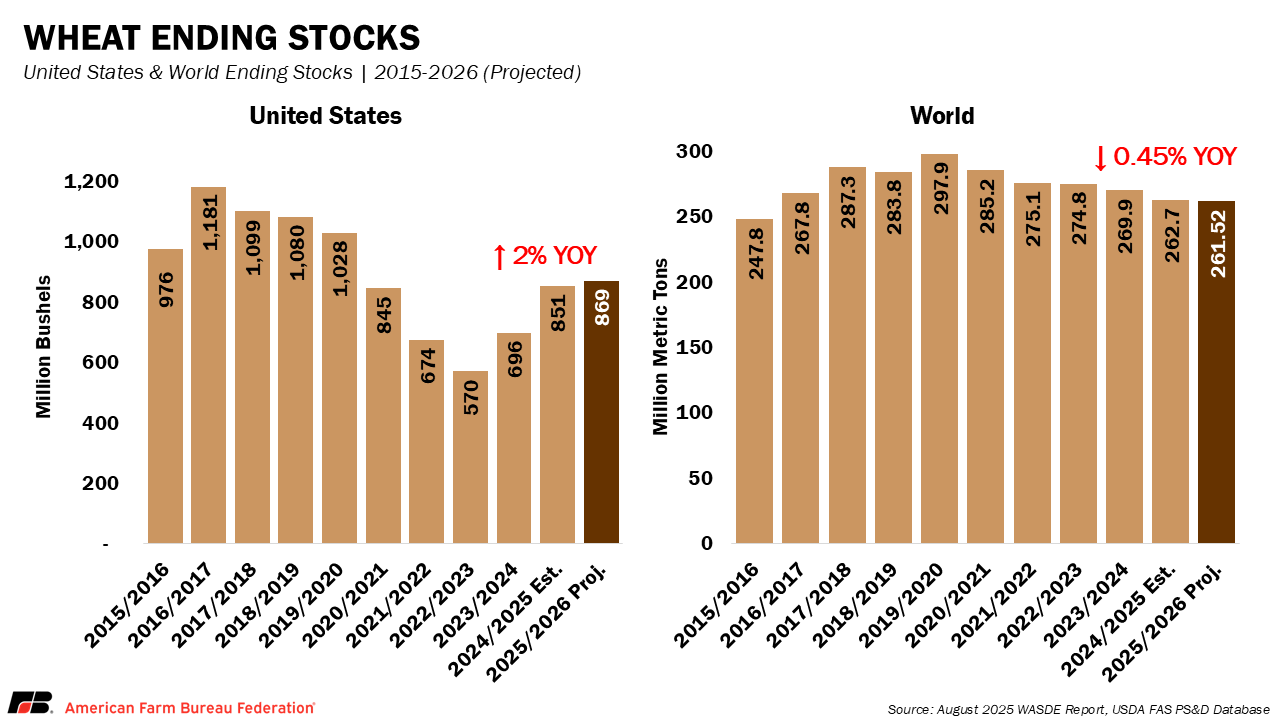
Wheat yields are projected to be 52.7 bushels per acre, up 0.1 bushels from last month’s estimate. Production is forecasted at 1.93 billion bushels, down 2 million from last month because of lowered harvested area. USDA lowered total domestic use by 5 million bushels from last month, driven mainly by reduced food use, while still raising exports 25 million bushels to 875 million, reflecting strong early-season sales and shipments. Ending stocks are projected at 869 million bushels, down 21 million from last month’s estimate but still above the 851 million carried into 2024/25. The season-average farm price is lowered 10 cents from last month to $5.30 per bushel. Futures responded with all Chicago wheat contracts posting new record-low closing prices.
Other Crops
Outside of corn, soybeans and wheat, USDA’s August outlook shows mixed results across other commodities. Rice production is forecast at 208.5 million cwt, raised by an expanded harvested area, with increased domestic use and exports trimming ending stocks to 44.6 million cwt. This increased the rice farm price to $14.20/cwt. Cotton output is projected at 13.2 million bales, down sharply from July and last year as Southeastern states see lower output, lowering ending stocks to 3.6 million bales and lifting the price to 64 cents per pound. Sugar supplies are higher from increased sugar beet production and larger beginning stocks, pushing the stocks-to-use ratio to 17.75%.
Production Expenses and Margins
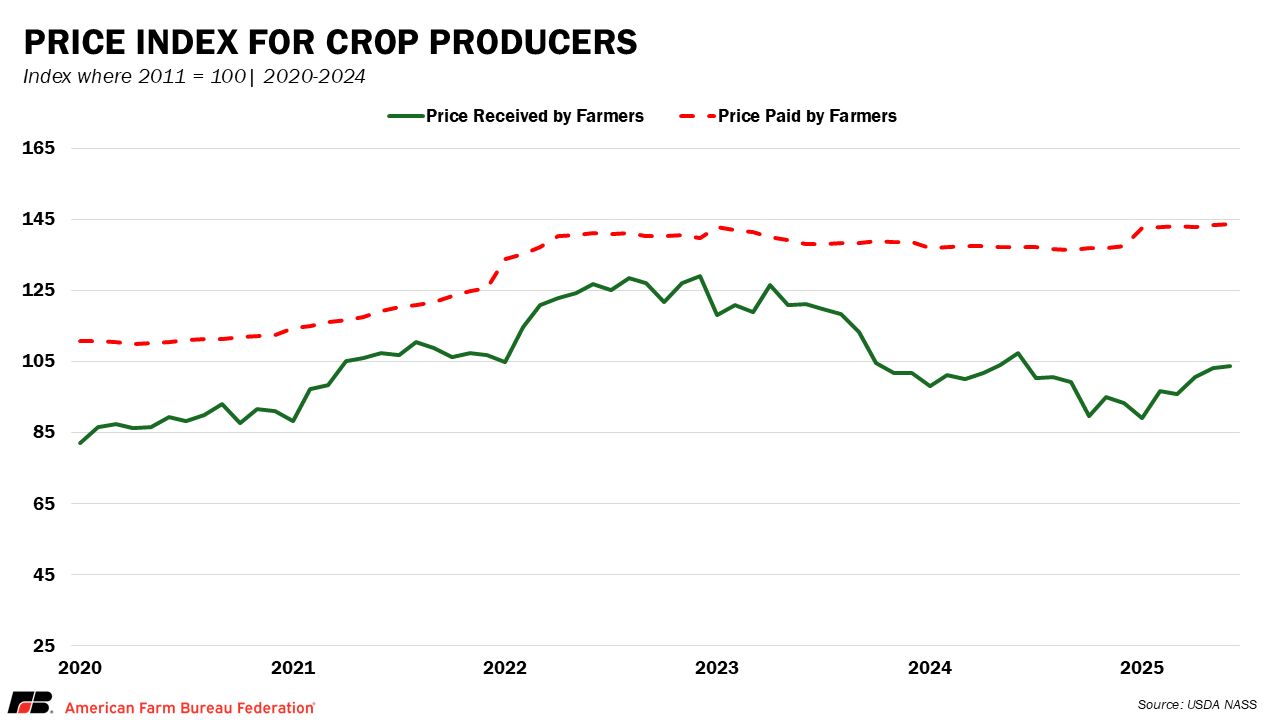
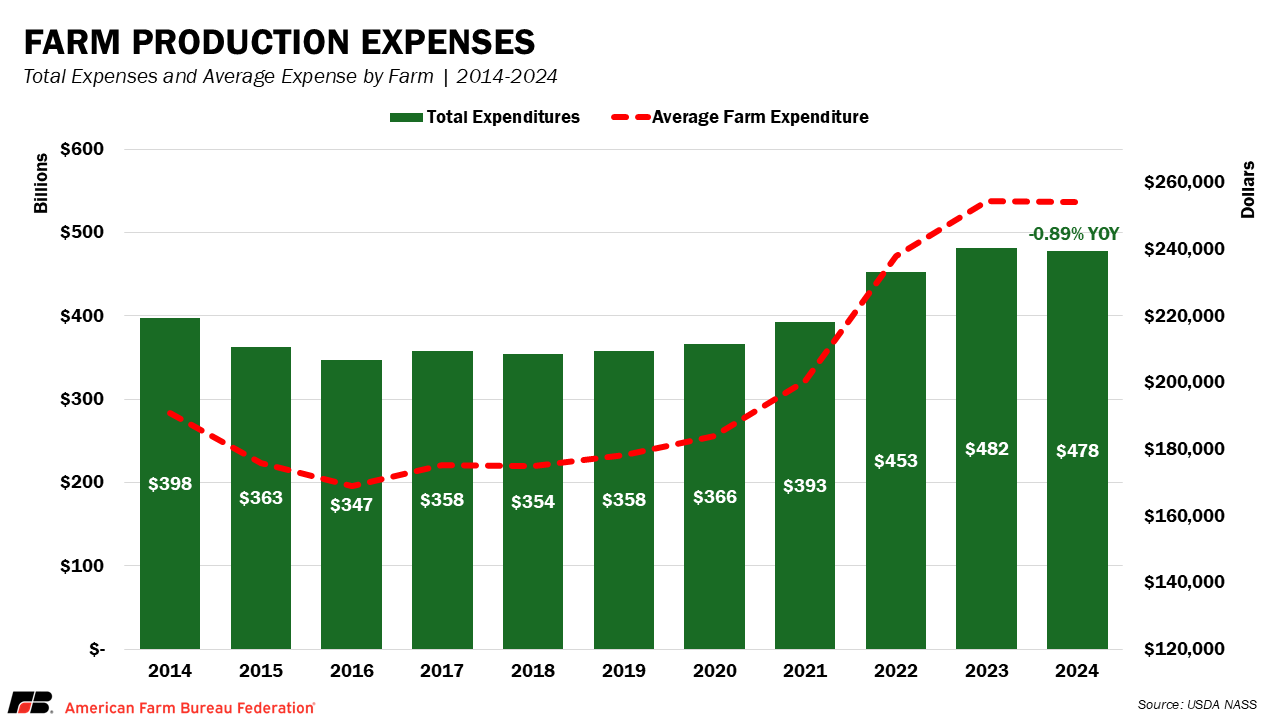
Margins remain tight as USDA’s August WASDE lowers prices for key crops. USDA’s Prices Received Index for crops in June 2025, which measures the average prices farmers receive for their products, was 9.2% higher than a year earlier. However, the Prices Paid Index, which measures the average prices farmers pay for goods and services such as feed, seed, fertilizer and fuel, also rose 7.1%. Despite the increase in prices received, there remains a significant gap between what farmers earn and what they pay for inputs. Combined with USDA’s Farm Production Expenditures report showing $477.5 billion in costs for 2024, elevated inputs and volatile markets are keeping break-even levels near or above current prices for many producers. Persistent trade uncertainty further clouds the outlook, especially for soybeans, where export projections have been reduced.
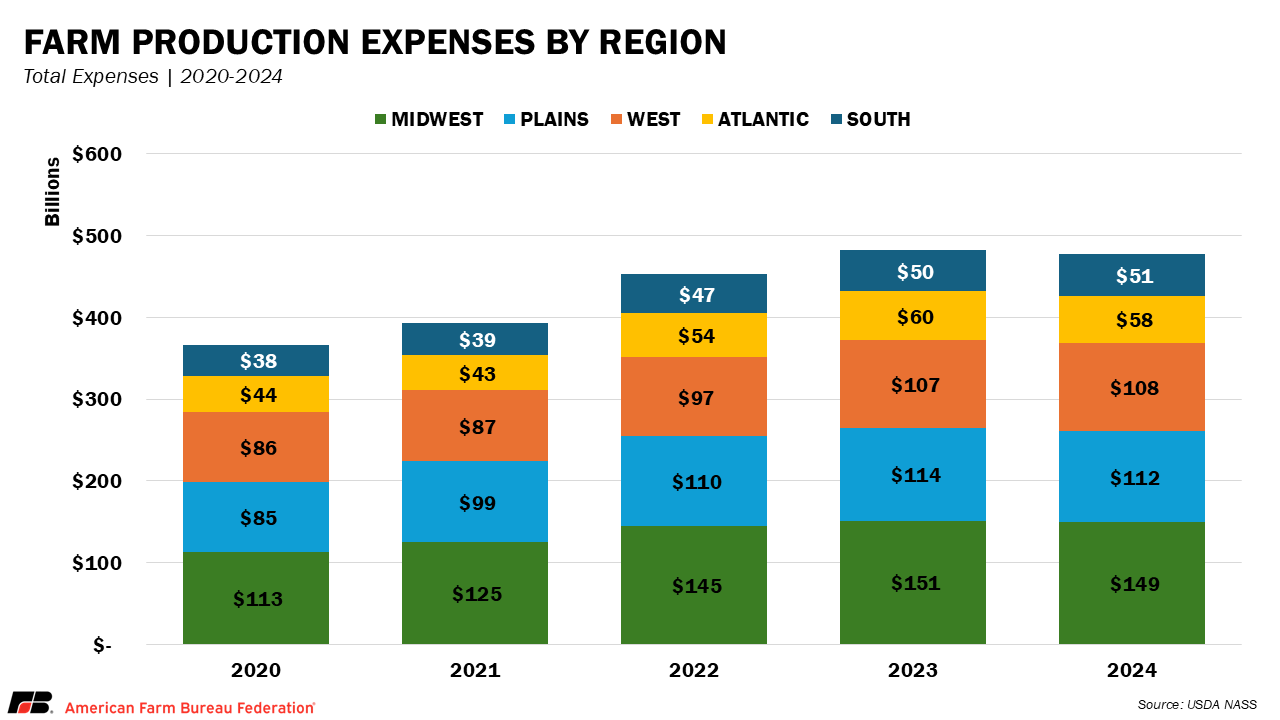
USDA’s Farm Production Expenditures 2024 Summary estimates total U.S. farm production expenses at $477.6 billion, down 0.89% from the record $481.9 billion in 2023. This marks the first year-over-year decline since 2018, though costs remain near 2023’s historic highs and are still more than 30% higher than just five years ago. Regionally, the Midwest had the highest farm expenses at $149.1 billion (31.2% of the national total), followed by the Plains ($111.6 billion, 23.3%), West ($107.5 billion, 22.5%), Atlantic ($58.3 billion,12.2%) and South ($51 billion, 10.7%). California led all states with $48.6 billion in expenses, reflecting the high costs of specialty crop production, including labor-intensive harvests and extensive irrigation infrastructure. Iowa ($35.8 billion), Nebraska ($30.4 billion) and Texas ($26.5 billion) rounded out the top four, each influenced by input-intensive crop and livestock sectors.
Conclusion
The August WASDE and USDA’s latest Farm Production Expenditures report paint a picture of a mixed but challenging outlook for U.S. agriculture. Production forecasts for major crops point to generally ample supplies, which will continue to pressure prices as inflated input prices further tighten margins. On top of this, global market uncertainty adds to the pressure. New investments in the farm safety net under the One Big Beautiful Bill Act and recent disaster assistance provide short-term support, but market challenges will continue to test the limits of farmers’ profitability. Together, these factors will shape the financial outlook for farmers and ranchers as they make decisions for the seasons ahead.
Top Issues
VIEW ALL