Land Values and Cash Rents Falling in Some Areas

photo credit: AFBF Photo, Mike Tomko
John Newton, Ph.D.
Vice President of Public Policy and Economic Analysis
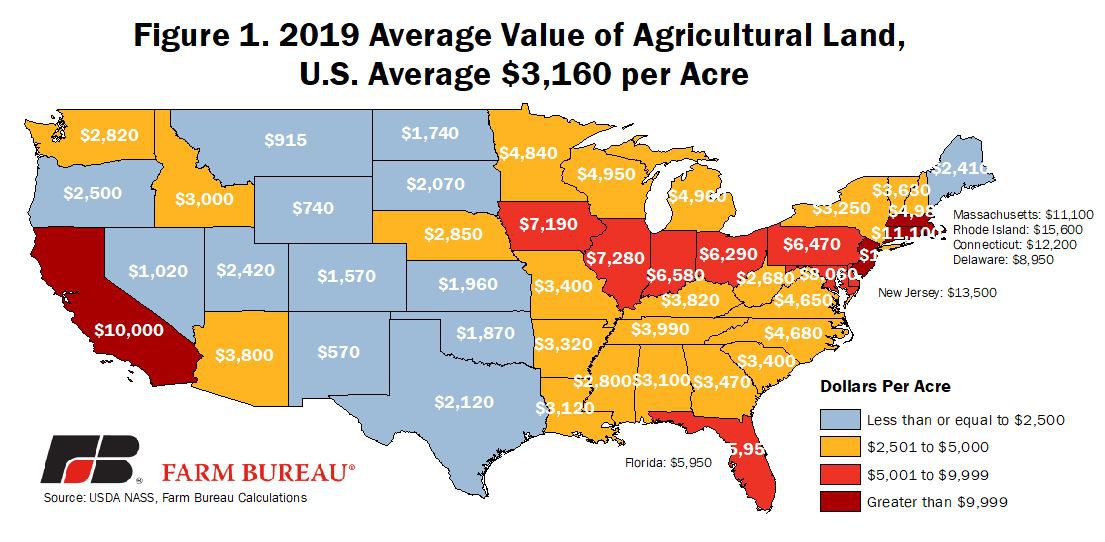
USDA’s recent 2019 Land Values report revealed the average value of agricultural cropland, including buildings on farms, at $4,100 per acre in 2019, up $50 per acre or 1.2% from the previous year. The value of cropland in 2019 ties the record-high reached in 2015 and represents a 55% increase in cropland values over the last decade. The average value of pastureland was a record-high $1,400 per acre in 2019, up $30 per acre or 2.2% from the prior year. The average value of all agricultural land was $3,160 per acre in 2019, up $60 per acre or 1.9% from 2018.
State-Level Agricultural Land Values
Across the U.S., agricultural land values were the highest in states near urban areas such as Rhode Island, Connecticut, New Jersey, Massachusetts and California. Outside of urban areas, agricultural land values were highest through the Corn Belt, the Great Lakes region, the Southeast and the Pacific Northwest. Western states, reflecting the higher percentage of pastureland, had lower average agricultural land values. Figure 1 highlights the average agricultural land value per acre in 2019.
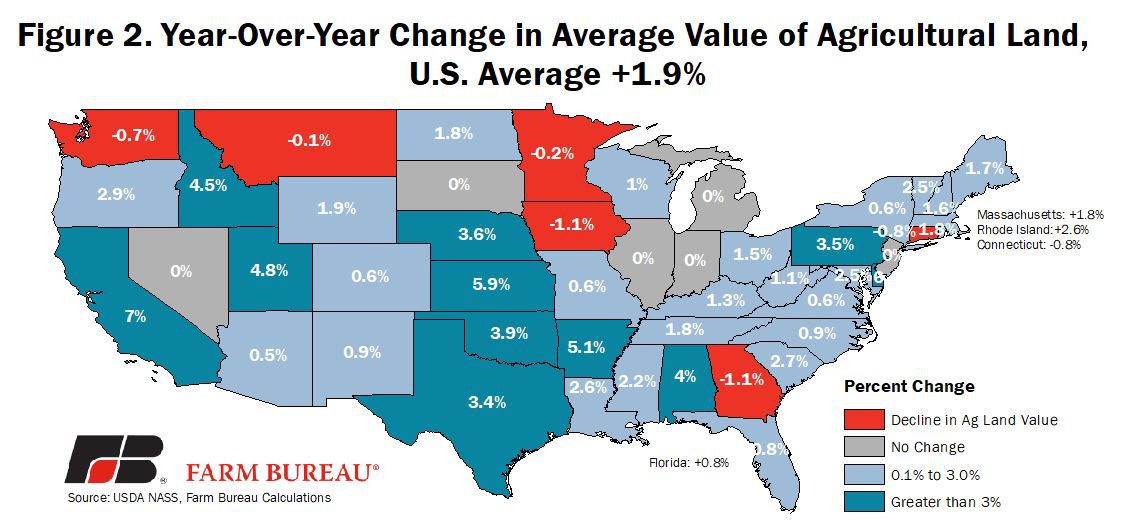
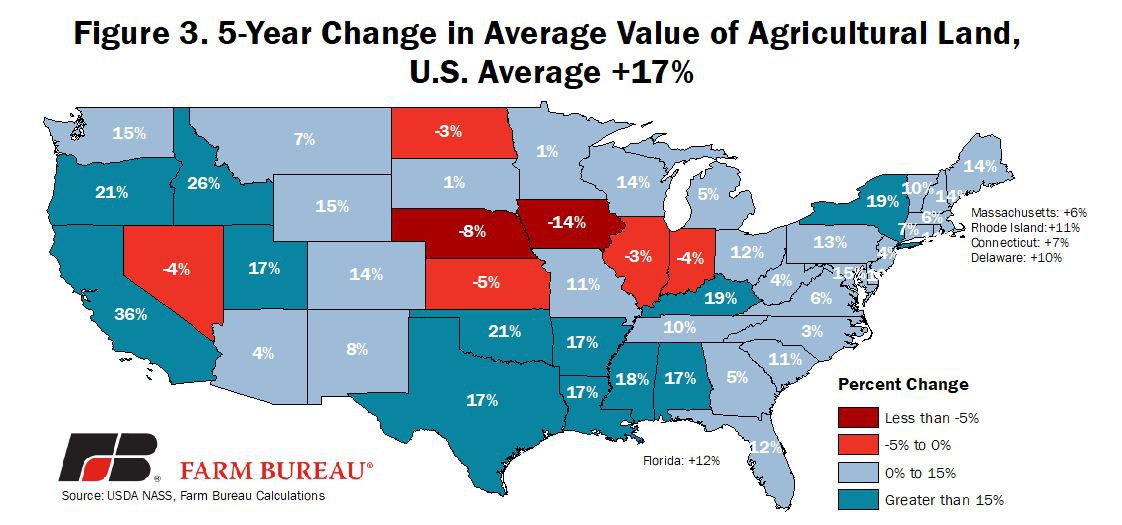
California saw the largest increase in agricultural land values in 2019, jumping 7% or $650 per acre from 2018. Delaware saw agricultural land values increase more than 6%, representing a $540 per acre increase from 2018. In several states, however, agricultural land values decreased, most notably in Iowa where land values decline by 1.1% from the previous year – marking the fifth consecutive year that land values in Iowa have declined. Average land values in Iowa have dropped 14% since 2014. In fact, over the last five years, Iowa has seen the steepest decline in agricultural land values – dropping $1,130 per acre or 14%. Figures 2 and 3 identify the year-over-year change in agricultural land values and the 5-year change in land values, respectively.
Cash Rental Rates
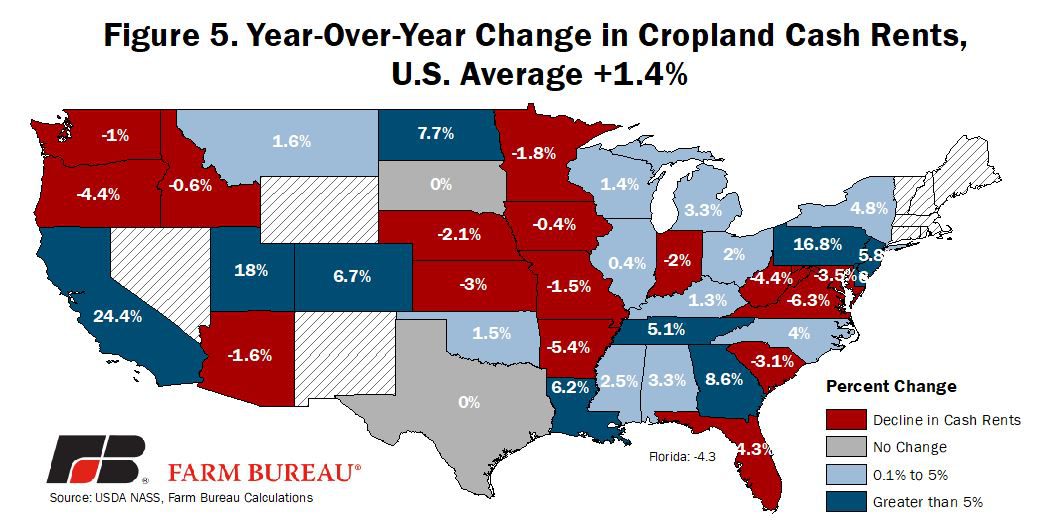
In addition to owning agricultural land, many farm operators also rent cropland for farming activities. These rental agreements are generally made in the fall of the prior year, e.g., 2019 rental rates were agreed to in the fall of 2018. For 2019, USDA’s state-level estimates of cash rents for cropland reveal a U.S. average rental rate of $140 per acre, up $2 per acre or 1.4% from 2018 – marking the second consecutive year of rental rate increases.
Cash rental rates were the highest in areas with highly productive cropland including California, Arizona, Washington and across the Corn Belt and Great Lakes region. Figure 4 highlights the cash rental rates for cropland.
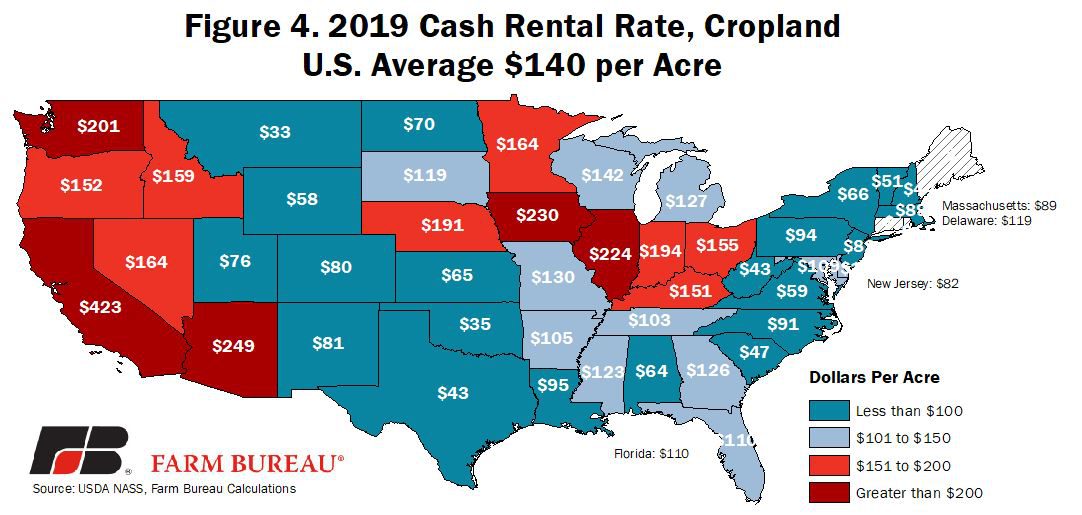
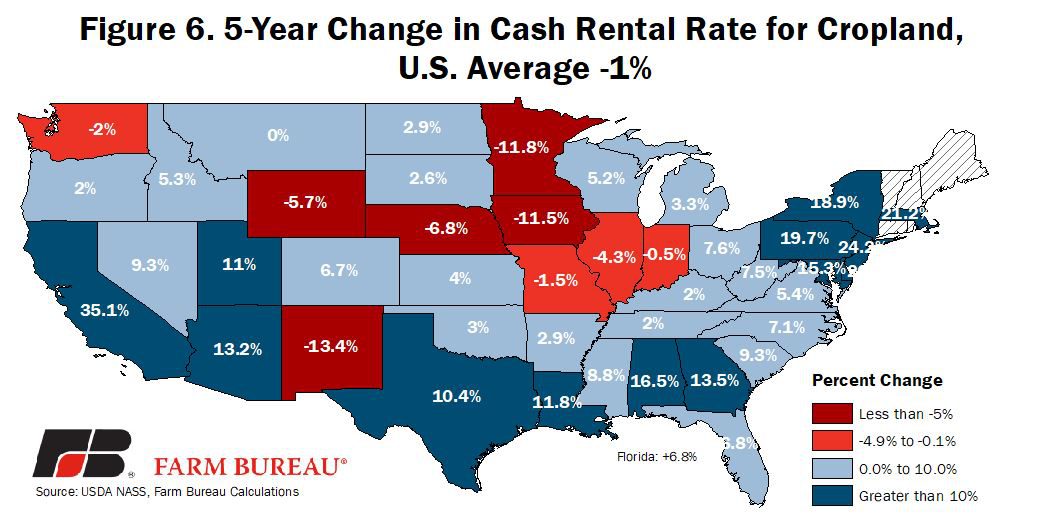
Several states saw very significant increases in cash rental rates. California rental rates increased by more than 24%, Utah increased by 18% and Pennsylvania by nearly 17%. Across the U.S. cash rental rates for cropland declined in 15 states out of the 40 states with year-over-year results available. The decline in rental rates was the highest in Virginia at -6.3% followed by Arkansas at -5.4%. Following the change in agricultural land values, several Corn Belt states also saw lower cash rental rates. Focusing again on Iowa, cash rental rates were down or unchanged for the fifth consecutive year and are down 12% from the 2014 high of $260 per acre. Figures 2 and 3 identify the year-over-year change in cropland cash rents land values and the 5-year change in cash rents, respectively.
Summary
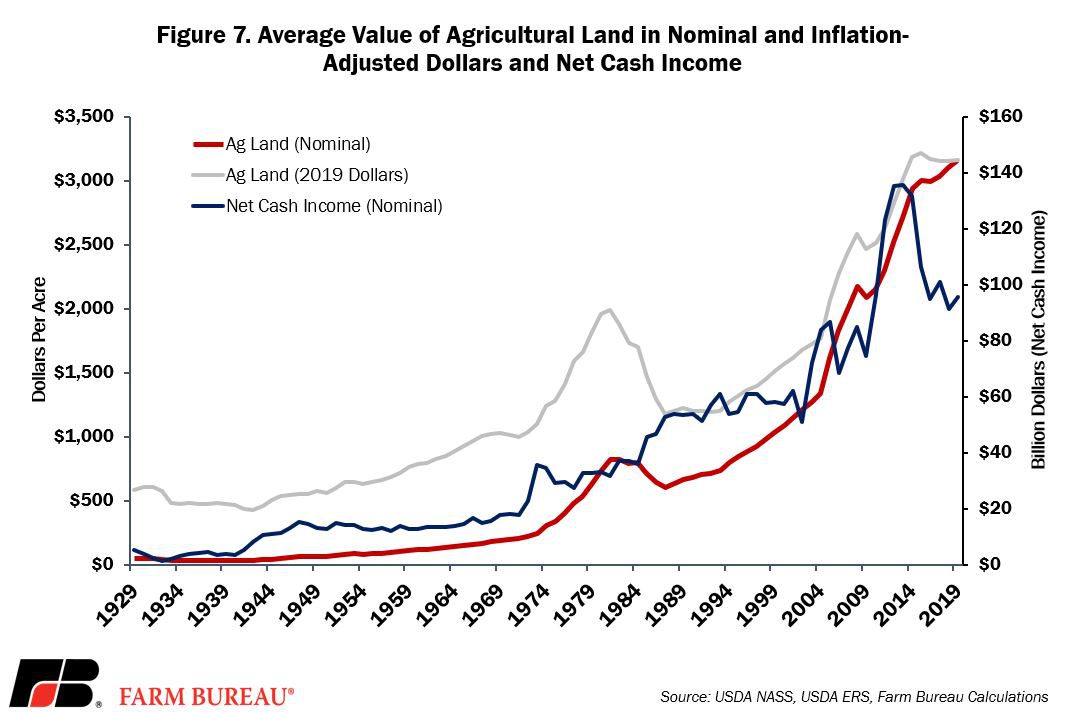
Given the downturn in net farm income and net cash income experienced across much of agriculture over the last 5 years, i.e., USDA’s Early Look at 2019 Farm Income, many had anticipated that agricultural land values and cash rents in the U.S. would weaken.
As USDA’s most recent land value survey indicated, this has not been the case in aggregate – instead, agricultural land values have continued to increase and have paced with inflation since the collapse in farm income that occurred in 2014. Consider that in the 20 years prior to 2014 agricultural land values and net cash income was highly correlated at 86%, but since 2014 – and while a small sample size –these values are now negatively correlated highlighting the growing disconnect between land values and farm income, Figure 7. This, however, is a national average perspective.
At the state level, cash rents and farm income seem to be more aligned. Many of the areas with declining agricultural land values and cash rents over the last 5 years are found in the Midwest where a prolonged downturn in crop and livestock prices have reduced net cash income. One factor that will certainly provide some support to agricultural land values and cash rents is the administration's effort to financially offset trade losses.
While the market facilitation program payments do not guarantee profitability, they can help to reduce losses and ameliorate financial pressures. The improved financial performance of the farm may ultimately keep the supply of agricultural land shorter and enable farms to hold onto cash rental agreements than would have otherwise been the case without trade assistance. This support is short-lived. Without a long-term solution to the trade disruption, and absent a weather-related supply disruption or fundamental change in demand, U.S. agriculture will likely need to reallocate resources; if such a reallocation reduces farm profitability look for land values – the asset base of agriculture – to go along for the ride.
Top Issues
VIEW ALL