Low Mississippi River Levels Drive up Grain Transportation Costs

photo credit: Getty
Daniel Munch
Economist
Low water levels on the Mississippi River, a result of dryness across the Midwest and South, are reducing the ability for barges to effectively navigate, driving up farmers’ transportation costs as they seek storage and marketing options for their recently harvested crops. This Market Intel is a follow-up to our recent analysis of the initial impacts of drought conditions on the movement of inland barges: Severe Weather and Low Mississippi River Levels Bring Uncertainty to Harvest.
Generally speaking, inland barges are a reliable and cost-effective way to transport goods. With relatively low labor and energy requirements to move a large quantity of product, barges have been shown to provide shipping services at a 10th of the cost of railways and a 16th of the cost of trucking, where available. The efficiency of barges, of course, relies on the existence of enough water for constant movement without obstruction. Dry conditions that lower river water to levels too low for barges to navigate or to levels that require barges to reduce their draft (how deep the boat sits in the water) limit transportation on rivers.
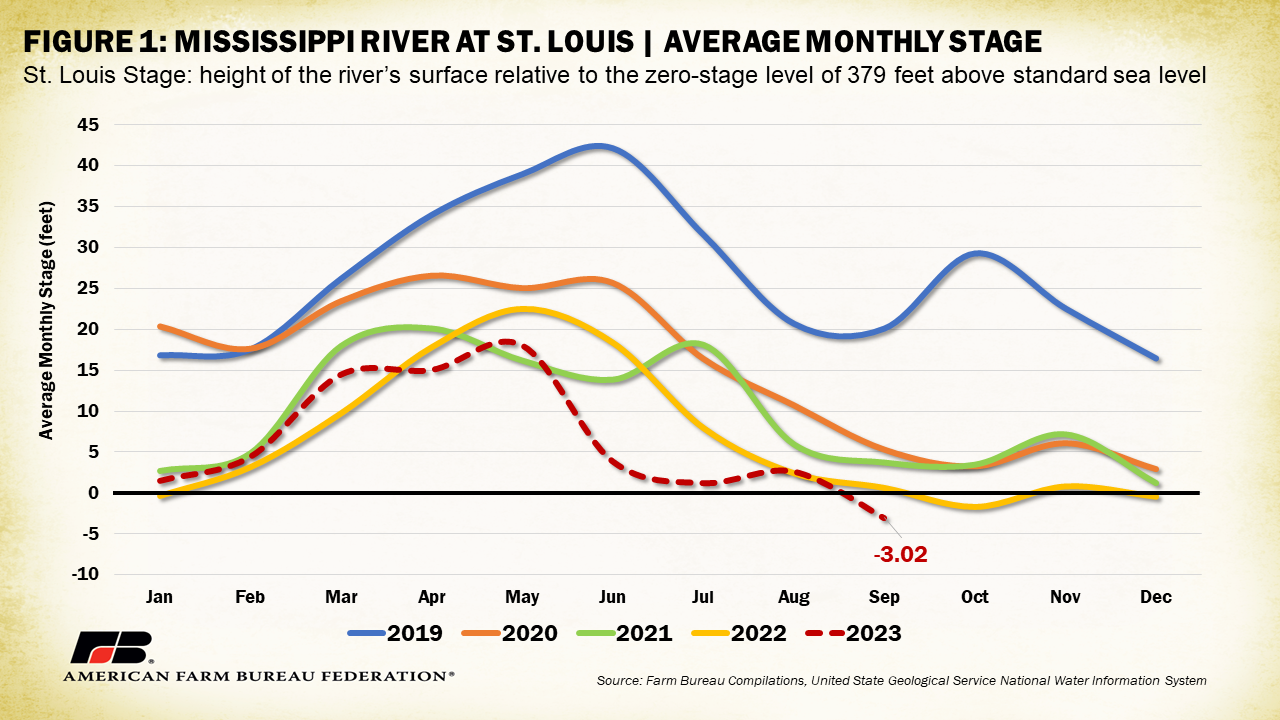
In late August, the Army Corps of Engineers reported the stage, or height of the river’s surface relative to the zero-stage level of 379 feet above standard sea level, at St. Louis was 1.13 feet, 46% lower than the prior three-year average of 4.37 feet and 24% below last year’s level of 1.49 feet on the same day. So far for the month of September, the average daily stage at the same location has been -3.02 ft, over three times lower than August’s number and over 2 feet lower than the same period last year.
According to USDA’s latest Grain Transportation Report, the industry has responded by reducing draft allowances (the depth a barge may sink into the water), as well as agreeing to a reduction in tow sizes (the number of barges a single boat can tow.) As of Sept. 18, between Cairo, Illinois, and the Gulf of Mexico, average loading drafts for barges are down 24% and average tow sizes are down 17-38%. Combined, this means more barges will be needed to move the same quantity of products and more boats will be needed to move smaller groups of barges, pressuring capacity and slowing downstream user efficiency. Pressured capacity in barges and boats increases competition for transportation, pushing up costs for shippers looking to get product moved. USDA further noted these adjustments have resulted in transit delays of two to three days.
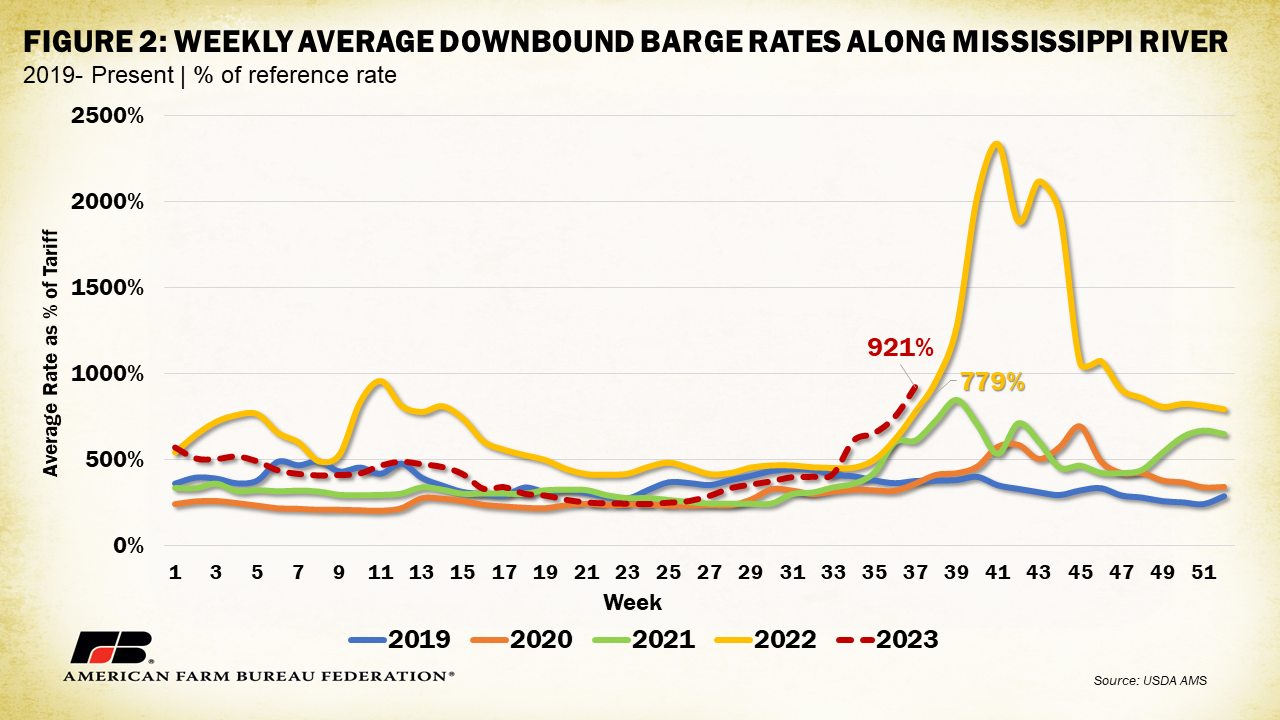
USDA’s Agricultural Marketing Service tracks weekly barge rates for gulf-bound freight originating from seven locations along the Mississippi River system: Twin Cities, a stretch along the Upper Mississippi; Mid-Mississippi, a stretch between eastern Iowa and western Illinois; Illinois River, along the lower portion of the Illinois River; St. Louis; Cincinnati, along the middle third of the Ohio River; Lower Ohio, approximately the final third of the Ohio River; and Cairo-Memphis, from Cairo, Illinois, to Memphis, Tennessee. The U.S. inland waterway system utilizes a percent-of-tariff system to establish barge freight rates. The tariffs were originally from the Bulk Grain and Grain Products Freight Tariff No. 7, which was issued by the Waterways Freight Bureau (WFB) of the Interstate Commerce Commission (ICC). In 1976, the United States Department of Justice entered into an agreement with the ICC to deregulate barge rates and make Tariff No. 7 no longer applicable. Today, the WFB no longer exists, and the ICC has become the Surface Transportation Board, which does not have jurisdiction over barge rates on inland waterways. However, the barge industry continues to use the tariffs as benchmarks for rate units. Each city on the river has its own benchmark, with the northernmost cities having the highest benchmarks. They are as follows: Twin Cities = $6.19/ton; Mid-Mississippi = $5.32/ton; St. Louis = $3.99/ton; Illinois = $4.64/ton; Cincinnati = $4.69/ton; Lower Ohio = $4.46/ton; and Cairo-Memphis = $3.14/ton.
Figure 2 displays weekly average downbound barge rates for the seven locations since 2019. The rate represents the percent increase over the reference benchmark. In the previous analysis, average barge tariffs for the week of August 16 reached 401% of their underlying tariff, which was well in line with previous years. As of the week of Sept. 11, rates have ticked up to over 900% of their underlying tariff, reflecting the impact of water levels on transportation costs. For comparison, during the same week last year, when water levels were also on the decline, rates were 779% of their underlying tariff, meaning rates this year have outpaced those of last year during the same week.
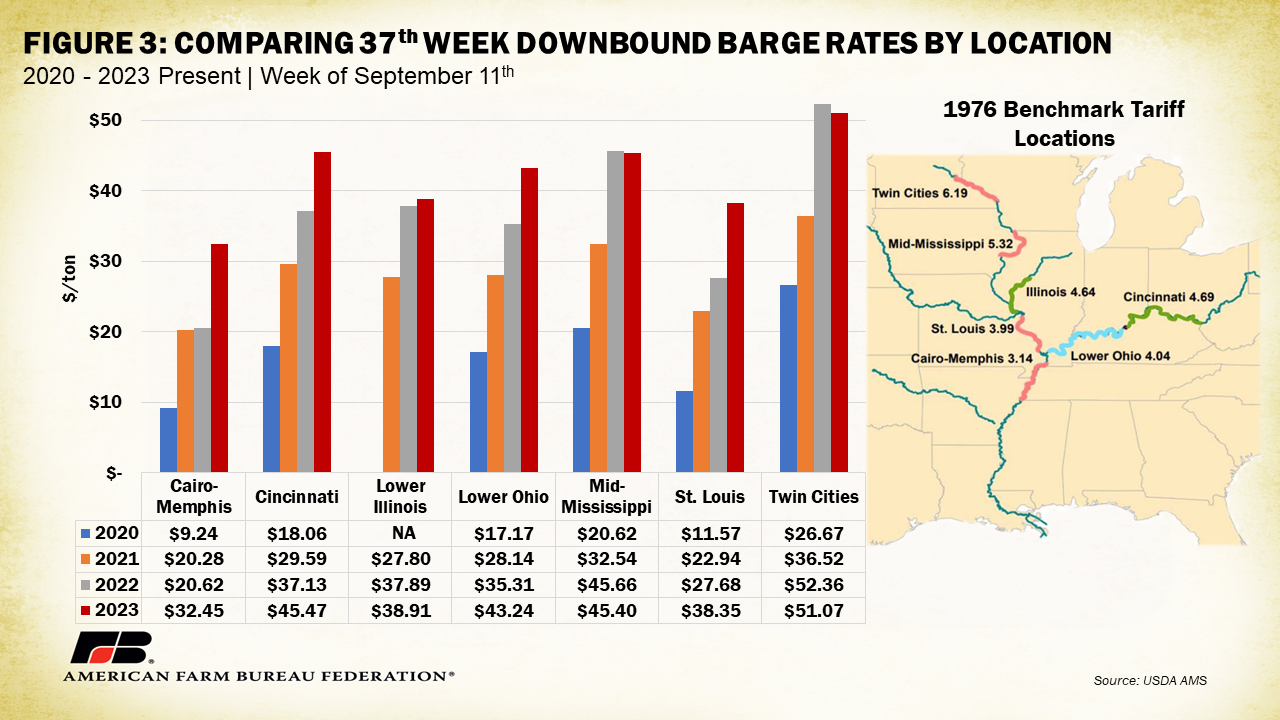
To calculate the true per-ton cost of grain transportation, the percentage of tariff rate is multiplied by the 1976 benchmark. As an example, a 300% tariff for a St. Louis grain barge would equal 300% of the St. Louis benchmark rate of $3.99, or $11.97 per ton. Figure 3 displays the per-ton cost of barge transportation at the seven locations with rate benchmarks for the 37th week of 2020, 2021, 2022 and 2023. For the 37th week of this year, per-ton costs are highest for all locations except the Mid-Mississippi and Twin Cities regions, which are slightly below 2022 rates. Notably, across locations, in both 2022 and 2023 rates are substantially (an average of 28% to 51%) higher than 2021 levels when river stage levels were more normal.
USDA reported that the Army Corps of Engineers continues to dredge ports of the Mississippi River system and that higher precipitation in the upper Midwest could help stabilize water conditions. This could be the reason rates along the Mid-Mississippi and Twin-Cities stretches saw lower prices compared to last year than other regions further downstream.
For the week ending Sept. 24, barged grain movements at St. Louis (Lock 27) totaled 68,900 tons. This was 16% less than the previous week and 41% less than the same period last year. For the week ending Sept. 16, 81 grain barges moved down river—25 fewer than last week. There were 516 grain barges unloaded in the New Orleans region, 2% fewer than last week. Disruptions to barge movements in a region that heavily supplies export demand contributes to market uncertainty. This is particularly impactful since approximately 95% of corn, 94% of soybeans and 45% of wheat moved on inland barges in the U.S. are transported on the Mississippi River. The vast network of locks and dams, prevalence of grain elevators and vessel service facilities, and the simple geography of the Mississippi/Missouri river system running through production-heavy heartland states make utilizing alternative waterways unrealistic.
Conclusion
Agricultural producers have dealt with a wide range of supply chain shortfalls for the past several years. Railway and trucking have encountered an array of service issues often linked to labor and equipment capacity constraints. Largely unaffected by these issues, barges have historically remained a relatively inexpensive and reliable way to move product through the country, and especially to export ports. The continued limitations on this cost-effective and efficient transportation mode because of dangerously low water levels in the Mississippi River is especially problematic during the height of harvest season, when farmers are looking to move grain to storage facilities. If forecasted rains do not improve conditions, many producers will scramble to find places to store their goods or face exorbitant wait times and costs to acquire transportation.

Top Issues
VIEW ALL