MAP and FMD, Collaboration on Behalf of U.S. Farmers and Ranchers

photo credit: Alberto Garcia/(CC BY-SA 2.0)
Veronica Nigh
Former AFBF Senior Economist
Implications
The President’s FY 2018 budget released last week included a number of areas of concern to U.S. agriculture. One of those items was the elimination of funding for the Market Access Program and the Foreign Market Development Program. It has been argued that these two programs are duplicative of private efforts and as such if eliminated, wouldn’t be missed. This analysis, while appealing in its simplicity, doesn’t tell the whole story.
A Little Background
Until 1985, U.S. agriculture self-funded any export promotion efforts. Government assistance in the development of markets was limited and predominantly conducted by USDA’s Foreign Agriculture Service. FAS did partner with grower organizations to research: the size of potential markets, the likely U.S. share, the nature, and importance of both local and import competition, the tariffs and trade barriers in restraint of trade, and the interest of local trade and processors in collaborating. This interaction to encourage exports was formalized with a few cooperative agreements between FAS and grower groups, however, direct monetary government assistance was non-existent.
By the mid-1980s it became clear that this loose effort was no longer sufficient. The record harvests were further exacerbated by falling U.S. agricultural exports and contributed to record-high stock levels. Ag exports fell for a wide variety of reasons but were aided by aggressive promotion and subsidization by U.S. competitors and the imposition of trade barriers by these foreign markets, hampering further market expansion. In response, Congress created the Targeted Export Assistance Program, as part of the Food Security Act of 1985. This began the public-private financial partnership between the U.S. government and the U.S. agriculture industry to promote U.S. agricultural exports. Over the years, the TEA changed names and scope to finally become the Market Access and Foreign Market Development Programs, which we know today.
Market Access Program – Under MAP, Commodity Credit Corporation funds are used to reimburse participating organizations for a portion of the cost of carrying out overseas marketing and promotional activities, such as consumer promotions. MAP participants include nonprofit agricultural trade organizations, state-regional trade groups, cooperatives, and private companies that qualify as small businesses. MAP has a brand promotion component that provides export promotion funding to small companies and thereby helps expand the number of small and medium-sized entities that export.
When MAP funds are used for generic marketing and promotion, participants must contribute a minimum 10-percent match. For the promotion of branded products, a dollar-for-dollar match is required.
The MAP is intended to supplement, not supplant, the efforts of the U.S. private sector.
Foreign Market Development Program – This program provides cost-share assistance to nonprofit commodity and agricultural trade associations to support overseas market development activities that are designed to address long-term opportunities to reduce foreign import constraints or expand export growth opportunities. For example, this might include efforts to:
- reduce infrastructural or historical market impediments,
- improve processing capabilities,
- modify codes and standards, or
- identify new markets or new uses for the agricultural commodity or product.
Unlike MAP, Cooperator Program activities are carried out on a generic commodity basis and do not include brand-name or consumer promotions.
Funding - MAP and FMD are currently funded under the 2014 Farm Bill respectively at $200 million and $34.5 million. USDA’s FY2017 outlays for MAP and FMD are respectively $192 million and $33 million.
Duplication?
Certainly, U.S. agriculture understands the value of exports – more than 20 percent of our production is exported. Our industry’s dedication to maintaining and expanding agricultural exports is demonstrated by the matching funds growers, companies and affiliated organizations provide to those organizations on the front line of export promotion. But it would be irresponsible to suggest that the support from the U.S. government isn’t critical to export promotion success.
If MAP and FMD funding did not exist, the budgets for many export promotion organizations would fall by 40, 50, 60 percent or more. The organizations would continue to exist, but hard decisions about what areas of the world to continue operating in would have to be made. Most experts in international trade will tell you that the single most important thing you can do to increase sales is simply to “be there”. That means having a regular, physical presence in the market. Having staff locally available to answer questions and provide assistance when issues arise. This is why the U.S. Wheat Associates has staff in 15 office outside the United States and 2 in the country. The U.S. Grains Council has 7 country offices, 3 regional offices, and consultants in several more. The U.S. Meat Export Federation has offices in 15 cities, across the continents of Asia, Africa, South America and North America. The Alaska Seafood Marketing Institute has overseas marketing representatives in China, Japan, Brazil and in five European cities.
The list of organizations and their international presence is long – 60 organizations received MAP funding in FY 2017; we won’t list them all here. From the short list above, however, it is fairly clear that the variety of products that are promoted is quite vast, as are the places where they are marketed. Some markets are mature and robust but demanding. Others are currently making fairly small purchases, but have the potential to become large markets in the future. MAP and FMD funding allows participating organizations to concurrently pursue both.
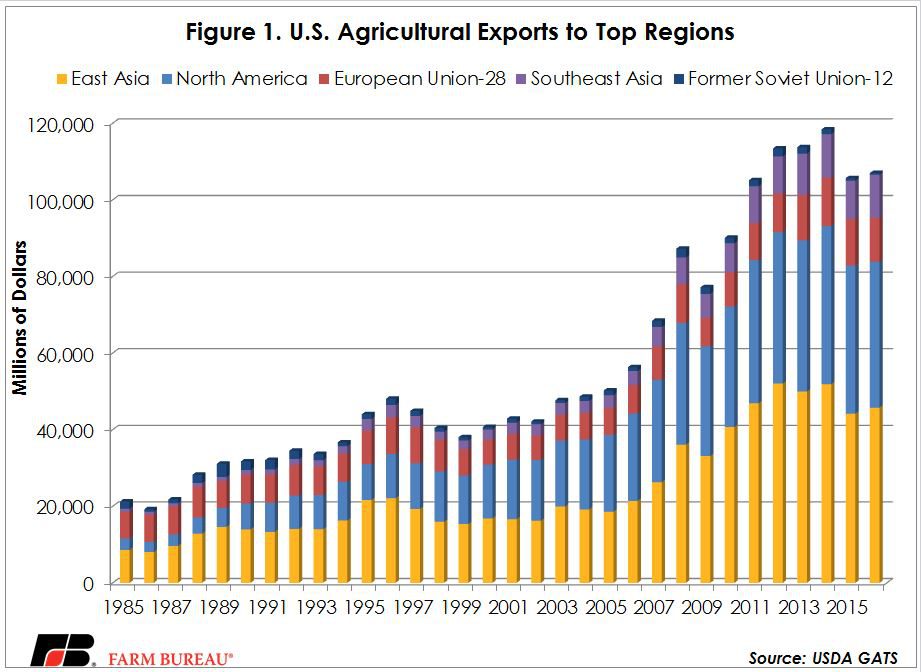
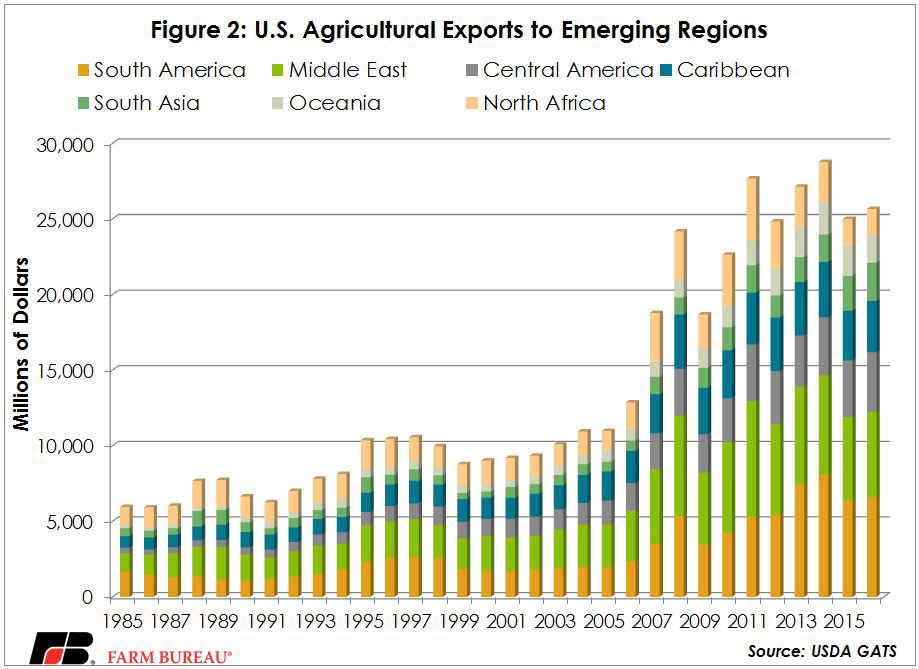
In 1985, when the Targeted Export Assistance Program began, the top four regions for U.S. agricultural exports were in this order, East Asia (30%), European Union (24%), North America (11%) and the Former Soviet Union (7%). In 2016, the top regions, again in order, were East Asia (34%), North America (28%), European Union (9%) and Southeast Asia (8%). If it hadn’t been for the partnership with the U.S. government that allows limited funds to be stretched, U.S. agricultural export organizations may have chosen to keep offices in the top markets of 1985. If that had been the case, perhaps the U.S. would have focused on the European Union and the Former Soviet Union too long and missed out on the growth story that has occurred in Southeast Asia and North America. Figure 1 highlights the growth story that has occurred since 1985 in these five regions. In figure 2, we might be seeing the beginning of a similar in other stories in emerging regions. MAP and FMD funding helps U.S. agricultural export organizations explore both.
Top Issues
VIEW ALL