NAFTA: U.S. Food and Non-Alcoholic Beverage Manufacturing
TOPICS
USDA
photo credit: AFBF Photo, Mike Tomko
Veronica Nigh
Former AFBF Senior Economist
As an agricultural group that represents producers, we don’t regularly discuss food and beverage manufacturing, beyond recognizing that the sector provides important customers for our products. However, given the importance of food manufacturing to the U.S. economy and our trade with NAFTA partners, more discussion is warranted.
The Grocery Manufacturers Association (GMA), the trade association that represents “the makers of the world’s favorite food, beverage and consumer products” devides the grocery manufacturing industry into three primary sectors: beverage, food and household products manufacturing. This discussion will lean on GMA’s definitions, though we exclude household paper products, soaps, and toilet preparations that GMA includes. For the purpose of this discussion we define food and non-alcoholic beverage manufacturing with the following North American Industry Classification codes (NAICs): 31211, 3112-9, and 3111. (For a full description of NAICs codes go to the US Census Bureau. )
Using this definition, the recently released 2015 Annual Survey of Manufactures reveals that U.S. food and beverage manufacturers shipped more than $825.6 billion in product in 2015. Of this impressive amount, a small share, about 5 percent, was exported globally. However, 5 percent of such a large number results in total exports of nearly $39 billion.
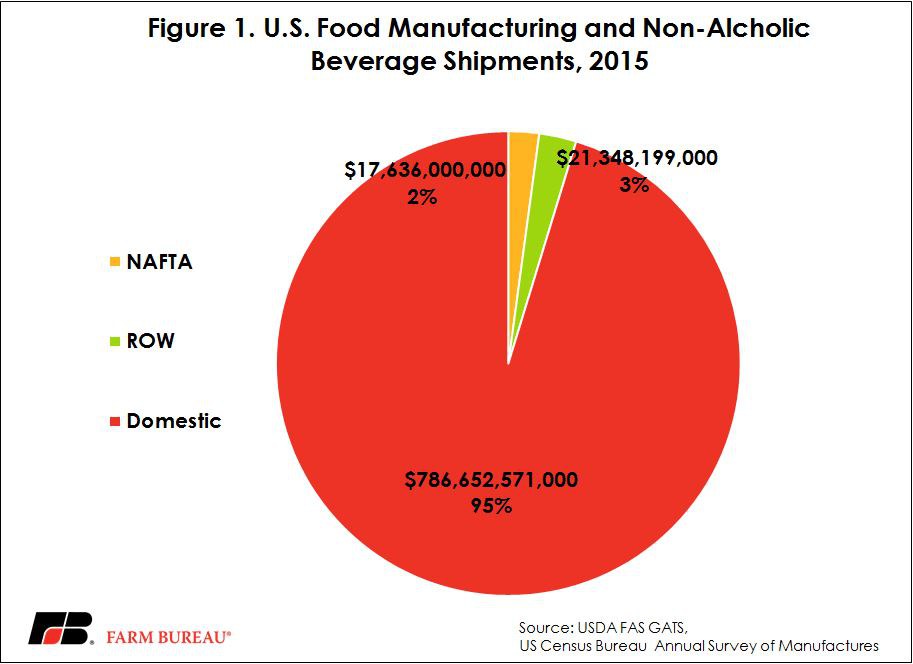
Nearly half - 45 percent - of the $39 billion in processed food exports went to Mexico and Canada. Processed food exports to our NAFTA partners, which were valued at $3.3 billion in 1993, have grown by more than 400 percent since the inception of NAFTA. This growth was in part due to NAFTA, which eliminated nearly all tariffs on processed food and beverages. These tariffs had been as high as 20-40 percent on some products prior to the agreement’s entry into force.
Top exported products to Canada are: food preparations (ingredients, beverage bases and baking ingredients), non-alcoholic beverages, snack foods, chocolate and confectionery, and prepared meats. Top processed foods to Mexico are: processed and prepared dairy products (cream, cheese and ice cream), food preparations (ingredients, beverage bases, etc.), syrups and sweeteners, and prepared meats.
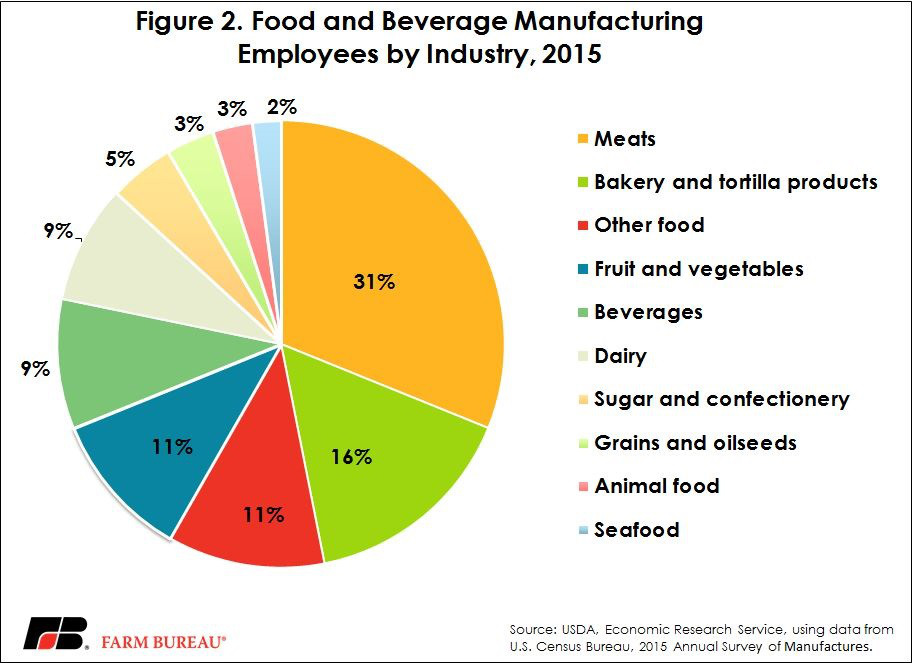
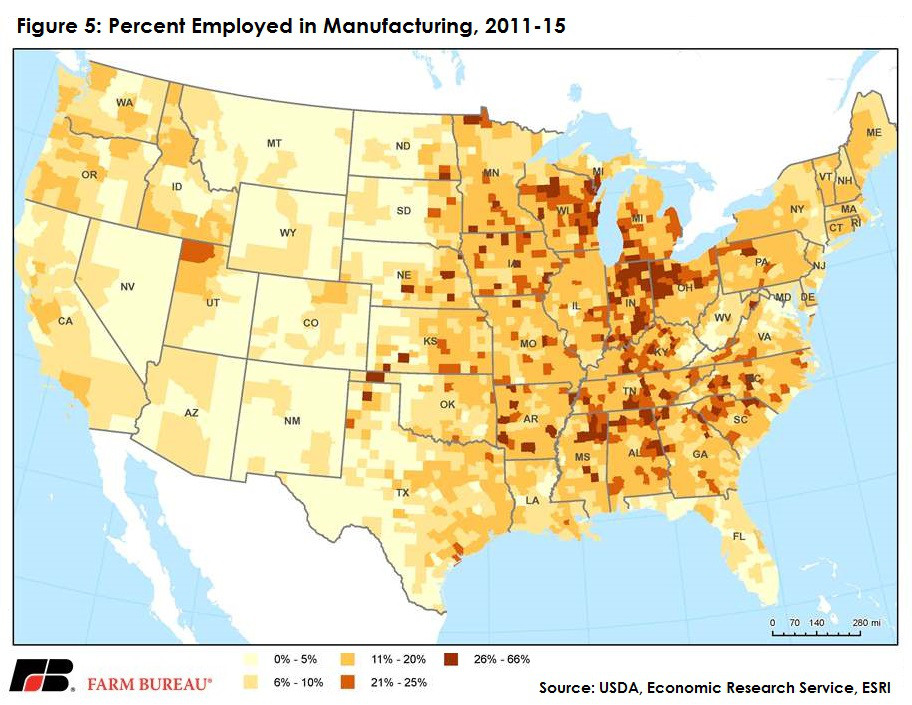
While this information is interesting, the reason we’re writing about processed food and beverage manufacturing is because of the sector’s importance as an employer. According to USDA ERS, in 2015, these plants accounted for 16 percent of the value of shipments from all U.S. manufacturing plants. These plants employed more than 1.5 million workers in 2015 (about 14 percent of all U.S. manufacturing employment and just over 1 percent of all U.S. non-farm employment). The meat processing industry employed the largest percentage of food and beverage manufacturing workers in 2015 (31 percent), followed by bakeries (16 percent), and fruits and vegetables (11 percent). Overall employment in the sector in 2015 was up 6.3 percent from 2014.
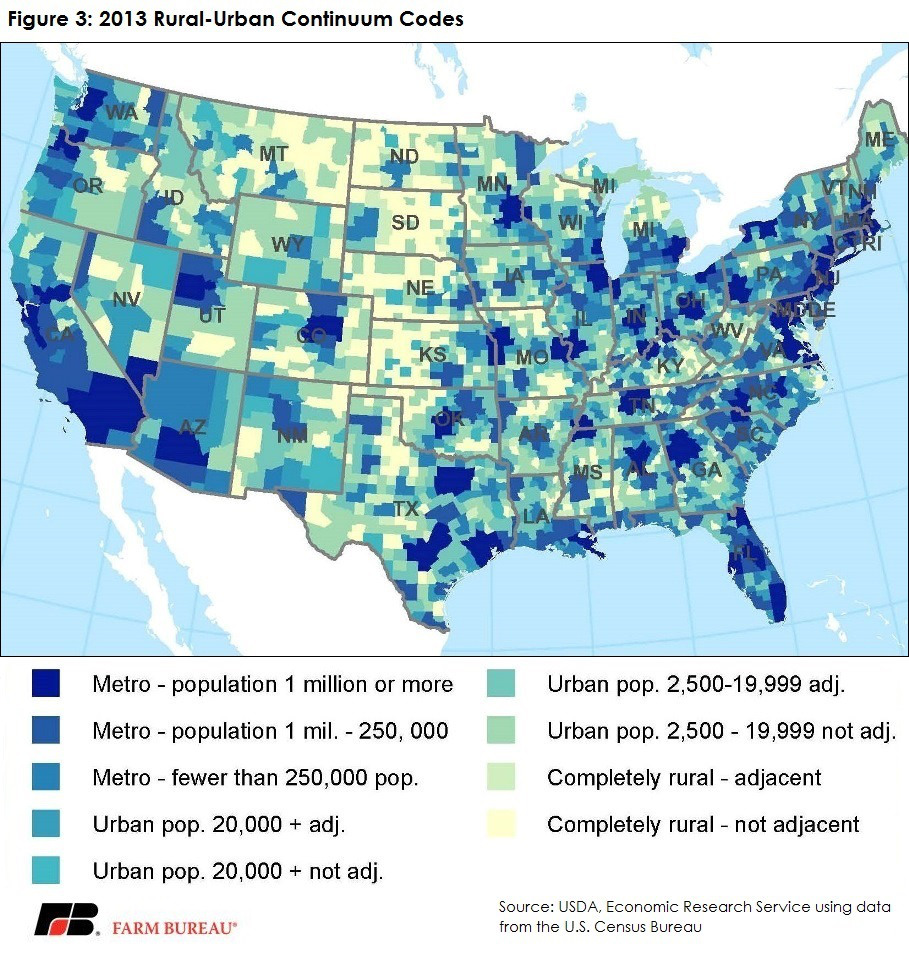
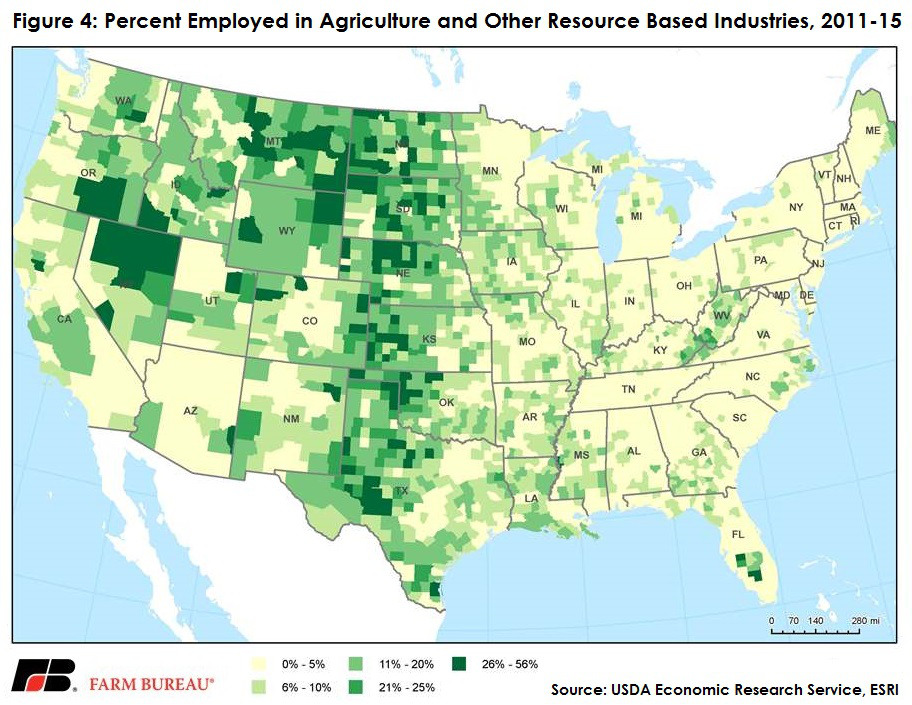
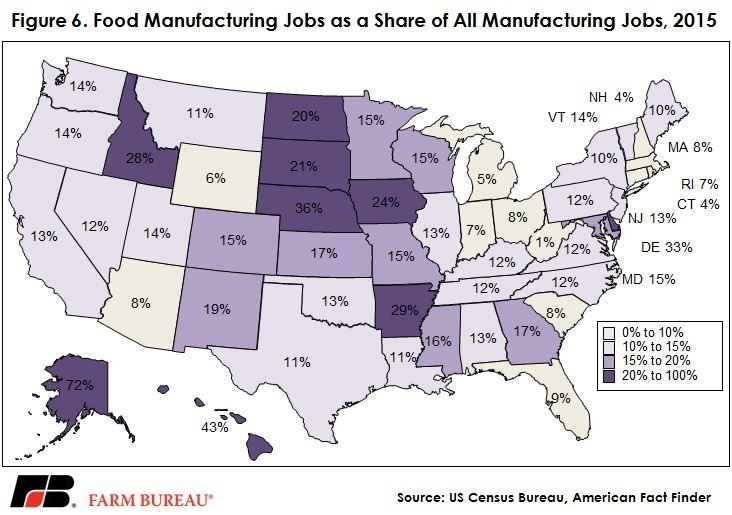
Food and beverage manufacturing plays an even more important role in some states. Arkansas, for example, is a fairly rural state (figure 2), with employment more dependent on manufacturing than agriculture (figures 3 and 4), but for whom many manufacturing jobs are dependent on the state’s agricultural production. In 2015, 29 percent of Arkansas’s manufacturing jobs were in food manufacturing. We also see a high level of dependence on food manufacturing in states with strong employment in agriculture, which makes sense when we remember that meat processing and fruit and vegetable processing occur close to the production source.
Given the importance of Canada and Mexico to the beef, pork, dairy, fruit and vegetable sectors, as well as processed foods, we’d be well-served to consider the secondary impact to food manufacturing that would follow in the case of a market disruption.
Top Issues
VIEW ALL