NAFTA: Veggie Tales

photo credit: North Carolina Farm Bureau, Used with Permission
Veronica Nigh
Former AFBF Senior Economist
When discussing the impact that the North American Free Trade Agreement has had on U.S. agriculture, the general summary has been, “the agreement has been wonderful for U.S. agriculture, with a few exceptions.” This article explores the impact that NAFTA has had on the vegetable sector, which is one of the sectors often included after the comma.
Like many other commodities discussed in this series, in terms of trade of vegetables, NAFTA partners are each other’s top suppliers. In fact, Canada, Mexico and the United States have always been each other’s primary suppliers of vegetable imports, even prior to NAFTA.
In 1993, the year before the agreement went into effect, Mexico and Canada combined to supply 77 percent of U.S. vegetable imports. That percentage has held steady throughout the implementation of NAFTA and other trade agreements, ranging between 76 and 80 percent. In 2016, Canada and Mexico supplied 80 percent of U.S. vegetable imports.
Likewise, the U.S. (61 percent) and Mexico (25 percent) combined to supply 86 percent of Canada’s veggie imports in 2016. This is little changed from 1995, the first year for which data is available, when the U.S. (81 percent) and Mexico (8 percent) combined to supply 89 percent.
Mexico is the same story. The U.S. (73 percent) and Canada (9 percent) combined to supply 82 percent of Mexico’s veggie imports in 2016. This is little changed from 1995, the first year for which data is available, when the U.S. (84 percent) and Canada (11 percent) combined to supply 95 percent.
The issue, of course, is one of scale. The United States is the largest vegetable importing nation in the world. When combined as a customs union, the EU is the largest market, but on an individual country basis, the U.S. is largest. U.S. fresh and frozen vegetable imports exceeded $9.6 billion last year. The next closest importer was Germany, which imported one-third less at $6.5 billion. Canada is the sixth largest vegetable importer, with 2016 totals exceeding $3 billion. Mexico is much further down the list, coming in as the 32nd largest global importer of vegetables – imports were nearly $415 million last year.
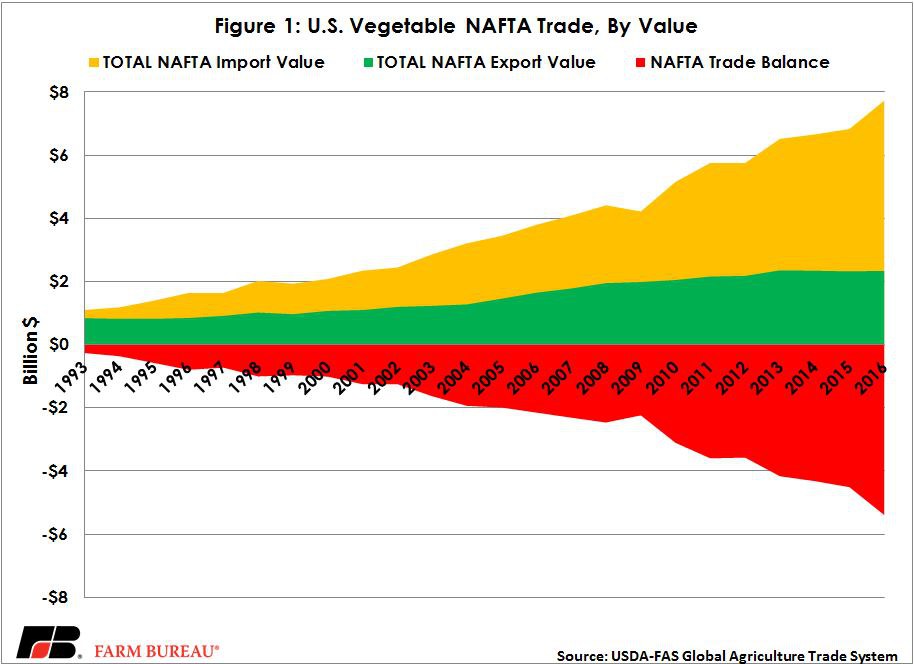
While the value of U.S. vegetable exports to the sixth and 32nd largest import destinations grew 178 percent between 1993 and 2016, the import of vegetables into the world’s largest importer grew even faster. U.S. imports of fresh and frozen vegetables from our NAFTA partners have grown dramatically since the implementation of NAFTA – by more than 600 percent. As such, the U.S. trade balance in vegetables has also continued to grow. The U.S. had a negative trade balance of $262 million in 1993. In 2016, it was nearly $5.4 billion.
More on Imports
Given the climate and labor availability, it is no surprise that between our NAFTA partners, Mexico is the dominant supplier. This being said, Canada has become a more significant supplier over the last two decades, as hoop house and greenhouse technology improved. In 1993, Mexico was responsible for 86 percent of NAFTA imports, Canada 14 percent. In 2016, Mexico supplied 79 percent of NAFTA vegetable imports, while Canada supplied the remaining 21 percent.
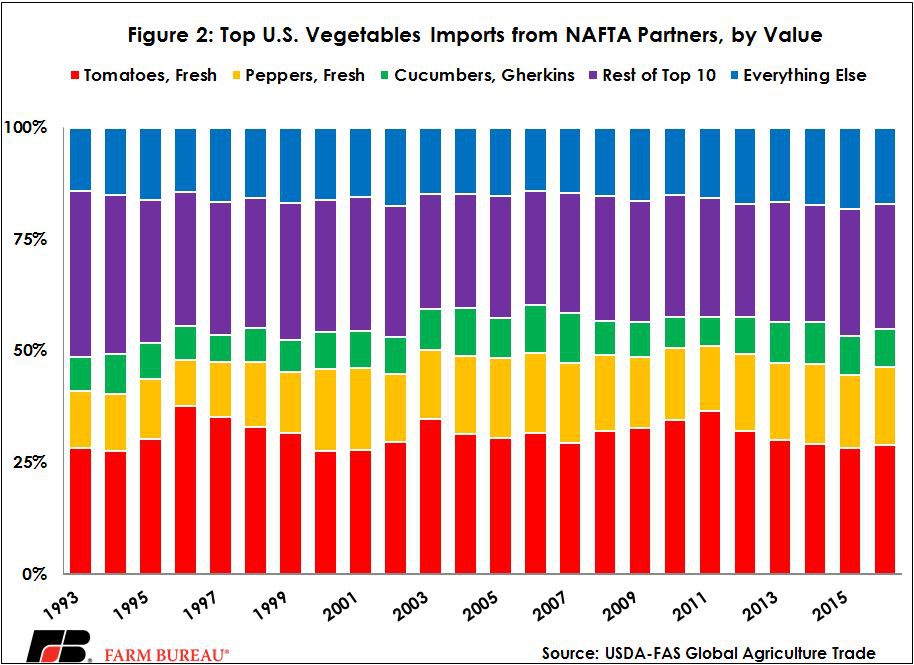
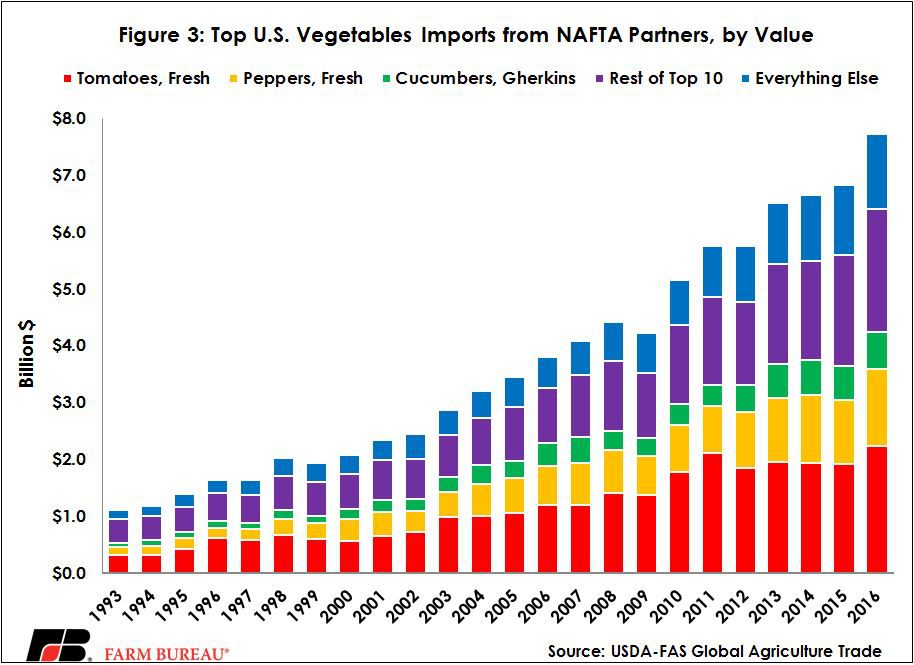
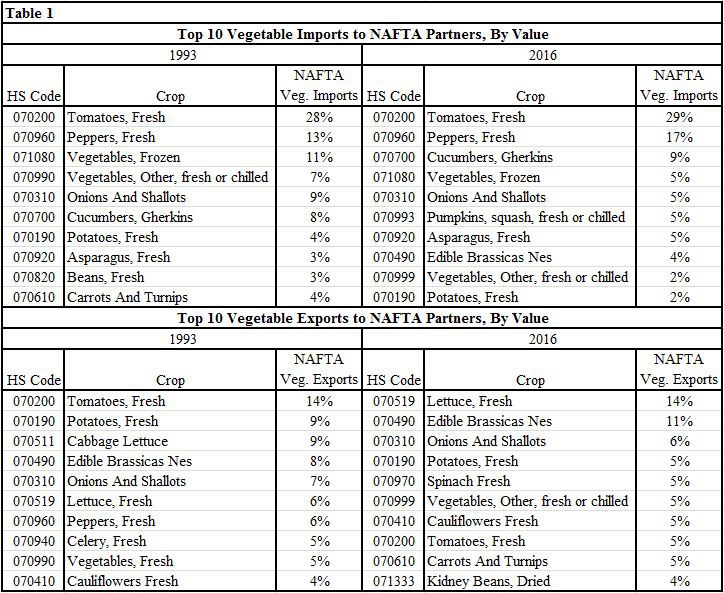
U.S. vegetable imports are concentrated in a handful of crops. The top two crops, fresh tomatoes and fresh peppers account for more than 40 percent of total NAFTA vegetable imports. That was true in 1993 and remains true today. When the list is expanded to the top 10 crops, the share of total NAFTA vegetable imports jumps to more than 80 percent. Figure 2 highlights this import concentration, while figure 3 drives home the tremendous scale of the growth.
More on Exports
Turning to the export side of the vegetable trade, our NAFTA partners are also our top two export destinations. In 1993, Canada and Mexico were the destination for 57 percent of U.S. vegetable exports. That percentage has held steady throughout the implementation of NAFTA and other trade agreements, ranging between 51 and 70 percent. In 2016, Canada and Mexico were the destination for 60 percent of U.S. vegetable exports. Canada was far and away the more significant market –accounting for more than 50 percent of U.S. vegetable exports over the entire time period.
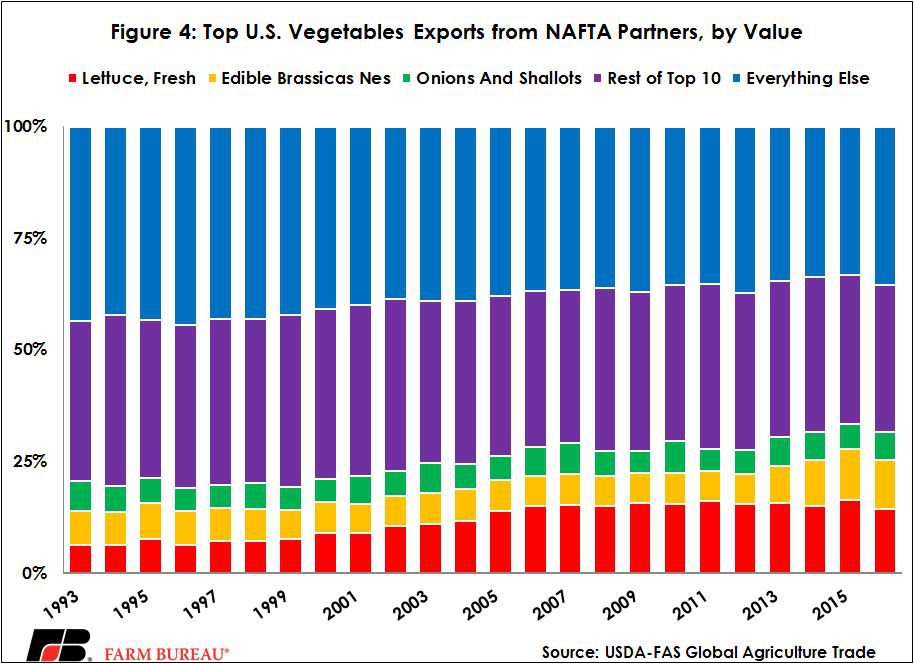
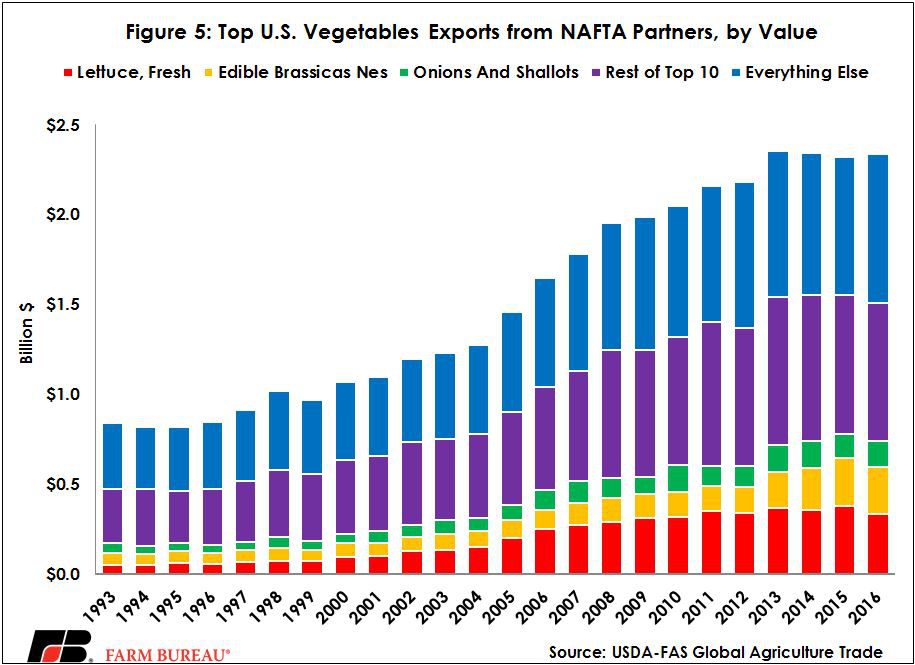
U.S. vegetable exports show considerably more variety and movement in the top commodities than imports. In 1993, fresh tomatoes were the top exported vegetable, accounting for 14 percent of all NAFTA veggie exports. By 2016, fresh tomatoes had fallen to eighth place and only accounted for 5 percent of vegetable exports. Meanwhile, fresh lettuce exports were sixth on the list in 1993, accounting for 6 percent of total vegetable export value. However, in 2016, fresh lettuce exports jumped to the top spot, with 14 percent of the total. When the top 10 crops are grouped together, they accounted for 65 percent of all fresh and frozen vegetable exports in 2016, down from 72 percent in 1993. Compare figures 4 and 5 to figures 2 and 3 to appreciate the difference.
The Bottom Line
U.S. exports of fresh and frozen vegetables to NAFTA partners have experienced steady growth over the last 23 years. However, the trade deficit in this area has continued to swell as big imports have only grown larger. Tomato imports have expanded by more than 620 percent and growth in fresh pepper imports have skyrocketed by more than 850 percent. When these two crops are excluded, the U.S. fresh and frozen vegetable trade deficit falls by two-thirds.
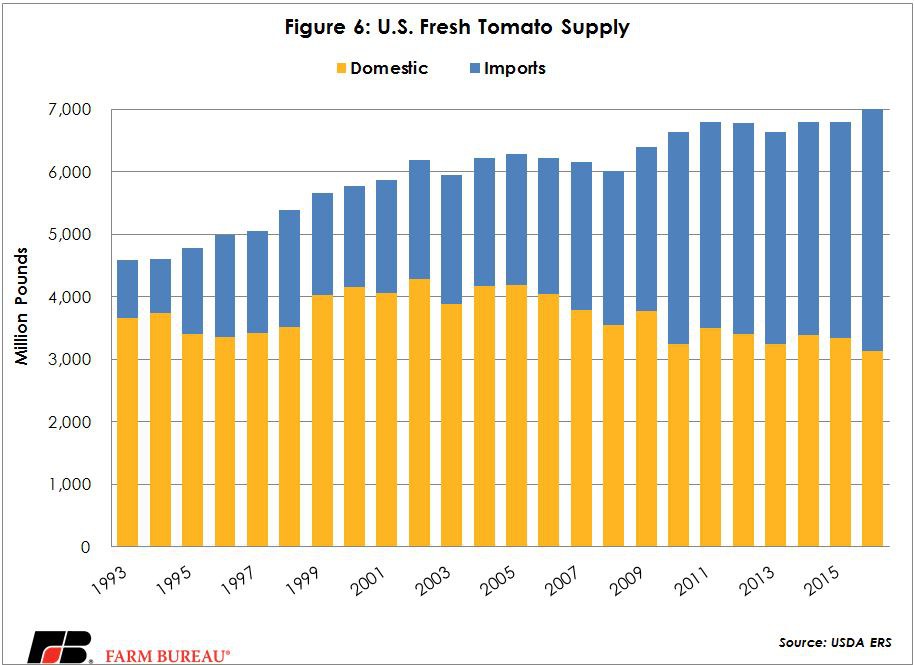
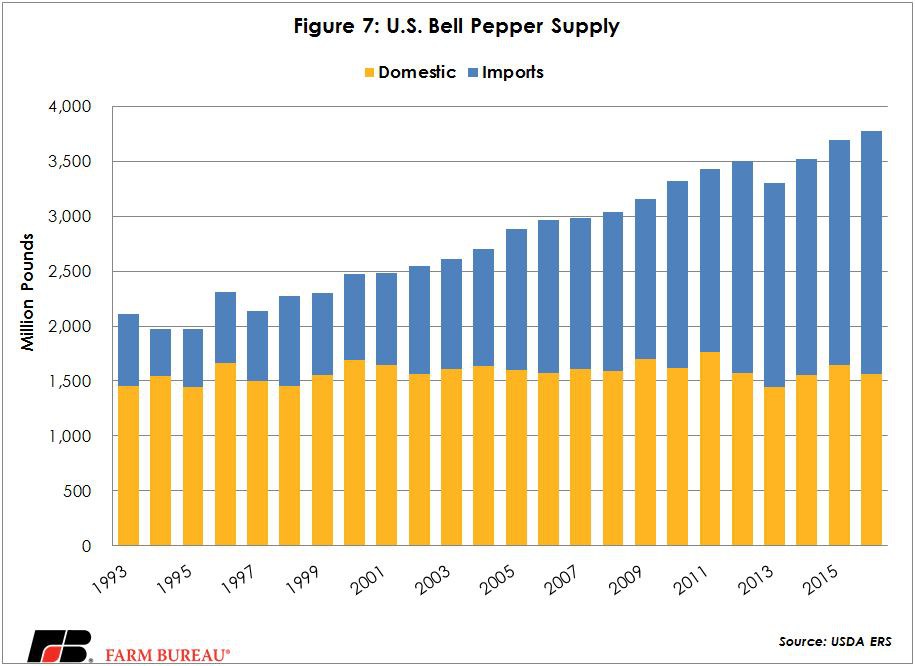
But as U.S. growers of tomatoes and peppers would quickly point out – those crops certainly can’t be excluded. Figure 6 illustrates that while more fresh tomatoes are being consumed in the United States, the share of that supply that was grown domestically has shrunk. U.S. domestic production of fresh tomatoes has fallen by 15 percent since 1993, while the imports have grown by more than 325 percent. Figure 7 tells a slightly different story for bell peppers, but the bottom line is the same -- U.S. pepper growers are supplying a declining share of a growing domestic market. Since 1993, U.S. bell pepper production has grown 8 percent, while imports have grown by nearly 240 percent.
Top Issues
VIEW ALL