Net Farm Income Projected to Drop to 12-Year Low
TOPICS
USDA
photo credit: iStockPhoto
John Newton, Ph.D.
Vice President of Public Policy and Economic Analysis
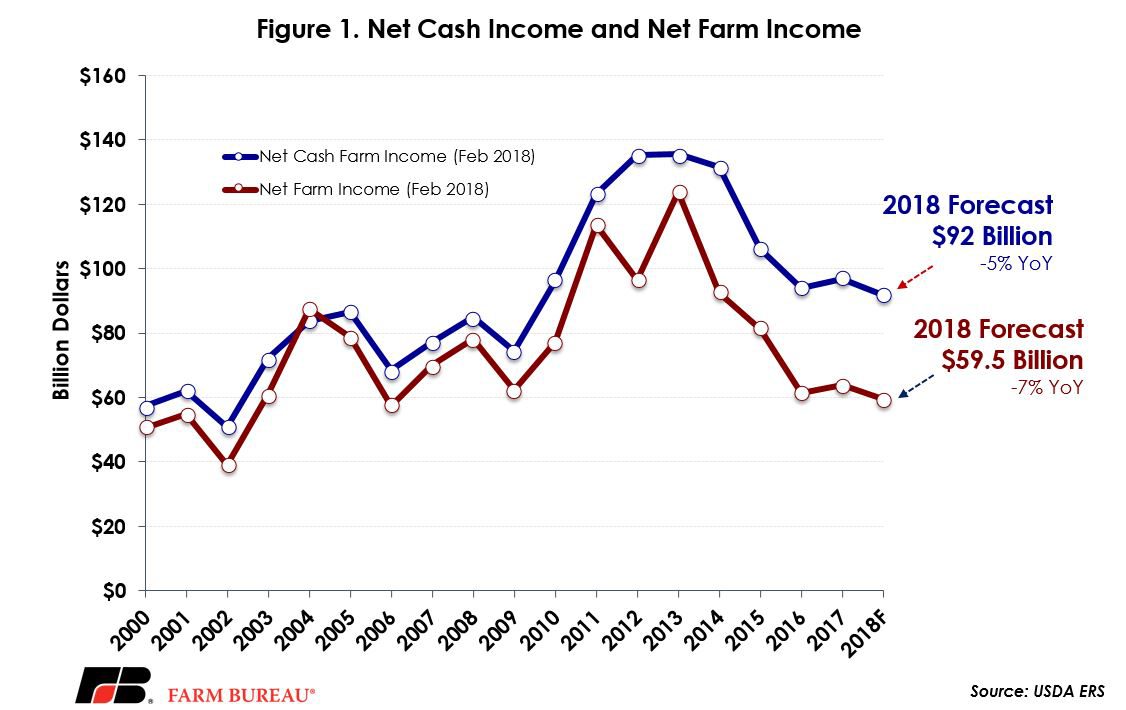
After rebounding slightly in 2017, net farm income in 2018 is expected to fall to $59.5 billion, a 12-year low, according to USDA Economic Research Service’s most recent 2018 Farm Sector Income Forecast. If realized, this would be the lowest net farm income since 2006 and would represent a decline of 6.7 percent from the USDA’s 2017 projection.
Net farm income is a comprehensive indicator of U.S. farm profitability – for all crops and livestock – and includes cash receipts from farming as well as farm-related income, including government payments and noncash items like changes in inventories, economic depreciation and gross imputed rental income, minus cash expenses.
Net cash farm income is less comprehensive and does not include noncash items. Net cash income in 2018 is projected at $91.9 billion, down 5.1 percent from 2017 levels. If realized, this would be the lowest level since 2009.
Importantly, both net farm income and net cash income are down sharply, 52 percent and 32 percent, respectively, from the record high-levels experienced in 2013. Net farm income and net cash farm income levels have remained mostly flat over the last three years – relative to the prior decade – suggesting that farm profitability has stabilized at these lower levels. Figure 1 highlights net farm income and net cash farm income from 2000 to present.
For Most, On-Farm Household Income Remains Negative
While average farm income is expected to rise 0.2 percent in 2018 to $119,252 per household, those numbers do not tell the full story. Average farm income includes both on-farm and off-farm sources of income. During 2018, average on-farm income is expected to decline 10.3 percent to $21,130. Meanwhile, off-farm income is expected to increase 2.8 percent to $98,122. These statistics, however, are averages and are skewed by larger, i.e. commercial, farm operations. The median, or midpoint of the distribution, is a more accurate indicator of income for most U.S. farmers and ranchers.
USDA’s ERS data on farm household income indicates that, since 1996, the earliest data available, more than 50 percent of farm households lose money from farming – meaning on-farm income is negative. USDA ERS’s data on median on-farm household income confirms the median farm income has been negative. Median on-farm household income has ranged from a low of -$3,040 in 2008 to -$118 in 2014, and averaged -$1,569. Median farm income in 2018 is projected at -$1,316 dollars per household, down 13 percent from 2017, and the lowest level in the last six years, Figure 2.
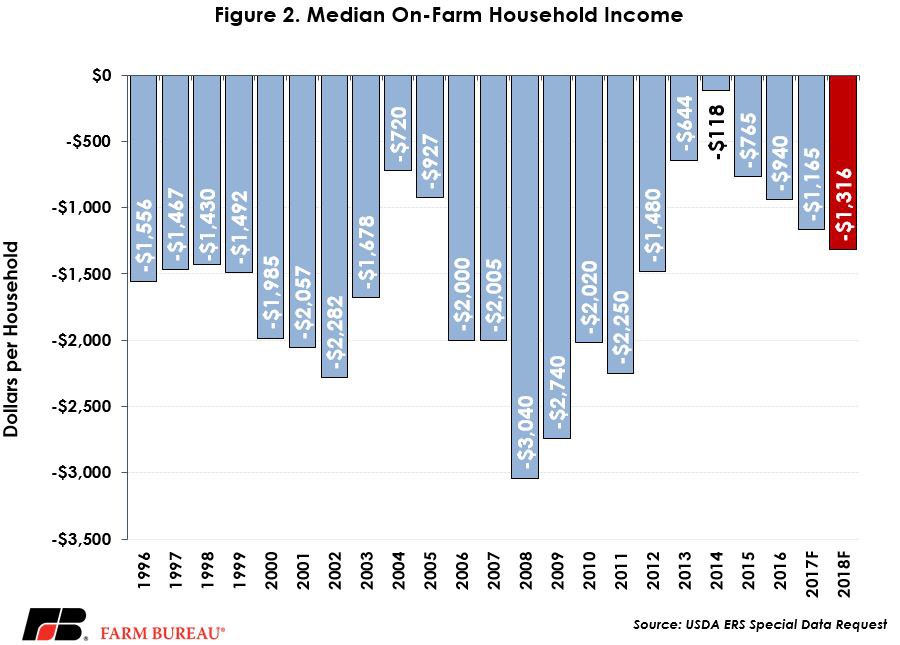
Over half of farms are what USDA describe as residence farms – those earning less than $350,000 in gross cash farm income and where the primary occupation of the principal operator is something other than farming, i.e. off-farm occupation or retired. Had it not been for off-farm income, many of these households would lose money each year running a farm operation. Median off-farm income is projected at $69,940, up 2.8 percent from 2017 levels, and total household income is projected at $78,886, up 2 percent from last year.
For commercial farm operations – those with over $350,000 is gross cash farm income – USDA data indicates that the median household income from farming was slightly more than $140,000 in 2016, and represented a majority of farm household income.
Implications
Following years of declines in net farm income and median farm household income, farm debt levels have accelerated. Farm debt in 2018 is forecast at a record $389 billion, up nearly $4 billion from 2017’s record-high. The primary source of farm debt is real estate debt. Farm real estate debt in 2018 is projected at a record $239 billion, up $2.9 billion from last year. Non-real estate debt is also projected to be record-high at $150 billion but it remains in line with prior-year levels, Figure 3.
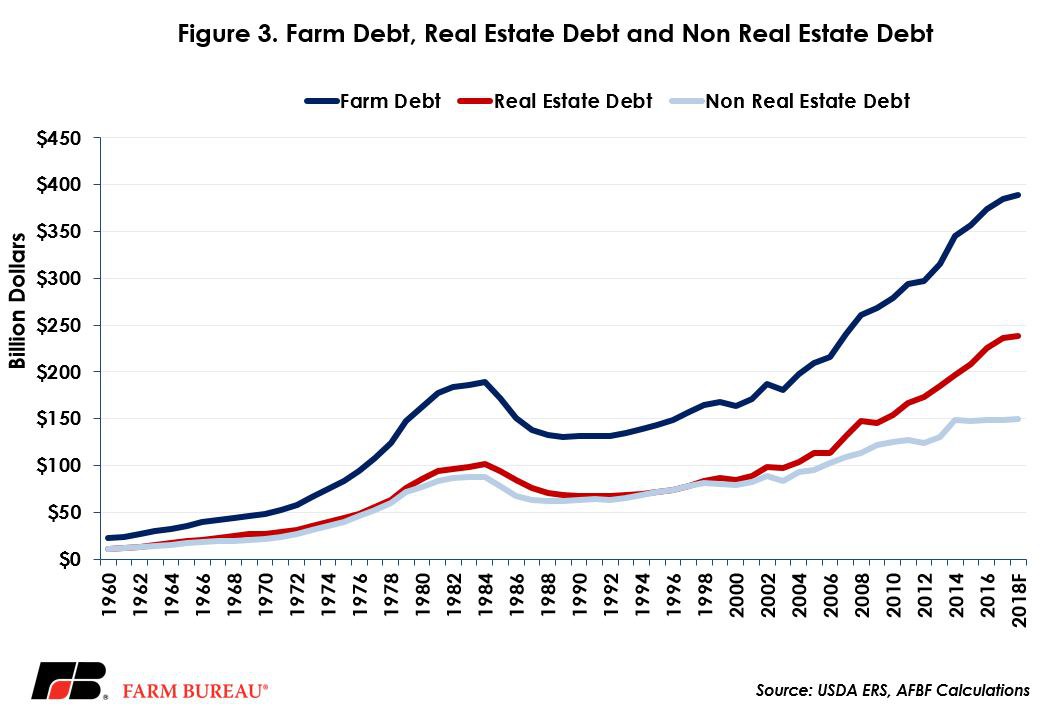
Despite farm debt increasing in 2018, debt-to-asset ratios are projected to decline by 0.8 percentage points to 12.6 percent. The debt-service ratio, which measures the proportion of farm production needed to service debt, increased slightly to 27.2 percent. These levels remain well below their historical highs, but with projections for commodity prices to remain flat over the next decade, these farm financial indicators are important to monitor.
Lower farm income and rising debt levels are continuing to be a concern for U.S. agriculture. While median sized farm households have higher average and median income levels than the average U.S. household, it is not due to income streams from farming. Rather, USDA data indicates that median income related to farming has been negative for more than two decades – putting financial pressure on the farm economy and rural America.
The challenging financial situation in U.S. agriculture highlights the need for improved access in key foreign markets, continued investments and commitments to renewable energy sources produced by farmers and ranchers, reduced regulatory burdens that increase the costs of farming, and on time completion of the 2018 Farm Bill. Combined, these efforts will go a long way toward improving the farm economic outlook.
Top Issues
VIEW ALL