One of These Days
Bob Young
President

photo credit: North Carolina Farm Bureau, Used with Permission
Bob Young
President
“One of these days.” If you’re a fan of classic TV, you’re likely to think of “The Honeymooners” when you hear this phrase. If music is your thing, it could be Pink Floyd’s instrumental classic or Tim McGraw’s song of the same name. My economist mind jumps to the general economy.
We are now 111 months past the last recession—the second-longest growth period for the U.S. economy. The 120-month period from March 1991 to March 2001 holds the record. Thus, the title – “One of these days.”
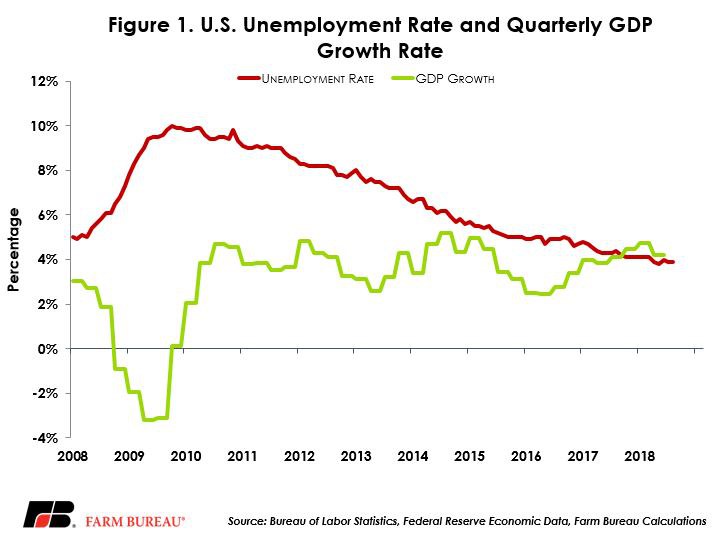
Do not in any way take this as a forecast of an upcoming recession. There are many, many indicators suggesting the economy is doing quite well. For one, over 200,000 new jobs were created in August and the current unemployment level of 3.9 percent is among the lowest in the last 17 years. In addition, gross domestic product growth was over 4 percent in the second quarter of the year and is expected by many to come in above 3 percent for the year overall. Wage growth in August was just a shade under 3 percent, the highest monthly rise in wage rates since June 2009. With that, consumer spending continued to rise by 0.4 percent in July-over-June levels, maybe not as strong as a few months back, but still respectable. The Dow Jones Industrial Index is at or near record highs depending on the day of the week. Figure 1 highlights the U.S. unemployment percentage and the quarterly GDP growth rate.
Whenever all the indicators are pointing in one direction, however, it is probably time to at least start thinking about what might happen “one of these days.”
Multiple recent business news articles discuss the concept of an inverted yield curve, which occurs when long-term interest rates— 10 to 30 year—are higher than the Federal Reserve overnight rate or other short-term notes. This has historically been a key indicator of an upcoming recession or downturn in the economy. The regular discussion of the Fed raising its overnight rates has prompted much of this conversation.
Starting in 1999, the Fed boosted its overnight rate, moving from 4.5 percent in January 1999 to 6.5 percent by June 2000. Long-term rates started falling in February 2000, with the curve moving to a consistent inverted position in June. The recession officially started less than a year later, in March 2001.
We have a long way to go to see an actual inversion. The gap between the federal funds rate and the 10-year interest rate, for example, is around 100 basis points. Instead what we have now is what Robert Dieli, president of No Spin Forecasts, calls a compression of the yield curve. As such, we’re looking to see if the long end of the yield curve will rise in conjunction with the Fed’s action or if it will flip and drive long-term rates below the Fed’s target. Even if we were to end up with an inversion, it would likely be months, or even more than a year, before the economy enters a contraction phase.
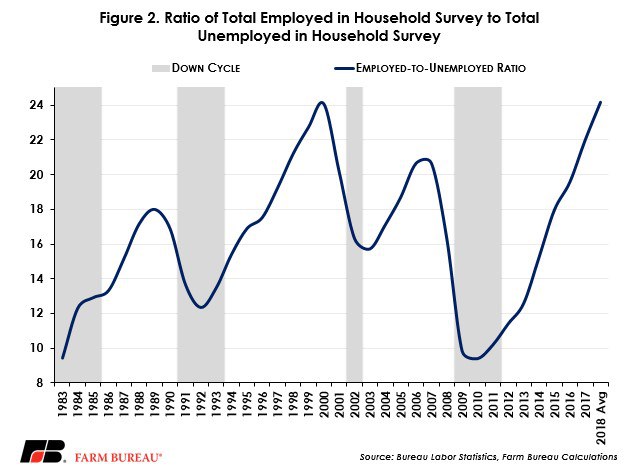
Another indicator is the tightness growing in the labor markets. Since the 1970s, every time the ratio of full-time employed-to-unemployed has peaked, we have a recession within a few months, Figure 2. The June number came in lower than May, only to see the July number hit a new high. The August figure was marginally lower than July. If we consistently see that number show weakness relative to the previous month’s, we have another significant sign that “one of these days” may be sooner, rather than later. If we go the other direction, we are moving into territory not seen in almost two decades.
Summary
Again, no forecast for impending doom here. The economy is ticking along very nicely, thank you. Job growth, wage rates, overall inflation and any number of other indicators suggest we have at least several more months of solid economic news ahead. But farmers tend to watch those clouds on the horizon for a reason.
Top Issues
VIEW ALL