Organic Produce Sales, Movin’ On Up
TOPICS
Vegetables
photo credit: North Carolina Farm Bureau, Used with Permission
Veronica Nigh
Senior Economist
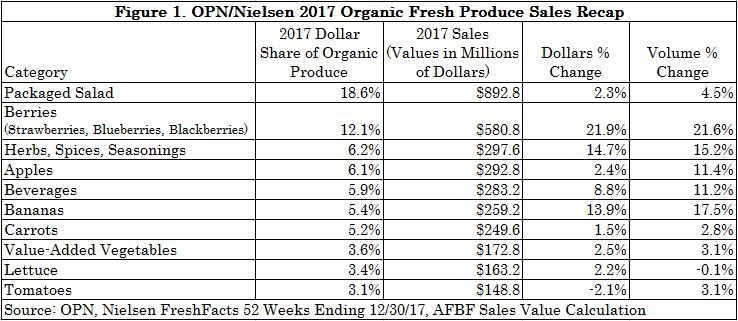
The Organic Produce Network in partnership with Nielsen released 2017 figures on sales of fresh organic produce sold in grocery stores. The figures are impressive. Overall, organic fresh vegetable sales led the produce sector with $2.4 billion in sales, up 6 percent by volume and 4 percent by value from 2016. Organic fresh fruit with sales of $1.6 billion showed stronger growth, with volume and dollar sales up 12.6 percent compared to 2016.
Data on production and sales of organic food products at the farm level is harder to come by than data in some other areas of agriculture. The latest production from USDA is from the 2014 Organic Survey. Certainly any data collected by USDA, no matter the frequency, is helpful, but to track more granular trends, the industry turns to private data. The data mentioned above, collected by OPN and Nielsen, is proprietary so we are not able to dive as deeply into it as we might otherwise, but the headlines are interesting.
If we compare OPN/Nielsen’s data to USDA’s 2014 Organic Survey we notice a few significant changes. When USDA released the results of their survey the top organic produce by sales were, in order: lettuce ($264 million), apples ($250 million), grapes ($195 million), spinach ($117 million), strawberries ($89 million), broccoli ($79 million), carrots ($69 million), sweet potatoes ($68 million) and blueberries ($61 million).
It is dangerous to directly compare the sales value results of USDA’s Organic Survey to OPN/Nielsen’s results because they aren’t measuring sales at the same sales point. USDA’s survey measures the value of organic sales at the producer level. OPN/Nielsen measures sales at the retail level. As producers were are well aware, the farm value share of a retail basket of food is pretty low. USDA estimates that the farm share for fresh vegetables and fruit was 28 percent and 38 percent, respectively, in 2015, the latest data available.
Why mention the two side by side then? The two lists are compared because the ordering of top crops is pretty interesting and can give us an idea of where the industry is heading. If we compare the USDA and OPN/Nielsen list of top produce, berries quickly stand out. Even when the USDA sales data for strawberries and blueberries are combined, the berries category was only the fourth largest sales category in 2014. According to OPN/Nielsen, last year berries were the second largest sales category. That’s pretty incredible growth over three years. In fact berry sales growth is pretty incredible growth over a single year. According to the OPN/Nielsen data, berry sales value and volume increased by nearly 22 percent between 2016 and 2017.
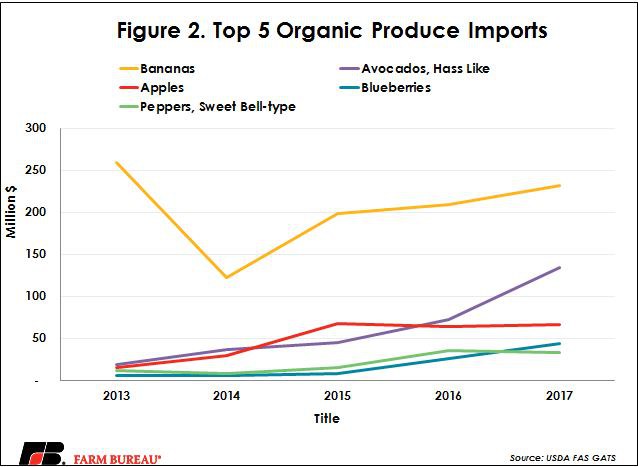
While we don’t have annual organic production data from USDA we do have annual trade data on a few organic produce items. In 2011, the U.S. Department of Commerce began adding codes for selected organic products to the U.S. trade code system in 2011, and the tracked value of organic imports and exports has been increasing. The organic produce items that Commerce tracks are: bananas, avocados, apples, blueberries, bell peppers, shelled almonds, garlic, pears, mangoes and quinces. U.S. imports by value of these select organic products, $614 million in 2017, were 23 percent higher than in 2016. Certified organic blueberry imports were among the top gainers, with a 74 increase in import value between 2016 and 2017. What is clear from OPN/Nielsen and the trade data is that Americans have an incredible, growing demand for organic berries, domestic and foreign.