Proposed Rule for H-2A Wage Differentiation Means Higher Outlays for Farmers
TOPICS
Market IntelAFBF Staff

photo credit: AFBF Photo, Terri Moore
On Dec. 1, the Department of Labor published a proposed rule that would amend its regulations regarding certain provisions of the H-2A program. Among the many changes in the proposed rule are revisions to the methodologies used to determine the Adverse Effect Wage Rate. Rather than a single AEWR for all H-2A workers within a region, DOL has proposed AEWRs by agricultural occupation. The proposal reflects the department's concern that the current AEWR methodology for field and livestock workers (combined) may have an adverse effect on the wages of workers in higher-paid agricultural occupations, such as farmworker supervisors and construction laborers on farms. Following the methodology supplied by DOL in the proposed rule, this Market Intel will look at what the proposal means for farms utilizing the H-2A program.
Current Procedures
The current AEWR is based on data from the Farm Labor Survey, a USDA survey conducted in January, April, July and October of each year that provides estimates of the number of hired workers, average hours worked and wages paid to workers employed on U.S. farms. Hired workers include field workers, livestock workers, supervisors, administrative employees and other workers employed directly by farmers. Field and livestock workers include employees who operate farm equipment. The FLS excludes contract workers who are paid by a crew leader, contractor, buyer, processor, cooperative or other person who has an oral or written agreement with a farmer/rancher.
Approximately 18,000 operations participated in the most recent, July and October 2021 surveys. The survey includes both full-time and part-time workers, as well as workers who work either part-year or year-round. Wages consist of cash wages before taxes and other deductions. Wages not paid on an hourly basis (e.g., a salary or piece rate) are converted to hourly rates. Average hourly wages are total wages by type of worker (i.e., crop, livestock and all hired workers) divided by total hours worked. Wages do not include fringe benefits, bonuses, housing or meals.
The quarterly data is utilized to create estimates of average hourly wages for field and livestock workers for 15 farm labor regions that encompass 46 states. Separate estimates are published for California, Florida and Hawaii. Alaska is not included in the survey. The November Farm Labor Report includes an estimated annual hourly wage for field and livestock workers (combined) based on a weighted average of the quarterly survey results. The combined field and livestock worker wage rate, published in the November FLR, is the basis for the AEWR for the next year.
The AEWR is the same for each state within a region; for example, Oregon and Washington, which are both in the Pacific Region have the same AEWR. Similarly, the Northeast I Region AEWR is the same for Connecticut, Maine, Massachusetts, New Hampshire, New York, Rhode Island and Vermont. Nationwide, there may be up to 18 different adverse effect wage rates (i.e., if the rates are different for each of the 15 regions and the three states that are reported separately).
Currently, the AEWR for each state or region is published annually as a single average hourly gross wage for all agricultural workers in a given state or region, without regard to occupational classification. Perhaps in preparation for future questions about differing wage rates based on occupation, in 2014 the FLS also began asking respondents to report the number of hired workers and their wage rates by the Standard Occupational Classification system. SOC codes include: Graders and sorters, agricultural products (42-2041); Agricultural equipment operators (42-2091); Farmworkers, crop, nursery, and greenhouse (42-2092); Farmworkers, farm, ranch, and aquacultural animals (42-2093); Agricultural workers, all other (42-2099); Packers and packagers, hand (53-7064); Farmers, ranchers and other agricultural managers (11-9013); and First-line supervisors of farming, fishing workers (45-1011).
New Proposal
The rule proposed by DOL in December 2021 would keep the single AEWR for the majority of field and livestock workers represented by six SOC codes, while shifting AEWR determinations to the Department's Bureau of Labor Statistics Occupational Employment and Wage Statistics survey (formerly the Occupational Employment Statistics survey) for all other occupations for which the FLS does not adequately collect or consistently report wage data at a state or regional level. In the Federal Register notice, DOL states that the impetus for the proposed change is based upon the department’s concern that the use of a single AEWR for all workers in the H-2A program may adversely affect wages in certain occupations.
The six SOC codes that maintain the single AEWR structure are: Graders and sorters, agricultural products, 45-2041; Agricultural equipment operators, 45-2091; Farmworkers, crop, nursery, and greenhouse, 45-2092; Farmworkers, farm, ranch, and aquacultural animals, 45-2093; Agricultural workers, all other, 45-2099; and Packers and packagers, hand, 53-7064. According to DOL, these six codes represent 98% of workers employed in H-2A job opportunities. However, H-2A data is notoriously opaque – there hasn’t been a public annual report on the program since fiscal year 2016 – and as a result, private analysts must rely on the data that is available in the FLS.
Of the 772,000 workers surveyed in the October 2021 survey, 693,000 were classified via the SOC system. Of those 693,000 workers, the SOC position breakdown was as follows: Graders and sorters, agricultural products, 45-2041 (13,000; 2% of total); Agricultural equipment operators, 45-2091 (136,000; 20%); Farmworkers, crop, nursery, and greenhouse, 45-2092 (373,000; 54%); Farmworkers, farm, ranch, and aquacultural animals, 45-2093 (150,000; 22%); Agricultural workers, all other, 45-2099 (8,000; 1%); Packers and packagers, hand, 53-7064 (13,000; 2%); Farmers, ranchers, and other agricultural managers, 11-9013 (23,000; 3%); and First-line supervisors of farming, fishing workers, 45-1011 (20,000; 3%). The remaining 36,000 workers, or 5% of those surveyed, were not classified.
All this to say, according to FLS data, 90% of surveyed workers were classified as working one of the six job codes that will remain under the single AEWR structure. The remaining 10% of workers would now be subject to wages set by utilizing the OEWS source, with each SOC job code having a separate AEWR. This approximate 90%/10% ratio is consistent over the last five years of FLS reports.
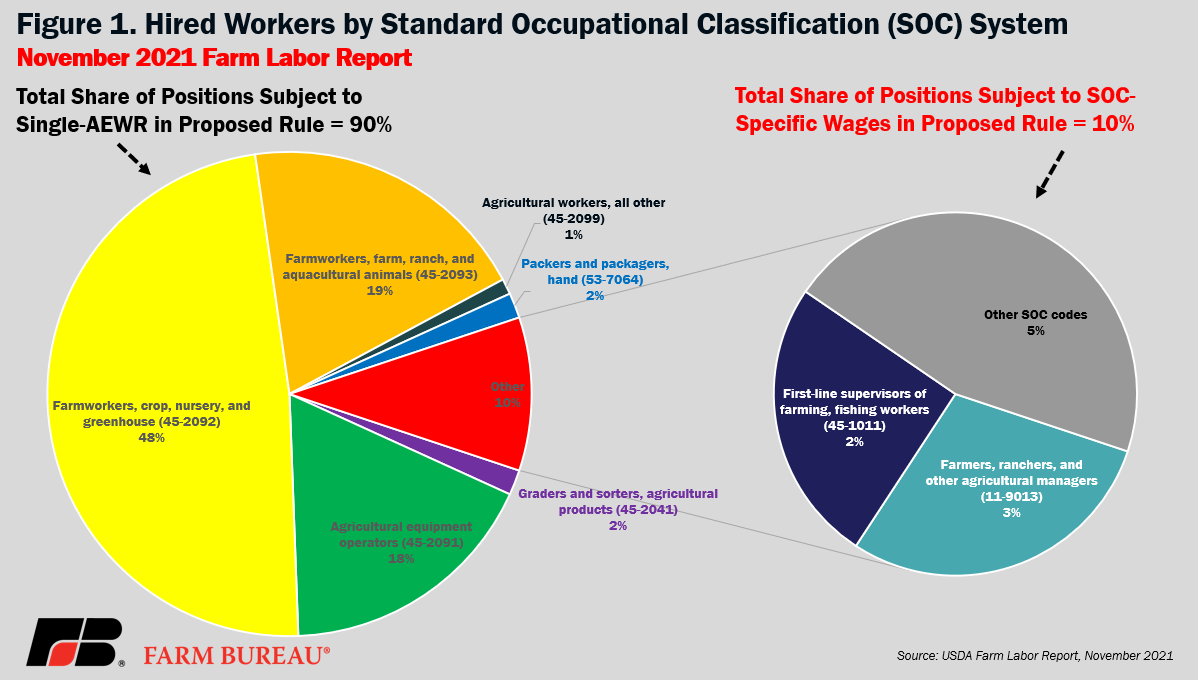
It is important to note that the FLS reports collected data for Farmers, ranchers, and other agricultural managers, 11-9013 (23,000; 3%) and First-line supervisors of farming, fishing workers, 45-1011 (20,000; 3%). However, DOL notes in the FR notice that the FLS has not been able to report a statistically valid wage result for supervisors, managers and the other 5% of workers not classified by SOC in the FLS. As a result, the wages of this 10% of the workforce are currently only reported in the “all hired workers” category and are not included in the “field and livestock workers (combined)” category that the department uses to establish the AEWR. This is the justification for utilizing the OEWS source for establishing position-specific AEWRs for 10% of the workforce.
While the proposed rule establishes that state-level OEWS wage rates will be utilized for establishing the position-specific wage rates when available, reviewing the national average wages rates for specific SOCs relative to the national average AEWR is a helpful point of comparison to generally understand the potential impact of the proposed rule. As can be seen in Table 1, wage rates for the five often quoted SOCs are all significantly higher than the AEWR. Obviously, the larger the share of workers that would now be classified as completing jobs outside of the six SOC codes that will maintain the single AEWR structure, the larger the overall increase in salary outlays for H-2A participating farms.
| 2016 | 2017 | 2018 | 2019 | 2020 | ||
|---|---|---|---|---|---|---|
| AEWR | National Average AEWR | $11.74 | $12.20 | $12.47 | $13.25 | $13.99 |
| SOC | Description | 2016 | 2017 | 2018 | 2019 | 2020 |
| 11-9013 | Farmers, Ranchers, and Other Agricultural Managers | $36.44 | $38.62 | $38.43 | $38.63 | $36.93 |
| 45-1011 | First-Line Supervisors of Farm Workers | $23.47 | $24.11 | $24.42 | $25.25 | $26.16 |
| 53-3032 | Heavy and Tractor-Trailer Truck Drivers | $20.96 | $21.39 | $21.91 | $22.52 | $23.32 |
| 53-3033 | Light Truck Drivers | $16.73 | $17.12 | $17.75 | $18.52 | $19.74 |
| 47-2061 | Construction Laborers | $18.22 | $18.70 | $19.40 | $20.06 | $20.67 |
One final significant change that will have wage impacts for farmers and the H-2A workers they employ is the department’s proposal to assign the highest AEWR for all SOCs applicable to job opportunities covering multiple SOCs. What does that mean in non-governmentese? It means that if a farmer has a worker doing multiple jobs on the farm, a very common occurrence on almost all farms, the worker must be paid the highest wage rate all the time. For example, a farmer asks a worker who spends 80% of their time picking tomatoes, work in line with job code 45-2092 (farmworkers, crop, nursery, and greenhouse), to also move the truck that is being loaded with full crates of harvested tomatoes from row to row as harvesting is completed. In this scenario, the 20% of the time spent moving the truck is classified as work completed in line with job code 53-3033 (light truck driver). The national average wage rate for light truck drivers according to OEWS in 2020 was $19.74, compared to the national average AEWR of $13.99. The proposed rule would dictate that the farmer pay the worker the light truck driver wage rate for 100% of the worker’s time – a 41% increase in pay.
According to DOL’s assessment, the total impact of the rule change would be fairly insignificant. “While the Department remains sensitive to concerns of employers regarding increases in the FLS-based AEWRs, the Department believes… that the approach proposed in this rulemaking best allows the Department to fulfill its statutory mandate. The concerns about AEWR increases also appear overstated when considering long-term historical trends in agricultural worker wages and the agricultural labor market.” DOL goes on to selectively quote USDA ERS, “[A]lthough farm wages are rising in nominal and real terms, the impact of these rising costs on farmers’” incomes has been offset by rising productivity and/or output prices,” and adding that “labor costs as a share of gross cash income do not show an upward trend for the industry as a whole over the past 20 years.”
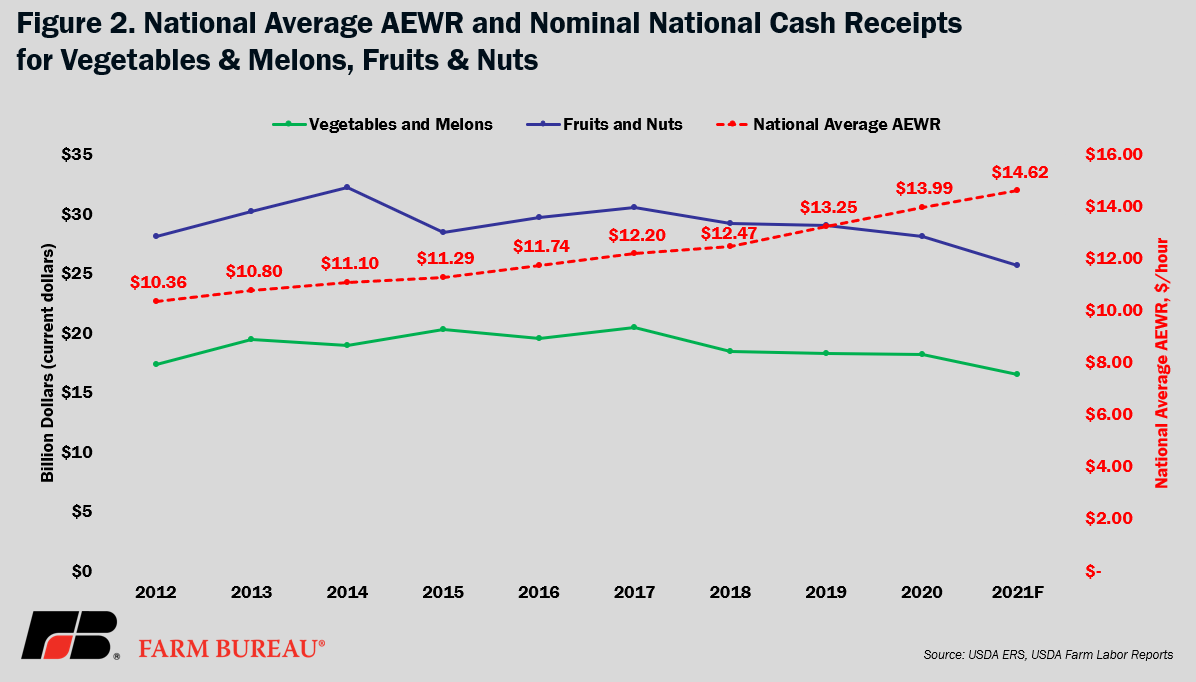
A more complete quote of the ERS source reads, “[T]rends in labor cost shares differ by commodity. Labor cost shares have fallen slightly over the past 20 years for the more labor-intensive fruit and vegetable sectors, although they appear to have been trending upwards again in the past few years. On dairies and in nursery operations, both of which also rely heavily on immigrant labor, labor costs as a share of income are at or near their 20-year highs.” To put a finer point on this argument, while the estimate reported for 2019 (the estimate reported for 2019 is the average over 2017-19, the most recent available) for “all farms” is 10.4%, the share for nursery and greenhouse is 32.8%, fruit and tree nut is 29.7% and vegetable and melon is 22.4%. This differentiation by subsector is important and relevant because it is these three subsectors that employ the vast majority of H-2A workers.
The latest data available in the ERS source referenced above and by DOL in the proposed rule was from 2019. In Figure 2, the observation by ERS in the source above that labor costs “appear to have been trending upwards again in the past few years” has continued, as reflected by an increasing national average AEWR, while cash receipts for fruits and nuts and vegetables and melons have continued to trend downwards. USDA’s forecasted 2021 cash receipts for fruits and nuts are 19% lower than 2017. USDA’s forecasted 2021 cash receipts for vegetables and melons are 16% lower than 2017. Meanwhile, the national average AEWR ($14.62) in 2021 is 20% higher than the national average AEWR ($12.20) in 2017.
Impact of Proposal
It can be tempting to look at the FLR and conclude that the proposed change would impact only 10% of employees and conclude that impact will be relatively small. However, this type of analysis tends to underestimate the fact that impacts are felt differently on farms of different type and different size. A sample farm approach more fully captures this nuance, as shown below.
The wage expenditure for a fruit and/or vegetable farm in each state is estimated for two example operations – a small crop farm with 10 H-2A workers and a larger crop farm with 70 workers – over the 2018-2020 time period using the current codification of the law (a single AEWR for all positions) and the new proposal. It is important to note that the classification of workers changes some in the estimate in order to reflect the change of assigning the highest AEWR for all SOCs applicable to job opportunities covering multiple SOCs. To reflect this change, three workers in the large farm example and one worker in the small farm example that were previously classified as farmworkers (SOC 45-2092) are now re-classified as light truck drivers (SOC 53-3033), as discussed in the example situation above. The differences between the current classification and the proposed classification are underlined in the proposed rule classification.
Large farm with 70 H-2A workers (current classification):
- 60 workers classified as Farmworkers - Crop, Nursery and Greenhouse (SOC 45-2092), each working 42 hours per week for a total of 2,520 hours per week, paid the current single AEWR rate;
- 3 workers classified as First-Line Supervisors of Farm Workers (SOC 45-1011), each working 50 hours per week for a total of 150 hours per week, paid the current single AEWR rate;
- 3 workers classified as Agricultural Equipment Operators (SOC 45-2091), each working 42 hours per week for a total of 126 hours per week, paid the current single AEWR rate; and
- 4 workers classified as Graders and Sorters - Crop, Nursery and Greenhouse Products (SOC 45-2041), each working 50 hours per week for a total of 200 hours per week, paid the current single AEWR rate.
Large farm with 70 H-2A workers (proposed rule classification):
- 57 workers classified as Farmworkers - Crop, Nursery and Greenhouse (SOC 45-2092), each working 42 hours per week for a total of 2,394 hours per week, paid the current single AEWR rate;
- 3 workers classified as Light Truck Drivers (SOC 53-3033), each working 42 hours per week for a total of 126 total hours per week, paid the state-level OEWS wage in states with state-level wage available and the national-level OEWS wage in states without a state-level wage;
- 3 workers classified as First-Line Supervisors of Farm Workers (SOC 45-1011), each working 50 hours per week for a total of 150 total hours per week, paid the state-level OEWS wage in states with state-level wage available and the national-level OEWS wage in states without a state-level wage;
- 3 workers classified as Agricultural Equipment Operators (SOC 45-2091), each working 42 hours per week for a total of 126 total hours per week, paid the current single AEWR rate; and
- 4 workers classified as Graders and Sorters - Crop, Nursery and Greenhouse Products (SOC 45-2041), each working 50 hours per week for a total of 200 total hours per week, paid the current single AEWR rate.
Small farm with 10 H-2A workers (current classification):
- 8 workers classified as Farmworkers - Crop, Nursery and Greenhouse (SOC 45-2092), each working 42 hours per week for a total of 336 hours per week, paid the current single AEWR rate;
- 1 worker classified as a First-Line Supervisor of Farm Workers (SOC 45-1011), working 50 hours per week, paid the current single AEWR rate; and
- 1 worker classified as an Agricultural Equipment Operator (SOC 45-2091), working 42 hours per week, paid the current single AEWR rate.
Small farm with 10 H-2A workers (proposed rule classification):
- 7 workers classified as Farmworkers - Crop, Nursery and Greenhouse (SOC 45-2092), each working 42 hours per week for a total of 294 hours per week, paid the current single AEWR rate;
- 1 worker classified as a Light Truck Driver (SOC 53-3033), working 42 hours per week, paid the state-level OEWS wage in states with state-level wage available and the national-level OEWS wage in states without a state-level wage;
- 1 worker classified as a First-Line Supervisor of Farm Workers (SOC 45-1011), working 50 hours per week, paid the state-level OEWS wage in states with state-level wage available and the national-level OEWS wage in states without a state-level wage; and
- 1 worker classified as an Agricultural Equipment Operator (SOC 45-2091), working 42 hours per week, paid the current single AEWR rate.
On average, the changes to job classification and wage source outlined above would have resulted in the large farm paying 7% more in wages per week in 2018 and 2019 and 6% more in 2020. On average, the changes to job classification and wage source outlined above would have resulted in the small farm paying 16% more in wages per week in 2018 and 2019 and 15% more in 2020. While these increases are not insignificant, knowing the range of increase is also important. In the large farm example, the range of increase was 4-11% in 2018, 4-12% in 2019 and 4-9% in 2020. In the small farm example, the range of increase was 9-26% in 2018, 9-27% in 2019 and 9-21% in 2020. In Table 2, the increase in total wages paid per week for a sample large farm is given for each state. In Table 3, the increase in total wages paid per week for a sample small farm is given for each state.
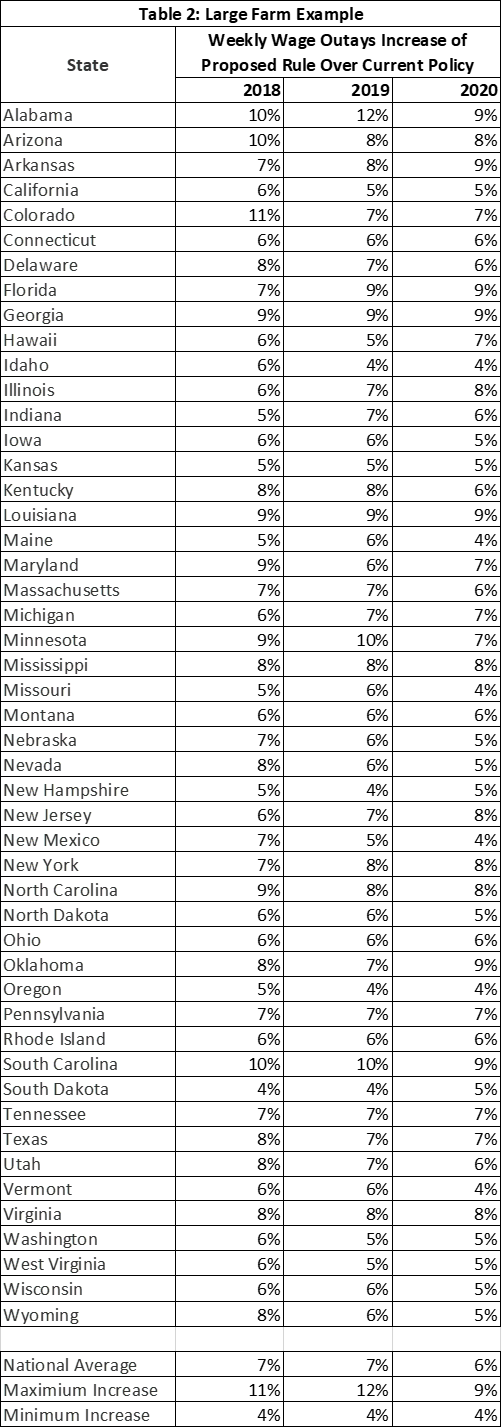
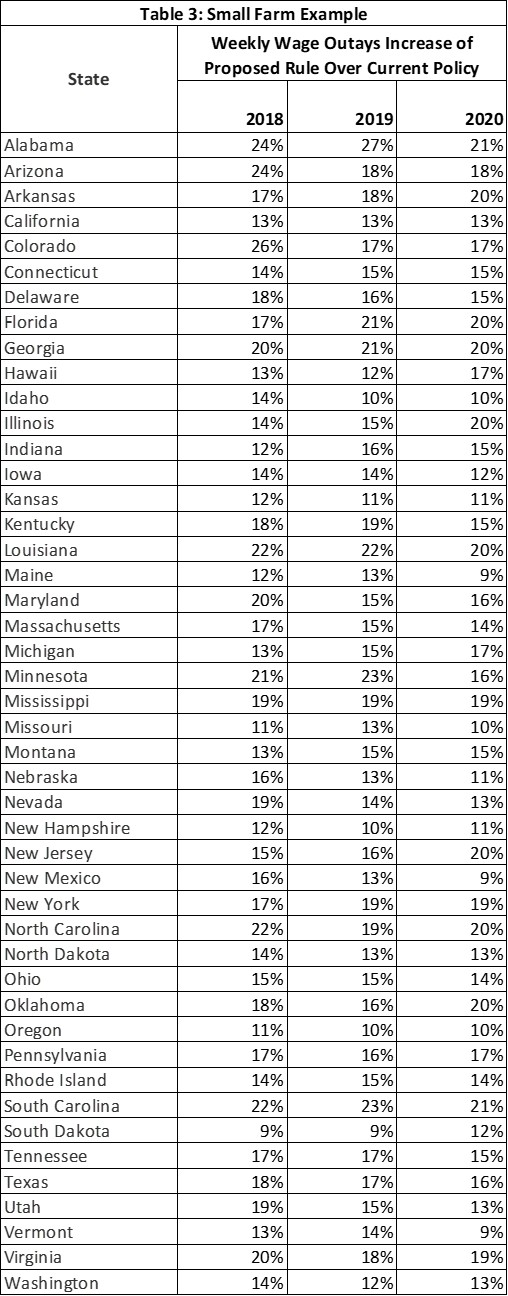
A common complaint among users of the H-2A is that in recent years the considerable year-to-year variations in the AEWR in some regions makes planning difficult for farmers. For example, the 2021 AEWR of $15.54 for the Northeast II region, which includes Delaware, Maryland, New Jersey and Pennsylvania, was $2.20 per hour, or 16.5%, higher than the 2020 AEWR of $13.34. This significant, double-digit increase from 2020 to 2021 followed a 1.4% increase from 2019 to 2020 and a 9.1% increase from 2018 to 2019. Reducing some of the variation in payroll expenses from year to year would be a welcome outcome of the proposed rule. Unfortunately, as demonstrated in Table 2 and Table 3, the proposed rule does not accomplish this goal.
Finally, currently with the single AEWR for all positions, farmers know the AEWR for the following year when the November FLR is released. The proposed rule would change the single-release nature. The department proposes to make the updated AEWRs effective through two announcements in the Federal Register, one for the AEWRs based on the FLS (i.e., effective on or about Jan. 1), and a second for the AEWRs based on the OEWS survey (i.e., effective on or about July 1), due to the different time periods for release of these two wage surveys. Two different pay change dates will certainly be an administrative hassle for farmers.
Conclusion
To alleviate concerns about potential adverse effects on the wages of workers in higher-paid agricultural occupations, DOL is proposing a new AEWR methodology that would establish separate AEWRs by agricultural occupation for positions outside of the six SOC codes that will maintain the single AEWR structure. This change will lead to higher wage expenditures than anticipated by DOL and introduce additional administrative burdens for farms that utilize the H-2A program. The window to submit written comments on the proposed rule closes Jan. 31.
Top Issues
VIEW ALL