Reviewing 2017 Crop Insurance Prices
TOPICS
USDA
photo credit: North Carolina Farm Bureau, Used with Permission
John Newton, Ph.D.
Vice President of Public Policy and Economic Analysis
On average, the majority of corn, cotton and soybean crop insurance revenue protection policyholders purchase the harvest price option. Each year, farmers pay billions of dollars in premiums for this feature that may provide additional financial risk coverage in the event of crop loss. The harvest price option provides protection on yield declines at the higher of the spring planting price or the price during harvest.
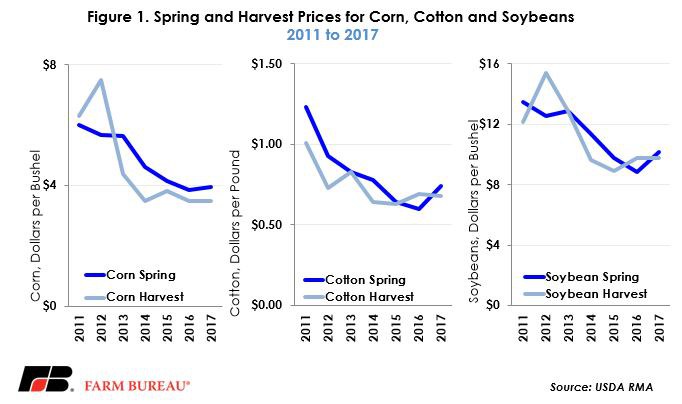
Spring prices for corn and soybeans are determined by averaging the new-crop futures contract settlement prices (December for corn and cotton and November for soybeans) during the month-long February price discovery period. Harvest prices are determined by averaging the same new-crop futures during the month-long October price discovery period. The spring prices announced in March 2017 were $3.96 per bushel, 74 cents per pound and $10.19 per bushel, respectively, for corn, cotton and soybeans.
At the beginning of November, USDA’s Risk Management Agency announced the harvest prices for corn, cotton and soybeans at $3.49 per bushel, 68 cents per pound and $9.75 per bushel, respectively. Harvest prices for corn and soybeans are unchanged from 2016 levels. For corn, the harvest price was 47 cents per bushel below the spring price and marks the fifth consecutive year that harvest prices have been below the spring prices established in February. For cotton, the harvest price was 6 cents per pound below the spring price. For soybeans, the harvest price was 44 cents per bushel below the spring price. Spring and harvest prices are presented in Figure 1. The decline in harvest prices was anticipated given projections for a record soybean crop, the third-largest corn crop in U.S. history, and the highest level of cotton production since 2006.
The harvest price option provides protection on crop losses at the higher of the spring or harvest price and may assist growers by indemnifying at the replacement value of the crop. For farmers delivering under the terms of a forward contract with physical delivery or for livestock producers using the crops as livestock feed, the replacement value of lost production is a critical risk management tool and justifies the harvest price option. Without the harvest price option, farmers would need to replace lost production at a time when market prices are likely the highest.
Harvest prices for corn have increased two of the last six years and, when triggered, have increased the insurance price by 19 percent or $1.07 per bushel. For cotton, and since 2011, the harvest price option was triggered only in 2016 and added 9 cents per pound to the revenue insurance. For soybeans, the harvest price option has been triggered in two of the last six years, increasing the insurance price by 16 percent or $1.87 per bushel. The harvest price option is likely to provide the greatest benefit during short crop years when growers are faced with poor yields and high replacement costs.
Breakeven Crop Yields
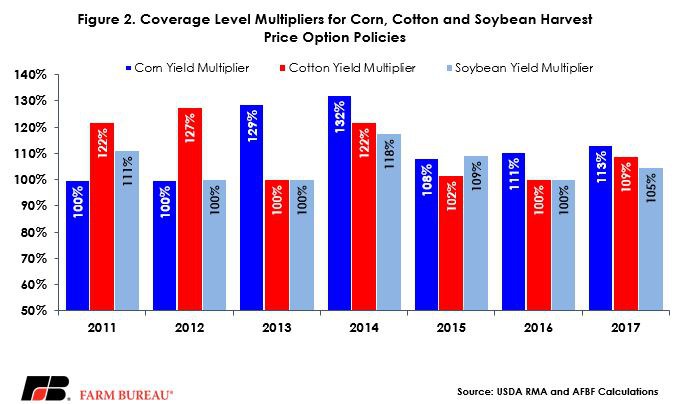
For 2017 corn, cotton and soybean policyholders the crop insurance guarantee will be based on the higher spring price of $3.96 per bushel, 74 cents per pound and $10.19 per bushel, respectively. However, when the harvest price is below the spring price, yield declines do not need to be as large in order to trigger indemnities due to implied coverage level multipliers. Coverage level multipliers, defined as the maximum of the spring price and the harvest price divided by the harvest price, boost yield coverage when the spring price is greater than the harvest price. When the harvest price is greater than the spring price, coverage level multipliers equal zero.
For 2017 corn policies the coverage level multiplier is equal to 113 percent, 1.13 = 3.96/3.49. For 2017 cotton policies the coverage level multiplier is equal to 109 percent, i.e. 1.19 = 0.74/0.68. For 2017 soybean policies the coverage level multiplier is equal to 105 percent, i.e. 1.05 = 10.19/9.75. Coverage level multipliers for corn, cotton and soybeans policies are presented in Figure 2.
The coverage level multipliers can then be multiplied by the declared coverage level to determine how far actual yields need to fall below the APH yield to trigger indemnities. For example, using the 2017 coverage level multipliers, a corn crop insurance policy with an 85 percent coverage level will trigger an indemnity when the actual yield is less than 96 percent of the APH yield, i.e. 0.96 = 1.13 X 0.85. Similarly, a cotton crop insurance policy will trigger an indemnity when the actual yield is less than 93 percent of the APH yield, i.e. 0.93 = 1.09 X 0.85. Finally, a soybean crop insurance policy at 85 percent coverage will trigger an indemnity when the actual yield is less than 89 percent of the APH yield, i.e. 0.89 = 1.05 X 0.85. As a result, for 2017, actual crop yields above the coverage-level-adjusted APH yield may still trigger indemnities for some growers depending on the degree of crop loss.
Implications
For the 2017/18 crop year, bin-busting crops are once again expected. These large crops are driven by higher soybean acreage, higher cotton acres and yields, and above-trend crop yields. This may be the case on the national level but regional yield shocks were experienced in drought-stricken areas such as the High Plains or in hurricane-devastated areas of east Texas. In these areas crop yields are more likely to be below the APH yield given positive coverage level multipliers. In other areas where yields were more favorable crop insurance indemnities may be less likely.
Finally, with respect to 2018 corn and soybean acreage intentions, an interesting observation emerges when reviewing the harvest time soybean-corn price ratio. The current ratio stands at 2.79, the highest level since 2013’s 2.93. Following 2013, soybean acres in 2014 climbed 8 percent or more than 6 million acres.
While it’s hard to see soybean acres climbing much above the 2017 record, the current price ratio suggests corn may need to “buy” some acres in 2018 if it wants to remain king corn for a 35th consecutive year. While early, corn bidding away acres is indeed confirmed when evaluating the new-crop 2018 soybean-corn price ratio of 2.52. Even if corn is successfully able to pull acres out of soybeans, the market still expects lofty soybean acreage in the 86 to 90 million-acre range.
Top Issues
VIEW ALL