SNAP – It Ain’t Just For Cities

photo credit: Alabama Farmers Federation, Used with Permission
John Newton, Ph.D.
Vice President of Public Policy and Economic Analysis
The Supplemental Nutrition Assistance Program (formerly the Food Stamp Program) is the nation's largest domestic food and nutrition assistance program for low-income Americans. Program participants include women, children, the elderly, and military veterans and their families. SNAP offers nutrition assistance to millions of eligible, low-income individuals and families and provides economic benefits to communities. People have long associated SNAP recipients with urban communities, especially when it comes to farm bill negotiations and the historical partnership between farm policy and nutrition programs. However, data reveal that residents of rural communities depend on SNAP as much as, and potentially more than, their urban counterparts.
Each year, millions of low-income individuals and families receive nutrition assistance. USDA’s Food and Nutrition Service SNAP participation and costs data reveal that in 2016 the average monthly SNAP benefit per person, including costs of administering and monitoring the program, was approximately $160 per person, with the average individual receiving $125, Figure 1. During 2016, approximately 13 percent of the U.S. population received SNAP benefits.
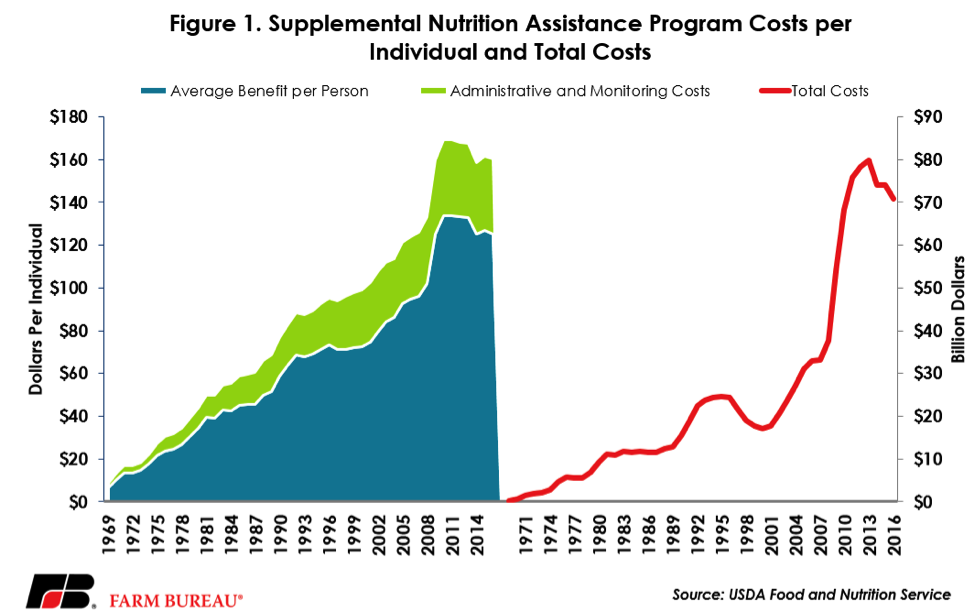
SNAP participation has declined in recent years. In 2016, 44 million individuals received SNAP benefits totaling $71 billion dollars. These benefits were down $3 billion dollars from 2015, and down nearly $10 billion dollars from 2013. Participation was also down 3.4 million individuals from the program-high of 47.6 million, set in 2013. The decline in SNAP spending is due in large part to stability in the U.S. economy and a low national unemployment rate. State mandates, like work requirements for able-bodied adults without dependents, are also a factor.
Urban Versus Rural Benefits of SNAP
While a majority of the SNAP benefits are received in states with large populations, such as California, New York, Texas and Florida, as a percentage of the population receiving benefits many rural areas also rely very heavily on SNAP. The Food Research and Action Center released a set of interactive maps and a meta-analysis examining participation rates related to SNAP. FRAC’s analysis shows that from 2011 to 2015 participation rates in SNAP in urban counties averaged 13 percent, while in small towns and rural counties both, the participation rate averaged 16 percent on a national basis, Figure 2.
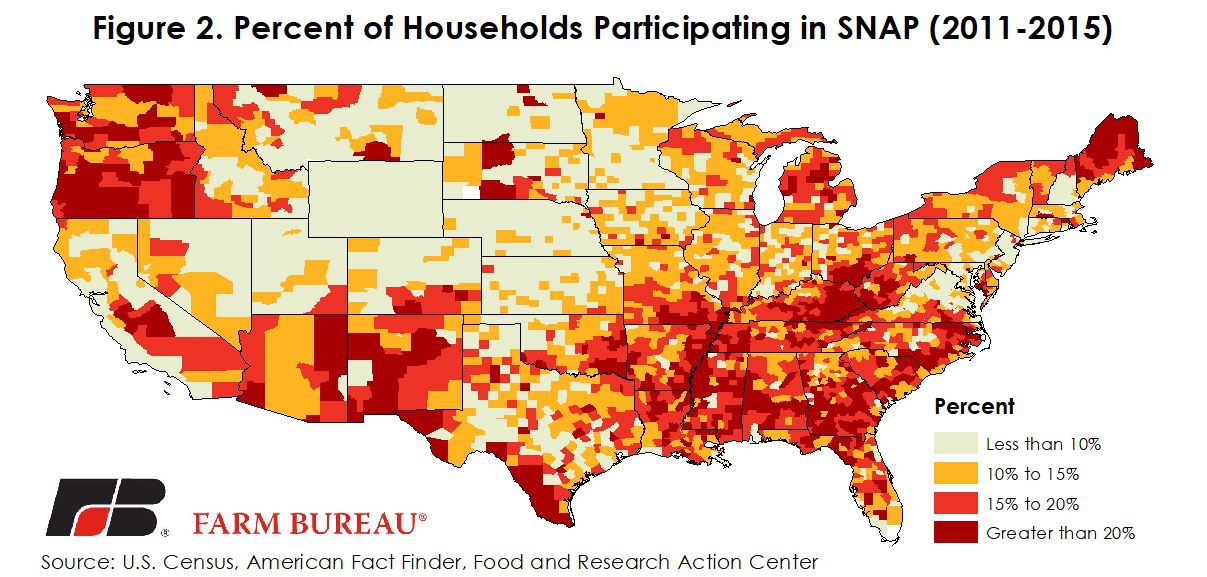
While the gap between urban counties’ 13 percent participation and the rural average of 16 percent may be viewed as relatively small, a dive into the data reveals an even greater indication of reliance on SNAP in rural counties. At the county-level, the density of counties with a higher percentage of SNAP households is greater in rural areas such as eastern Kentucky, the Mississippi Delta, and other portions of the Southeast than in major urban areas. For example, in the eastern coal-field county of Owsley, Kentucky, the average percentage of households receiving SNAP benefits was 48 percent from 2011 to 2015. Meanwhile, in Jefferson County, Kentucky – home of Louisville, the largest urban area in the state – the percentage of households receiving SNAP benefits was below the national average at 15 percent. Similar patterns can be found across the U.S.
Based on FRAC’s analysis, 23 percent of all rural counties had participation rates above 20 percent as compared to only 11 percent for cities. Even more telling were the 53 rural counties with participation rates over 30 percent versus only nine urban counties. AFBF analysis of the data reveals that in total, 1,106 out of 3,130 counties had SNAP participation rates above the national average of 16 percent.
Implications
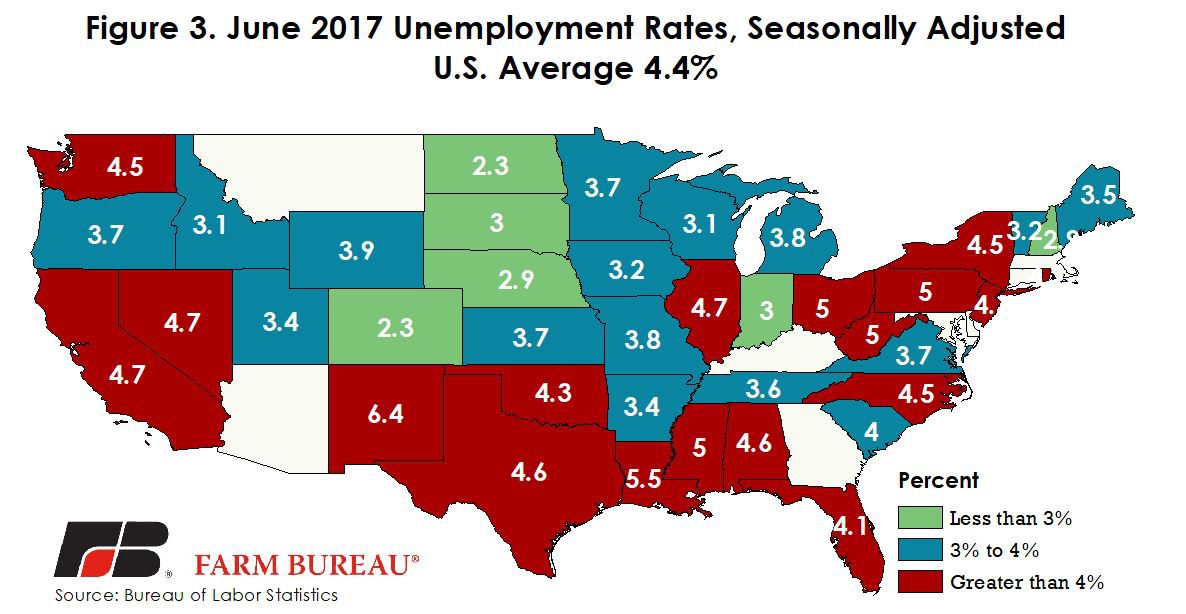
The Bureau of Labor Statistics indicated that the June 2017 preliminary unemployment rate in the U.S. was 4.4 percent. However, as evidenced in Figure 3, unemployment rates are higher in portions of rural America such as the South and the eastern Great Lakes region, reaching a high of 6.4 percent in New Mexico. As evidenced in Figure 2, these areas also correspond to higher levels of SNAP participation.
While SNAP will undoubtedly be subject to considerable discussion and review in the development of the next farm bill, the program provides much-needed assistance in rural areas as well as in the city. Understanding that the benefits of SNAP is critically important given the president’s fiscal year 2018 budget proposal to tighten eligibility and employment requirements to reduce overall participation in SNAP. Under a smaller SNAP, rural households may find it more financially difficult to access the high-quality and safe agricultural commodities produced by their neighboring farmers and ranchers.
Note:
The Food Research and Action Center was founded in 1970 with the goal of working “to eradicate poverty-related hunger and under-nutrition in the United States.” They have been very active in the legislative effort to provide nutrition assistance across the country. One of their initial litigation efforts was the push to have nutrition assistance provided in all counties in a state. At the national level, AFBF has frequently linked with FRAC in the initial stages of farm bill development efforts to support both the nutrition and agricultural portions of the legislation.
Top Issues
VIEW ALL