Too Many to Count: Factors Driving Fertilizer Prices Higher and Higher
TOPICS
Trade
photo credit: Arkansas Farm Bureau, used with permission.
Shelby Myers
Former AFBF Economist
Among farmers and ranchers, very few topics are being discussed as much as the skyrocketing cost of fertilizer and increasing concerns regarding availability. Given that fertilizer costs account for approximately 15% of total cash costs in the U.S., fertilizer prices are the number one issue on farmers’ minds as they begin to set up purchases for the 2022 growing season. Unfortunately, the fertilizer sticker price farmers in some areas are reporting is up more than 300% and delivery times are anyone’s best guess. We’ve seen this before, in 2008. During the 12 months ending in April 2008, nitrogen prices increased 32%, phosphate prices increased 93% and potash prices increased 100%. Prices remained there through 2009, then dropped, ultimately returning to pre-2007 levels by the end of 2009. That price surge was associated with strong domestic and global demand, low fertilizer inventories and the inability of the U.S. fertilizer industry to adjust production levels. This time around, those same factors are at play, along with several others that add an extra layer of uncertainty.
This article dives into a number of the short- and long-run factors impacting fertilizer supply and demand to provide context to the increasingly expensive production input.
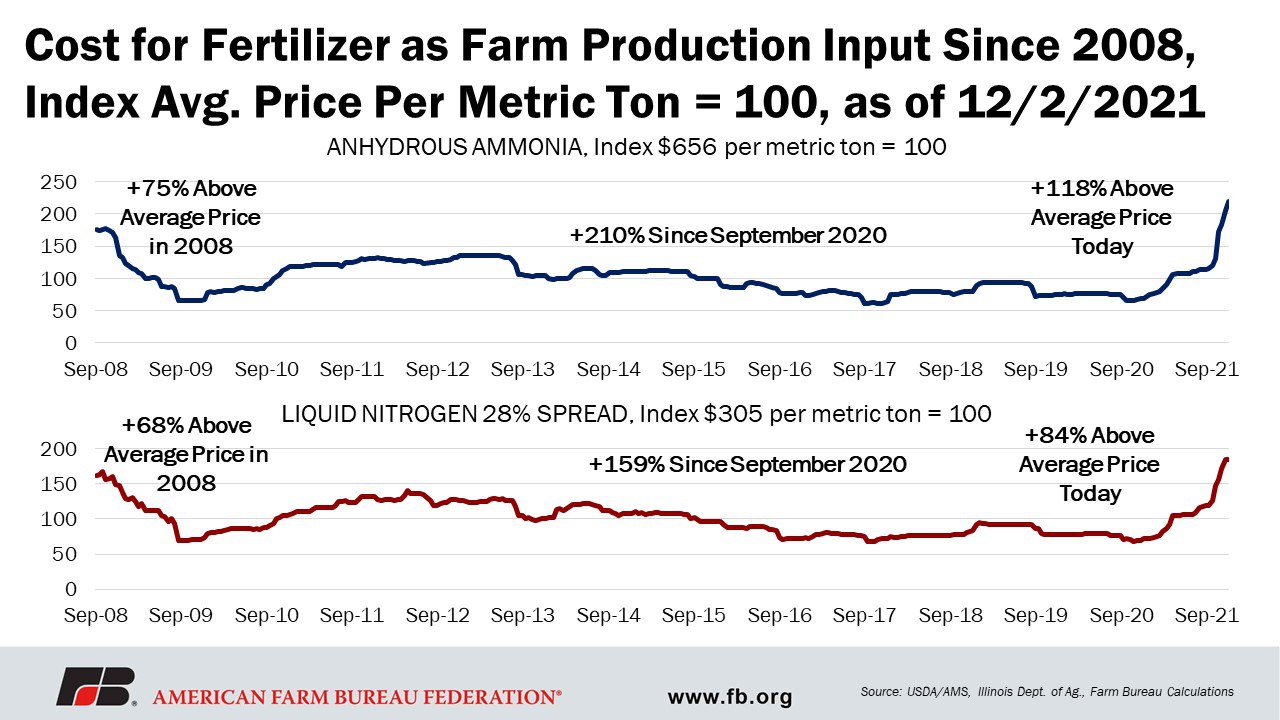
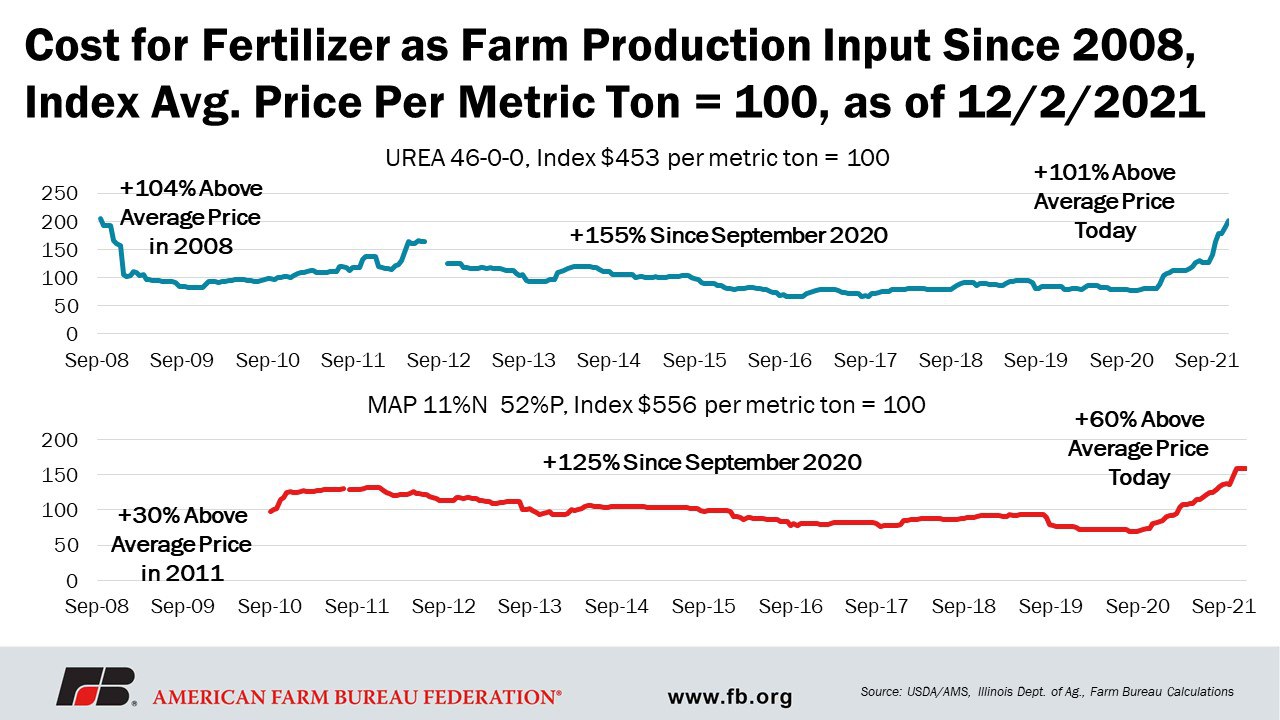
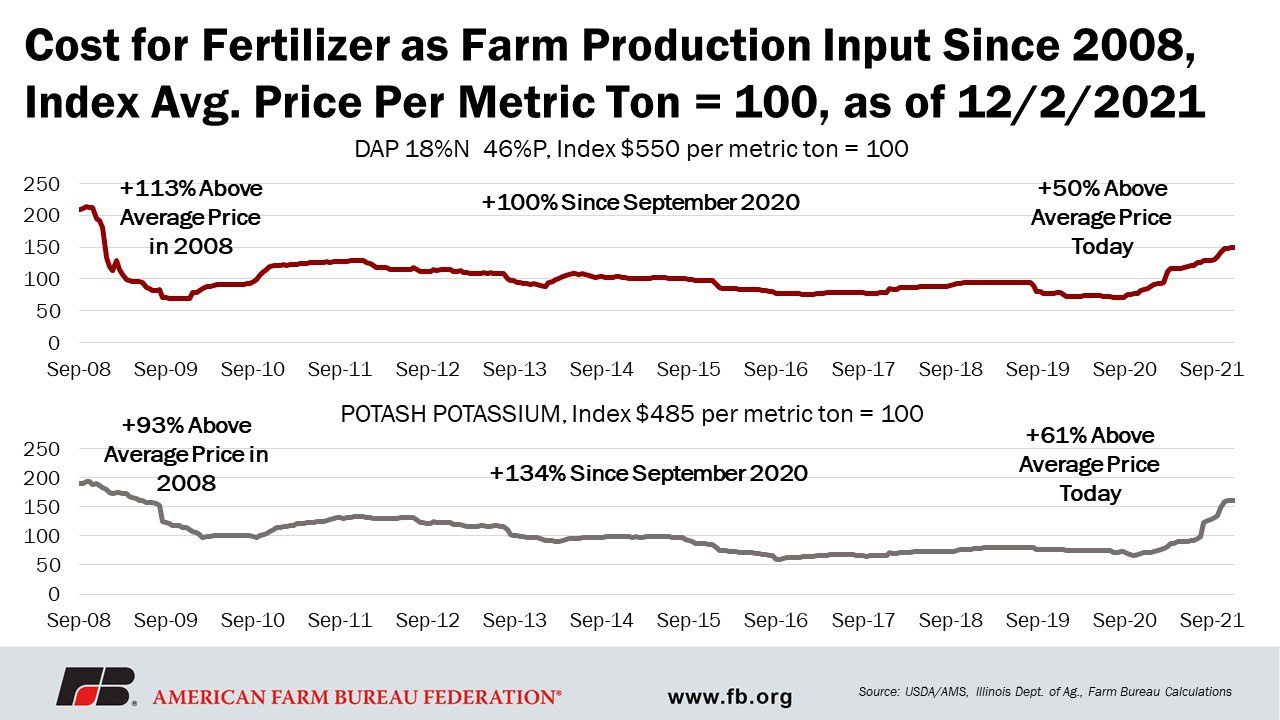
All major nutrients used in the production of primary row crops in the U.S., nitrogen (in the forms of anhydrous ammonia, urea, or liquid nitrogen), phosphorus (diammonium phosphate – DAP and monoammonium phosphate – MAP) and potassium (potash), have experienced varying degrees of upward price pressure. Compared to September 2020 prices, ammonia has increased over 210%, liquid nitrogen has increased over 159%, urea is up 155%, and MAP has increased 125%, while DAP is up over 100% and potash has risen above 134%.
Looking at the average price of each nutrient since September 2008, as collected in the Illinois cost of production dataset, anhydrous ammonia is up 118% above its average of $656 per metric ton; urea is up 101% from its $453 per metric ton average; liquid nitrogen is up 84% from its $305 per metric ton average; DAP is up 50% from its $550 per metric ton average; MAP is up 61% from its $555 per metric ton average; and potash is up 61% from its $485 per metric ton average.
Fertilizer is a global commodity and can be influenced by multiple market factors beyond the control of U.S. producers. Similar to globally traded commodities, 44% of all fertilizer materials are exported to a different country. This factor has an outsized impact on fertilizer prices because fertilizer production is not only influenced by what is occurring where it is produced or the cost of production in that country, but also affected by the numerous other countries demanding fertilizer products and the transportation rates to get the fertilizer to its final destination.
Increased Global Fertilizer Demand
Two-thirds of global fertilizer demand is driven primarily by six crops. Globally, corn represents about 16% of the farm-use fertilizer demand, with wheat a close second, representing about 15% of global farm-use fertilizer demand. Rice represents about 14% of global farm-use fertilizer demand, followed by vegetables at 9%, fruits at 7% and soybeans at 5%.
As a large producer of corn, soybeans and wheat, the U.S. is a large consumer of fertilizer. However, with increased technology and innovation for on-farm products, the use of fertilizer in the U.S. has decreased, despite increased planted acres of these crops. At peak use, during the 1980/81 fiscal year, the U.S. used 23.7 million nutrient tons but has pulled back due to the adoption of precision fertilizer application, as shown by the most recent data available – 2015/16 – when U.S. nutrient use was reported at 22.1 million nutrient tons. Corn represents about 49% of the share of U.S. nutrient use, while wheat accounts for about 11% and soybeans account for 10%. Cumulatively, those three crops account for about 70% of U.S. fertilizer consumption.
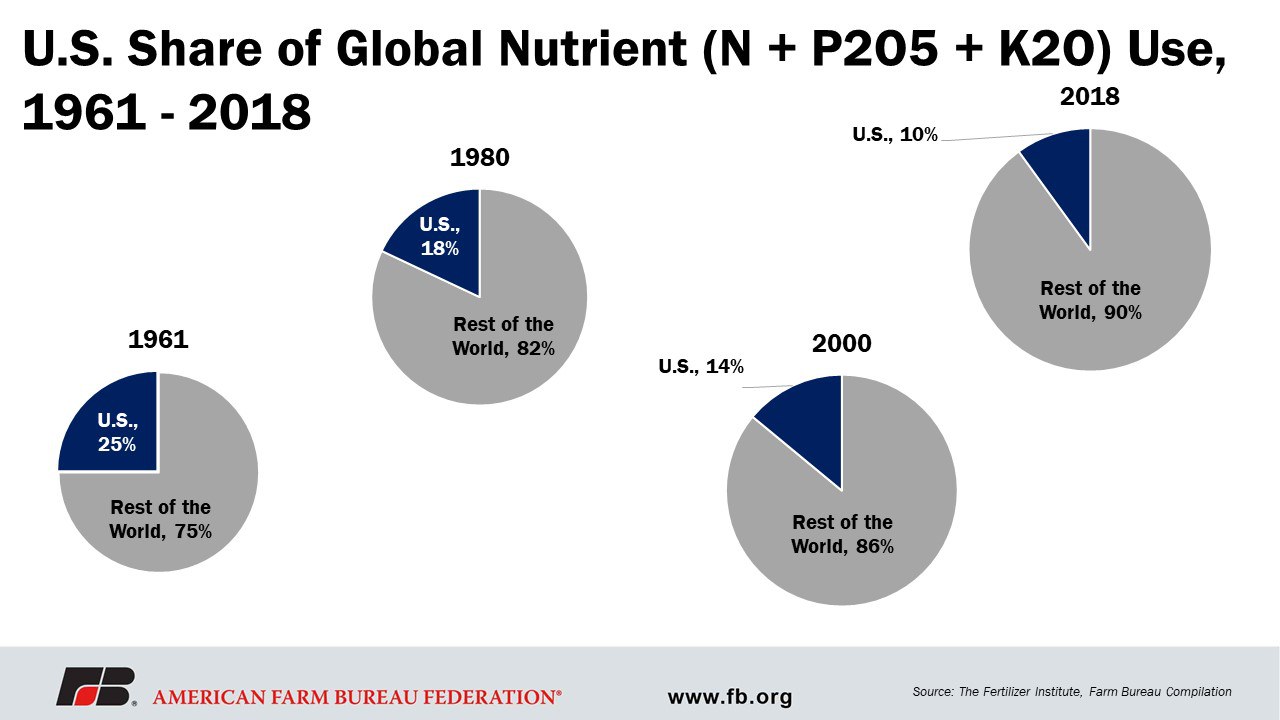
Though the U.S. has lowered its overall consumption of global nutrient use, other countries have increased nutrient use. Back in the 1960s, the U.S. accounted for 25% of global nutrient use. Today, the U.S. only accounts for about 10% of global use, with U.S. farmers representing only 2% of that share.
The Multitude of Supply Factors
Domestic Production vs. Imports
The U.S. is the third-largest producer of fertilizer globally, however, it still requires the importation of all three nutrients, especially nitrogen and potash, to fully meet demand. This means that U.S. fertilizer dealers and U.S. producers are required to pay the price defined by the global market for fertilizer and fertilizer materials, plus transportation.
In 2020, U.S. ammonia was produced at 36 domestic plants and shipped around the country by pipeline, rail, barge and truck. According to the most recent data from the International Fertilizer Association, in 2018 the U.S. ranked second in nitrogen production, representing 11.6% of global production, behind China, which produced 24.6% of nitrogen, and ahead of India, which is the third-largest global producer of nitrogen, producing 11.3% of global supply. For phosphate production, the U.S. also ranked second, with 9.9% of global production, behind China, which produced 37.7%, and again ahead of India, with 9.8% of the global supply of phosphate. For potassium potash, Canada leads the way in production, representing 31.9% of global production, followed by Belarus, which produces 16.5% of global supply. Russia is a close third as it produces 16.1% of potassium global supply. China ranks fourth. In total, about 80% of the world’s potash comes from those four countries. The U.S. ranks as low as 11th in potassium production, with only 0.8% of global supply coming from the U.S.
When it comes to global exports, the U.S. is not a major fertilizer exporter. The U.S. holds a share of about 4.6% of the nitrogen exports, ranking seventh. Russia is first, with a share of 16.5% of exported nitrogen, followed by China with about 11.2% of share in nitrogen exports, and Saudi Arabia, which holds a share of 6.4% of nitrogen exports.
Of phosphate exports, the fourth-ranked U.S. represents about 11.8%. China is first in phosphate exports, holding a share of 25.2% of global phosphate exports, followed by Morocco with a share of 17.4%, and Russia with a share of 12.7% of global phosphate exports. Of the global potassium exports, the U.S. represents less than 1% of global exports and ranks 12th among other countries. Canada holds the largest share of global potassium exports with 36.2%, followed by Belarus with an export share of 18.5% and Russia, which represents 16.5% of global potassium exports.
Energy and Other Variable Costs Rising
To make fertilizer, along with globally priced raw materials, production facilities require a large amount of energy to convert the raw chemical materials into their applicable farm-use state. For example, anhydrous ammonia is produced by the Haber-Bosch process in which nitrogen is combined with hydrogen to synthesize the ammonia, using natural gas as the source of the hydrogen, as well as the energy, for synthesizing. Since natural gas is the primary building block for most nitrogen fertilizers, it takes about 33 million metric British thermal units (MMBtu) per material ton of ammonia to make the conversion. This accounts for 70% to 90% of the production variable costs in the synthesis process. Natural gas prices have risen dramatically over the past few months, especially in Europe, where they have increased over 300% since March 2021, which has also forced many EU nitrogen plants to close. Plus, plants built for this process typically take about three to five years to build and cost about $3 billion to $5 billion. The long-run impact is that when a demand surge occurs, the response time to fulfill supply via an additional production facility will lag about three to five years at a significant price tag.
Speaking to the natural gas price spike, during the February freeze throughout Texas, much of the natural gas production was interrupted or shifted away from regular uses and pushed to Texas due to the demand spike. This forced U.S. ammonia plants in Oklahoma, Texas and Louisiana, which combined account for about 60% of production, to shut down during this time and cut about 250,000 tons of production. Then Hurricane Ida hit those areas and production was paused once again.
Amid these production halts, delayed plant turnarounds from COVID were stopped again, just as plants were trying to catch up. This caused more production disruptions, either for much-needed regular maintenance or issues that have occurred as a result of delayed maintenance. These plant turnarounds are necessary and essential to maintain the chemical processes and safety of fertilizer production plants. Many plant turnarounds were delayed during the worst of COVID as precautions at production facilities were implemented and the companies contracted to perform these turnarounds were asked to delay visits until it was safe to bring external employees back on site. These disruptions are enough to cause a slight decrease in availability, despite the U.S. spending the past few years increasing its number of production plants to match nearly the same number as in 2002, as influenced by lower natural gas prices from 2009 through the end of 2020.
Short-term costs, like increased natural gas prices and production delays, have a direct impact on production because they create diseconomies of scale. When the short-term variable cost of production rises above the average cost of production in the long-run, a production facility cannot maintain that level of production in an economically viable way. It will scale back production and look for alternatives to backfill supply. With fertilizer, as the price of natural gas skyrockets and increases the cost of production, as in the case of synthesizing ammonia, U.S. producers can no longer compete with other global producers who may have a lower cost of production. This results in a pull-back of production and the search for supply elsewhere, typically via imports. In the case of ammonia, even with domestic U.S. ammonia production, the U.S. must still import as low as 30% of its nitrogen in the 2019/20 fiscal year to as high as 59% back in the 2005/06 fiscal year which is purchased at the global price plus transit costs.
Other fertilizer nutrients have similar production cost woes. Converting phosphate rock from a raw product to its fertilizer-use form is a little different process that involves surface mining. The soil and rock covering the phosphate must be removed using large draglines that are often five stories high. These draglines are very large and very expensive pieces of equipment that operate using electricity, which has gotten even more expensive. This puts phosphate-based fertilizers in a similar situation as ammonia conversion plants, looking to supply the product at a lower cost elsewhere. And, again, though potash production is done via mines for potassium, they also operate on electricity. These mines are anywhere from a kilometer to a mile underground, around the world, with only about 10 countries that produce potash and even fewer countries that export the product, causing a further tightening of supply.
Pivots in Fertilizer Demand Outlook Impacting Production
Further impacting fertilizer supply is the reaction to COVID-19 precautions along with the continuing “accordion effect” throughout the economy. Essentially, the entire supply chain, including fertilizer production and distribution, is working overtime after being forced to slow or stall in response to pandemic safety precautions.
The market outlook for commodities during summer 2020, before massive export buying began in September 2020, was bleak for producers. The farm economy was uncertain and commodity prices were at low and unpredictable levels. The corn price in June 2020 was $3.20 per bushel, the lowest level since 2006. Soybeans were estimated to be $8.20 per bushel, the lowest price since 2006 and wheat was $4.60 per bushel, the lowest level since 2016.
Similarly, from mid-2019 to mid-2020, fertilizer prices were at or very near their lowest levels since 2016 and 2017, depending on the nutrient. The International Fertilizer Association produces a fertilizer forecast for global demand about every six months. Prior to COVID-19, in December 2019, IFA was forecasting a drop in global fertilizer demand, with about a 1% increase in demand over the next two years. Global fertilizer demand for the 2017/18 fiscal year was set at 190.1 million metric tons of nutrients; 2018/19 fiscal year was set to be 188.8 MMT; 2019/20 global fertilizer demand was expected to be 190.5 MMT; and 2020/21 global fertilizer demand was expected at 192.9 MMT.
When COVID-19 took hold and a flurry of uncertainty arose, forecasts for fertilizer demand grew more pessimistic, with demand expected to drop significantly, according to the new July 2020 forecast. Expectations of global fertilizer demand for the 2019/20 fiscal year were lowered from 190.5 MMT to 189.9 MMT, while global fertilizer demand for the 2020/21 fiscal year was expected to drop from 192.9 MMT to 184.4 MMT, a decrease of 4.5%. Expectations for the newest 2021/22 fiscal year set global fertilizer demand expectation at 189 MMT. Suppliers and producers responded accordingly and adjusted production lower and implied that the outlook indicates no signals of any kind that would cause a ramp-up in production or an increase in imports of raw materials.
Then, unexpectedly, massive export buying of commodities quickly improved the commodity price outlook, particularly for corn, soybeans and wheat. By April 2021, USDA forecasts indicate the corn price to be $4.30 per bushel, an increase of 34% and the highest price since 2013. Soybeans were estimated to be $11.25 per bushel, an increase of 37% and also the highest price since 2013. Wheat came in at $5 per bushel, an increase of 8%, and continues to climb, going above $6 per bushel. Increases in commodity prices drive farmers to plant more profitable crops. Thus, the market outlook for farm economy conditions had significantly improved and 2021 planted crop acres for corn, soybeans and wheat were expected to increase, rather than decrease or stay stagnant compared to 2020.
The new IFA forecast, released in November 2020, reflected these changes, indicating an increase in global fertilizer demand. The newest forecast showed an even higher demand for fertilizer than forecasts prior to COVID-19, which is what we continue to see as farmers look to lock in their input prices for the 2022 growing season. The most recent forecast for global fertilizer demand for the 2019/20 fiscal year kept expectations at 189.9 MMT, but increased expectations for global fertilizer demand in the 2020/21 fiscal year, moving from 184.4 MMT back up to 193.5 MMT, which is higher than the expectations in December 2019 of 192.9 MMT. Expectations for the newest 2021/22 fiscal year moved from original estimates of 189 MMT to 195.6 MMT, an increase of 3.5%. The gap of expected demand between July 2020 and November 2020 is the shortage of supply that production plants are working to make up and fulfill.
The narrowing of fertilizer demand followed by a quick expansion, rather than a slow return, created another supply chain shock. Under initial pandemic safety precautions, early forecasts anticipated a negative impact on global fertilizer demand and market reactions to this forecast caused production rationing. Then, the rapid rise in row crop prices led to quick reactions for higher fertilizer demand in the U.S. and abroad, further tightening supplies already strained due to production and distribution issues.
Distribution and Supply Chain Disruptions
Once the fertilizer is converted from raw material to on-farm use, it must be transported to retailers for growers to purchase, completing the last link in the supply chain. Now, fuel prices are up again, along with trucking rates. As more people return to the road, gasoline demand is rising beyond even pre-COVID-19 levels.
There has been an increase in the number of goods shipped at all stages: raw, processed and consumer-ready. Not to mention the increased demand for goods delivered directly to end-users, clogging typical distribution chains still catching up from pandemic slowdowns. This pressure and pace have increased shipping rates and labor needs as more people are required to deliver these goods. And fertilizer, as a globally exported/imported product that has to be delivered to rural areas, has been greatly affected.
Hurricanes, ice storms, labor issues, additional manufacturing capacity and infrastructure breakdowns, including rail logistics issues and increased freight rates, have caused even more production and distribution disruptions.
Trade Duties
Along with increased shipping rates for the 44% of fertilizer that is exported across the world, anti-dumping trade dispute cases are also likely increasing fertilizer costs, though there is not enough current publicly available data to indicate by how much. In 2018, U.S. imports of fertilizer materials from Morocco and Russia were up over 2.4 MMT. Then, the anti-dumping case was filed against those countries and imports to the U.S. from Morocco and Russia declined. Mosaic, the largest U.S. producer of phosphate, won the anti-dumping case and a 30% tariff was applied to phosphate imports. CF Industries, the largest U.S. producer of UAN, applied a similar case to Russia regarding liquid nitrogen. In 2019, U.S. fertilizer imports from Morocco were just about 2 MMT, up 11% compared to 2018, while fertilizer imports from Russia were 729,288 MMT, down about 16% compared to 2018. Purchases have shifted to other countries, so U.S. imports of ammonia and phosphate are now arriving from countries like Saudi Arabia, Jordan, Australia, Mexico, Lithuania and Egypt. This shift is in search of other imports that are more likely to arrive at a price lower than an applied tariff rate, but are likely still to be slightly higher than the going global price due to applied transit costs.
Other trades disruptions have played a big role in fertilizer availability and cost. As mentioned earlier, these things build on each other. Sanctions from the European Union have been applied to Belarus and the U.S. has followed the same process to apply sanctions. As Belarus contributes about 20% of global potash exports, these sanctions have slowed and even stopped shipments of potash to the EU and the U.S. According to TFI, these sanctions are also discouraging other countries from buying from Belarus, forcing an overall lessened contribution of global potash supply.
At the end of September, China applied an export ban on phosphate due to rising costs of production and domestic use. With China accounting for 25% of phosphate fertilizer exports globally, this export ban puts even more pressure on prices. There is potential for China to also apply an export ban to urea; China contributes about a 10% share of global urea exports.
Other Geopolitics
In addition to trade disputes, countries are implementing policies that impact global prices. For example, India has approved an additional $3.8 billion to increase the fertilizer subsidy for its farmers, causing fertilizer demand in India to continue to rise, pushing prices even higher for global buyers.
Impact
2022 Planting Intentions
Given all these factors, fertilizer prices are expected to remain high through springtime, which may compel some farmers to shift planted acres away from corn to commodities that use fertilizer at a lower rate, like soybeans or wheat. With the price of ammonia about 85% correlated with the price of corn, farmers must consider whether the increased cost of fertilizer and other inputs can be recovered by cash receipts from crop revenues in order to break even. There are also expectations retailers will have to turn customers away because they will not be able to deliver fertilizer products on time, increasing the need for supply chain and infrastructure improvements.
2021 Tax Implications
When keeping financial records, business owners have two accounting methods to choose from – cash basis accounting or accrual accounting. The difference between the two methods lies in the timing of when farmers record sales and purchases. Under the cash basis, revenue is recorded when cash is received from customers, and expenses are recorded when cash is paid to suppliers and employees. Under the accrual basis, revenue is recorded when earned and expenses are recorded when consumed.
The IRS allows farmers to use the cash method of accounting for their tax returns, and most choose this option. Cash accounting requires income from selling farm products to be reported in the year they are sold, which may differ from the year in which they were produced. Likewise, under cash accounting, the costs of farm inputs and services are reported in the year in which they are paid for, which may differ from the year in which they are used.
The fact that the cash method is utilized by most farmers is important in the discussion on fertilizer prices. Many farmers will purchase inputs needed for the next growing year, like fertilizer, in the waning months of the calendar year to reduce farm income and subsequently reduce their tax liability in the current year. This year, many farmers have been unable to purchase their fertilizer for 2022 and as a result, will likely face a higher tax bill in 2021.
Need For Tariff Relief
Price increases, especially price increases that can be mitigated or avoided, such as the application of import duties, can have an impact on a farm’s bottom line. Imports are an important part of the fertilizer supply to farmers. The application of the duties that are potentially in effect for five years, with the possibility of extension, will result in a continued constricted supply and an imposed higher price for users. From experience, America’s farmers know that imposing the requested anti-dumping and countervailing duties on fertilizer imports will add to agricultural production costs and request that they be removed.
Summary
U.S. agriculture production costs are increasingly important to the near- and long-term viability of U.S. farms. Fertilizer prices are the issue top of mind for farmers heading into 2022 since fertilizer costs account for approximately 15% of total cash costs in the U.S. All major crop production nutrients have experienced increased prices when compared to September 2020: ammonia has increased over 210%; liquid nitrogen has increased over 159%; urea is up 155%; MAP has increased 125%; DAP is up over 100%; and potash has risen above 134%.
While this information helps to understand the factors causing one of the farmers’ biggest concerns, it does not alleviate the rising input costs that are out of their control. Many farmers feel these rising input prices are taking away all the momentum provided by the higher commodity prices that were going to help them break even or be just above the bottom line.
Top Issues
VIEW ALL