U.S. Food Expenditures at Home and Abroad
Megan Nelson
Economic Analyst

photo credit: Colorado Farm Bureau, Used with Permission
Megan Nelson
Economic Analyst
The share of household income spent on food is an indicator of national wellness and food security. In 1857, economist Ernst Engel posited that as incomes rise, households tend to spend a smaller percentage of their total income on food -- both at home and away from home. At the same time though, the total amount spent on food increases.
Engel’s Law remains a consistent framework for looking at the broader implications of food expenditures and can be seen in the research and data coming from USDA and the Organization for Economic Cooperation and Development.
Domestic Expenditure on Food
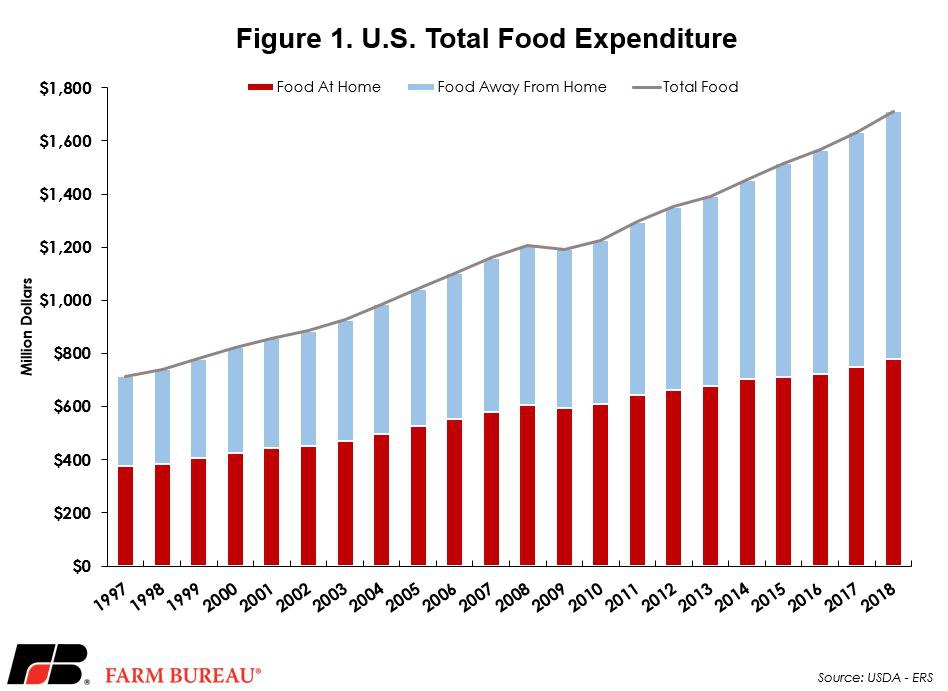
According to USDA’s Economic Research Service, in 2018 Americans spent an average of 9.7% of their total disposable income on food at home and food away from home. USDA indicates that $1.7 trillion was spent on total food expenditures in the U.S. in 2018, up $78.2 billion from the previous year. The Food Expenditure Series, published annually by USDA, focuses on the magnitude and distribution of food expenditures in the U.S., primarily within the bounds of dollars spent on food at home and food away from home. Food-at-home expenditures are defined as purchases of food at grocery stores and other food stores where the final purchaser is the consumer. Food-away-from-home expenditures include meals and snacks supplied by commercial food service establishments.
Total food expenditures continue to increase each year, with a larger portion of U.S. food expenditures going toward food-away-from-home purchases. According to USDA’s report, the largest differential between food-at-home and food-away-from-home spending in the past 20 years occurred in 2018, with 54% of total food expenditures going to food-away-from-home purchases. Food-away-from-home spending first surpassed food-at-home purchases in 2007, with $581 billion spent. Figure 1 outlines U.S. total food expenditure from 1997 to 2018. A previous Market Intel reviewed this trend in U.S. food expenditures at home and in restaurants: Check, Please! More U.S. Consumers are Dining Out.
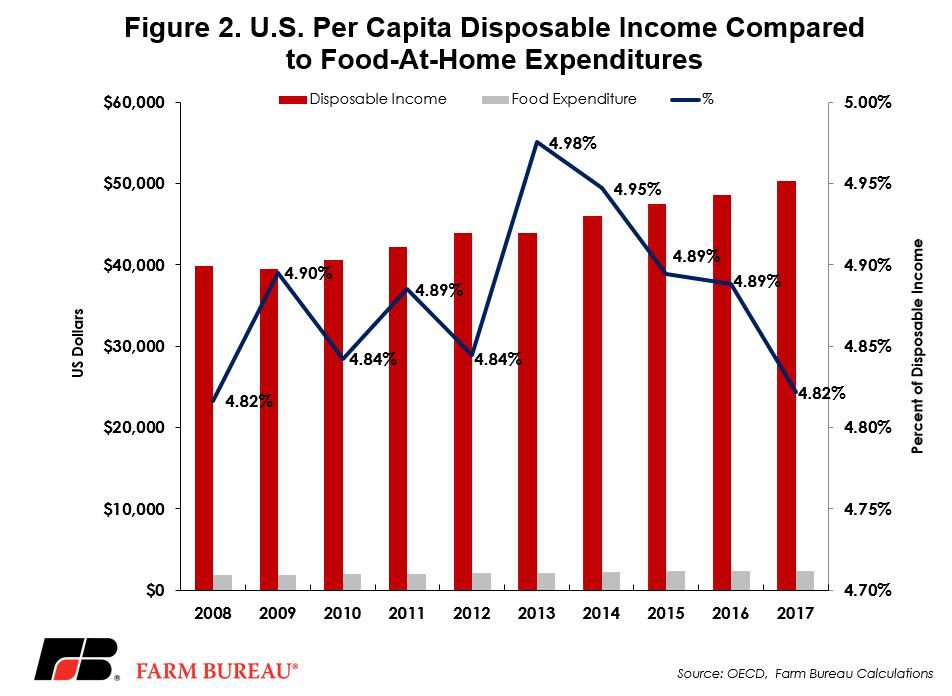
While total food expenditures in the U.S. continue to increase each year, the percent of individuals’ disposable income spent on food decreased to 4.8% in 2017, the lowest level since 2012. In 2017, gross household adjusted disposable income per capita reached $50,292, up $1,740 from 2016 and up over $6,000 from 2012. As defined by OECD, household disposable income is the sum of wages and salaries, gross operating surplus, as well as other forms of income, less taxes on wealth and social security contributions. This measure of income, at the total economy level, incorporates additional income items not seen in national income or gross domestic product and paints a more specific picture of what households have available for spending. Figure 2 illustrates U.S. per capita disposable income compared to food-at-home expenditures from 2008 to 2017.
Global Expenditures on Food
When analyzing the relationship between disposable income, gross domestic product and food expenditures on a global scale, Engel’s law accurately describes the disparities between high-income and low-income countries. In 2018, the average per capita gross domestic product for high-income countries was $44,715 in current U.S. dollars. This represents a $43,902 USD differential from low-income countries, such as Ethiopia and Tanzania, who had an average per capita GDP of $813 USD in 2018.
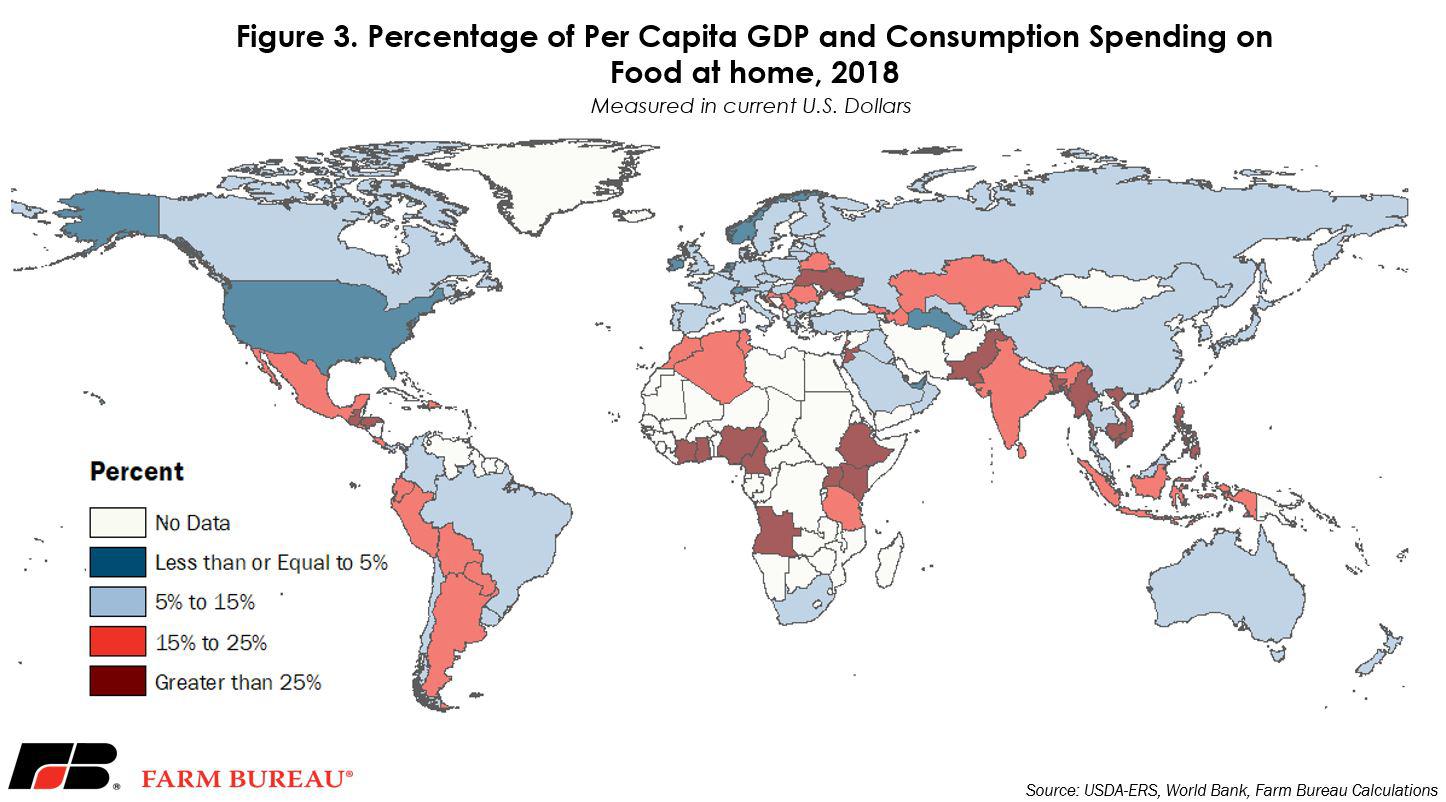
For high-income countries, the higher per capita GDP does translate into higher spending amounts on food, but it also equals a much smaller percentage of per capita GDP being spent on food. Figure 3 highlight the differences in the percentage of per capita GDP and consumption spending on food at home between high-income countries and low-income countries. For example, most high-income countries spend less than 7.5% of per capita GDP on food at home, while many lower-income countries – such as Uganda with a GDP per capita of $643.14 in current USD – spent upwards of 25% of their per capita GDP on food at home.
High-Income Countries
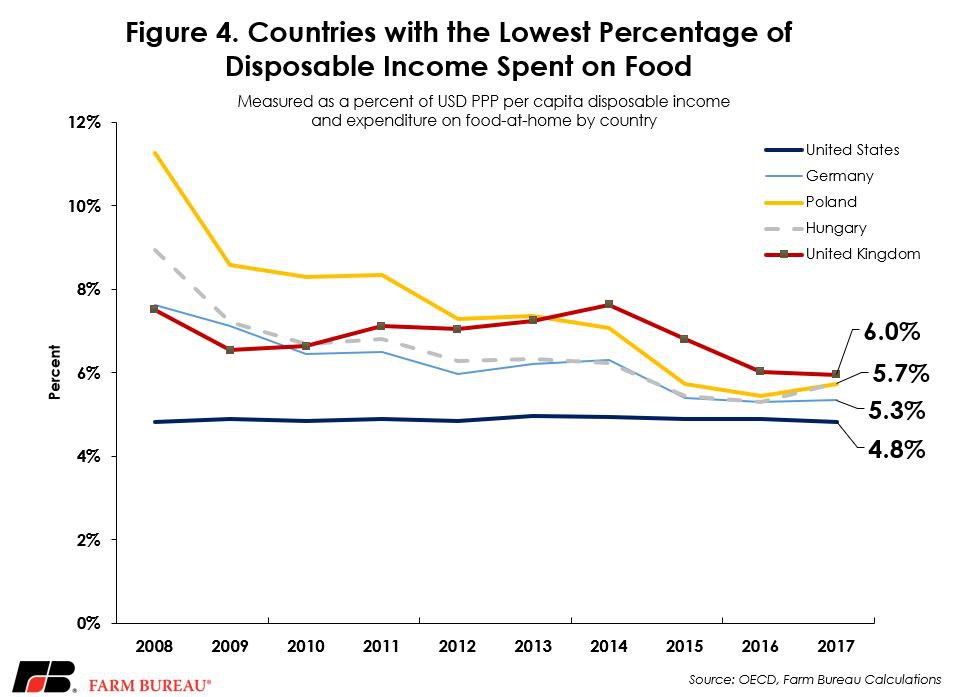
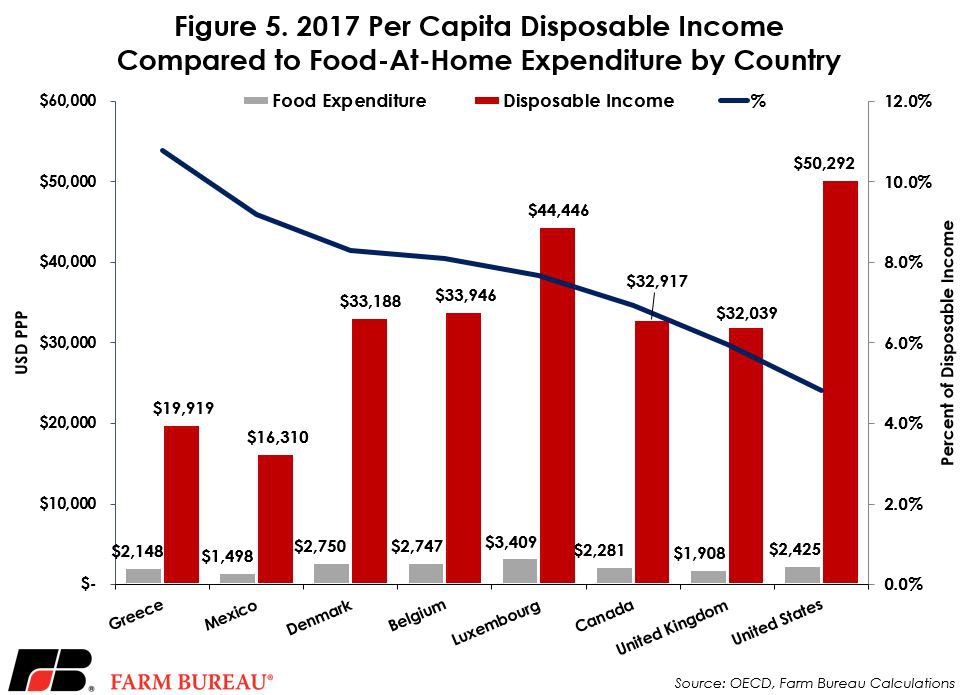
Comparing the level of available income to spend, or disposable income of high-income countries offers a deeper look at the purchasing power of individual households. As the only country in which food-at-home expenditures make up less than 5% of consumers’ disposable income, the U.S. has the most affordable food in the world in terms of total consumer expenditures. In 2017, per capita food-at-home expenditures for most high-income countries averaged $2,245 USD Purchasing Power Parity (PPP). By using PPP when comparing macroeconomic indicators such as standard of living between countries allows for two different currencies to be held in a relative equilibrium and compare the same basket of goods. When compared to an average of $29,086 USD PPP per capita disposable income for high-income countries, approximately 7.7% of disposable income was spent on food at home. High-income countries such as the U.S., Germany, Poland, Hungry and the U.K. have the lowest percentage of disposable income spent on food at home, Figure 4.
Northern European countries such as Luxemburg, Sweden and Denmark spend substantially more on food at home than Americans – 29%, 13% and 12% more, respectively. However, these countries maintain some of the highest GDP rates and per capita disposable income; therefore, when looking at the cost of food for a household as a share of the money they have available to spend, the price is still relatively low. In Mexico, an upper middle-income country, consumers spend 9.2% of per capita disposable income on food at home – nearly twice as much as American consumers spend. At 10.8%, Greece maintains the highest percentage of disposable income spent on food at home for high-income countries. Figure 5 outlines per capita disposable income and food-at-home expenditures by country.
Low income countries
Food consumption is a fundamental dimension of social welfare when analyzing the global landscape of any population, and is a key to understanding trends in social, economic and human development. These measures are particularly important for stakeholders in agriculture to be able to determine the rapidly changing consumption patterns in low-income countries. Per the International Food Policy Research Institute, countries that spend a substantially larger portion of their income on food are more senitive to changes in price and are more likely to shift their demand for agriculture goods more frequently. This price volatility creates unpredictable markets for farmers and ranchers and may. Lead to malnutrition for those who are not able to pay higher prices or find substitute products.
Due to the lack of data regarding per capita disposable income for many low-income countries, consumer expenditures are used to extrapolate the relationship of the share of income spent on food by country.
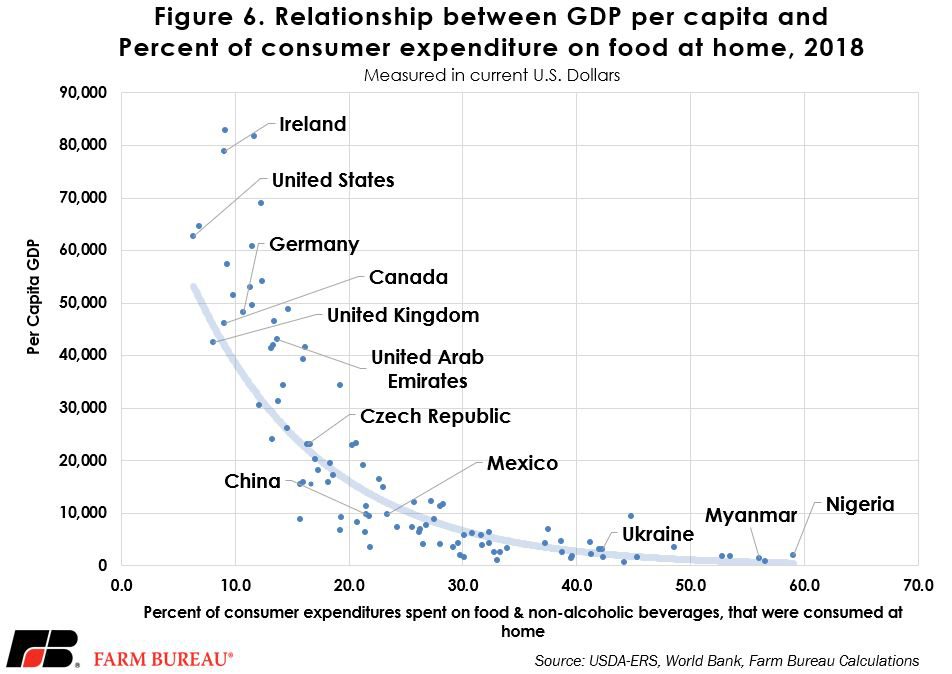
According to USDA, consumer expenditures comprise personal expenditures on goods and services. In 2018, with $1,017 per capita in food expenditures, Nigerian households spent 59% of total consumption expenditures on food at home and non-alcoholic beverages. Ethiopia, Myanmar and Bangladesh follow closely, with 57%, 56% and 54% of total consumption spent on food. Figure 6 illustrates the inverse relationship between GDP per capita and percent of consumption spending on food at home in 2018 whereby countries with higher per capita GDP spend a lower proportion of their GDP on food.
Summary
Food expenditures for high-income countries remain relatively low when looking at the percent of per capita disposable income (7.7%) spent on food at home. In 2017, Americans had access to some of the most affordable food in the world, spending only 4.8% of per capita disposable income on food at home.
Many low-income countries spend a larger portion of their income on food expenditures. These countries include Nigeria and Kenya where more than 50% of their income is spent on food. In these areas food price volatility can cause large relative price increases, i.e., as a percent of income, and may have serious social and political impacts. For people in low-income countries especially, where they spend over half their total income on food expenditures, food price spikes can lead to malnutrition, social unrest and, in extreme cases, violent riots.
To maintain some of the most affordable food prices in the world, and to supply these products to consumers around the world, U.S. agricultural research and development is key. New technologies to increase efficiency and reduce unanticipated production variability will help U.S. producers remain consistent suppliers to the world and will support our growth in export markets.
Top Issues
VIEW ALL