USDA Releases Payment Data for CFAP2
TOPICS
USDAMichael Nepveux
Former AFBF Economist
Michael Nepveux
Former AFBF Economist
USDA today provided the first peek into how payments are shaking out under the Coronavirus Food Assistance Program, or CFAP2. Late last month the administration announced details of the $14-billion-dollar program that will provide direct payments to farmers and ranchers to partially offset COVID-19-related losses. Sign-up for CFAP2 began on Sept. 21 and ends Dec. 11; producers can sign up through USDA’s Farm Service Agency county offices. CFAP2 payments will be broken into three categories: price trigger commodities, flat-rate commodities and sales commodities. Today we get to examine the first few weeks of payments, which, according to USDA data, total nearly $2 billion as of Oct. 6.
What Commodities are Receiving Bulk of Payments so Far?
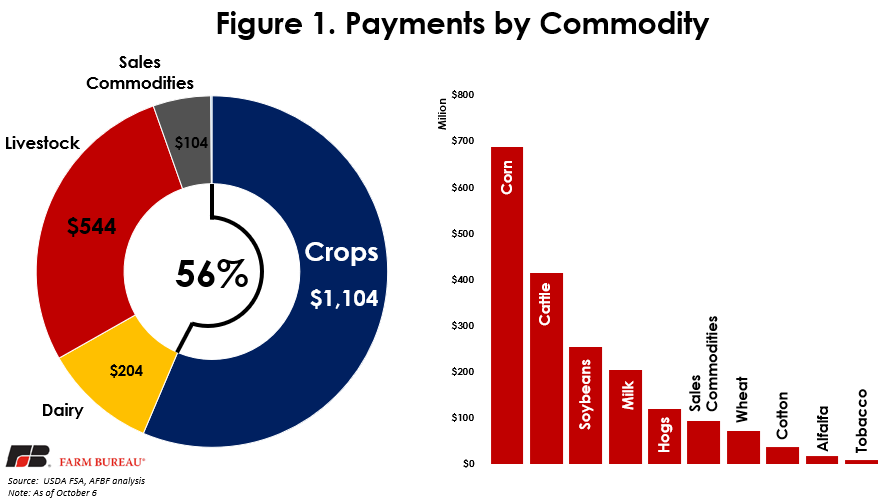
The bulk of the payments, about 56%, have gone to crops, followed by livestock at 28%, dairy at 10%, sales commodities at 5%, and eggs/broilers are sitting about 1/10 of a percent. Of those commodities, corn is king, taking in almost $700 million, followed by cattle at over $400 million, soybeans at $250 million, milk at $200 million and hogs at $120 million.
Where are the Payments Being Dispersed?
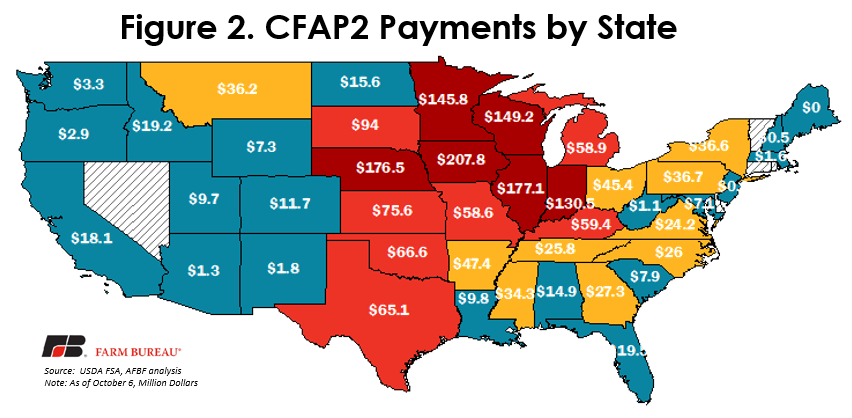
Most of the payments are concentrated in Midwestern states, think Corn Belt and livestock, with six states – Iowa, Illinois, Nebraska, Wisconsin, Minnesota and Indiana – accounting for just over half of the payments. They are followed by Plains states that tend to be heavy in livestock production – South Dakota, Kansas, Oklahoma and Texas. Keep in mind, we have only had about two weeks since the application period opened, and as more producers have their applications processed, we will see total payments grow, potentially increasing payments in other states.
Payment Rates per Approved Application
In the payment data, USDA also provides the number of approved applications for each group of commodities and each state. Using this data we can calculate a “payment rate” per approved application to see which commodities and which states are receiving the highest rates so far. Figure 3 explores the breakout by commodity and Figure 4 shows the payment rate per approved application by state.
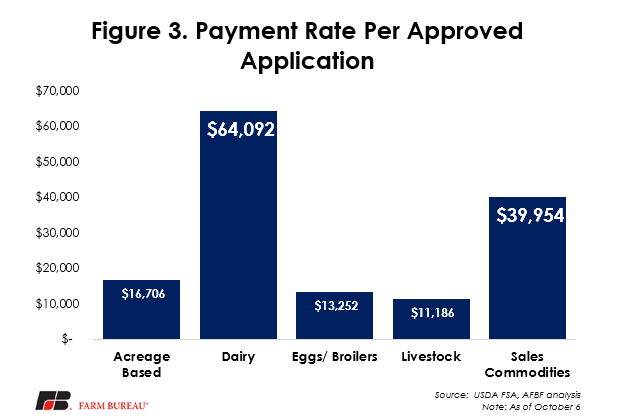
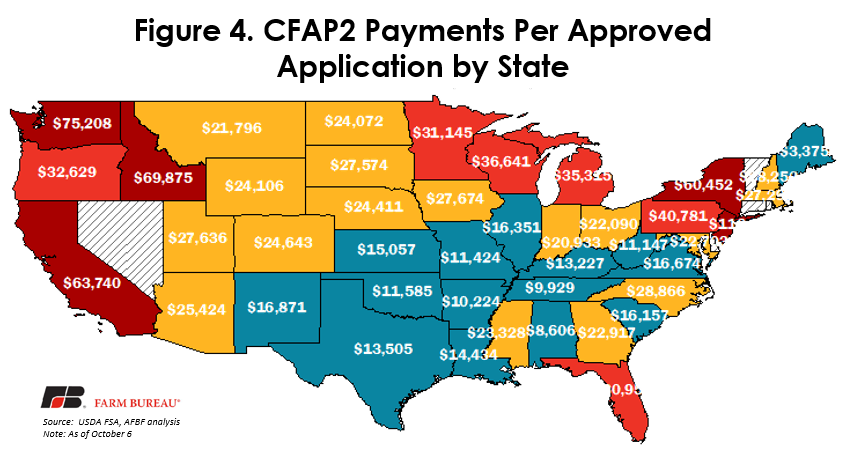
We need to be careful not to extrapolate too much from these figures as we only have 16 days of data for CFAP2, but it is helpful to see how the payments are shaping up so far. Dairy has the highest payment per application so far, followed by sales commodities. This makes sense as sales commodities include specialty crops, which tend to be higher value and produced by a smaller number of producers. We also see the regional breakout of payment rates per application track with states where specialty crops and dairy operations are more represented. A drawback to having only 16 days of data is that some of these states have very few applications so far. For example, New Jersey has the highest payment rate, but so far only five applications have been approved. This could reflect larger operations being early in the application process and we could see these rates decline as more producers are approved, growing the denominator in that calculation faster than the numerator.
How Does This Compare to CFAP1?
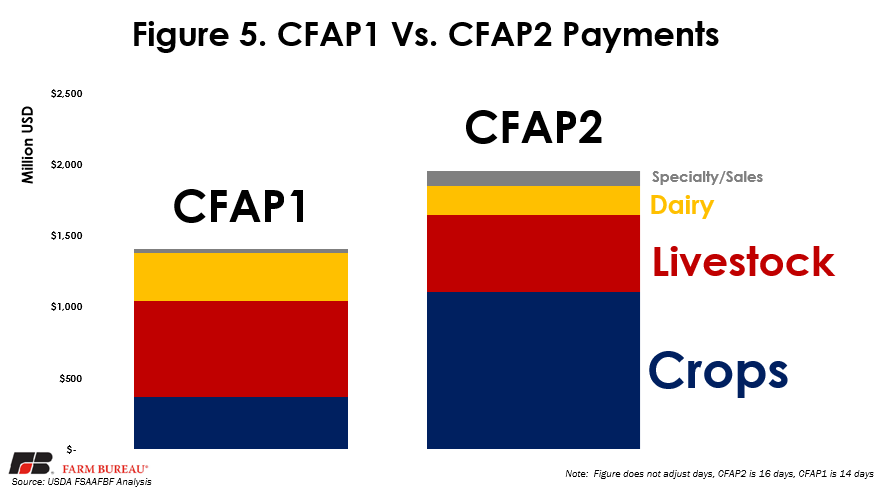
It is somewhat tricky to compare CFAP1 and CFAP2, because the CFAP1 reports from this time frame in June had 14 days of data, while this first CFAP2 report has 16 days of data. However, we can adjust these numbers to have a more “apples to apples” comparison and look at CFAP2 to match the number of CFAP1 in terms of business days. When adjusted so that the data covers the first 10 business days of both CFAP1 and CFAP2, CFAP1 had paid out $1.406 billion, while CFAP2 had $1.6 billion in payments in the first 10 business days. However, through the first 16 days of CFAP2, nine states and territories have not received any funding, compared to just four states/territories that did not receive any payments over the first 14 days of CFAP1. There are also some differences geographically between the two programs. CFAP1 paid out more in 28 states at this point, while CFAP2 paid out more in 20 states. The distribution of funds to commodities was also different between the two programs. Figure 5 shows that CFAP1 distributed the greatest share of funds to livestock while CFAP2 distributed the greatest share of funds to crops.
Conclusion
An examination of the first few weeks of payments under CFAP2 shows that nearly $2 billion in payments have been made as of Oct. 6. Most of the payments are concentrated in Midwestern states, with six of those states accounting for just over half of the payments. Crops are receiving the bulk of the payments, 56%, followed by livestock, dairy, and sales commodities in that order. In total payments, CFAP2 is ahead of CFAP1 when comparing the first 14 days of both programs’ payments, but with fewer states accounting for payments.
Top Issues
VIEW ALL