Weekly Update on Export Sales
Megan Nelson
Economic Analyst

photo credit: Getty Images
Megan Nelson
Economic Analyst
While we eagerly await USDA’s World Agriculture Supply and Demand Estimates report coming out Friday, Feb. 8, key grain reports from the Federal Grain Inspection Service and the Foreign Agricultural Service continue to update. According to the December WASDE report, soybean exports for the 2018/19 marketing year are estimated to reach 1.9 billion bushels and corn exports are estimated to reach 2.5 billion bushels. While the pace of corn exports remains on track with the current estimates, all eyes will be on any adjustments made to soybean export estimates.
Pace of Soybean Exports
USDA’s Feb. 4 Federal Grain Inspection Service report indicated year-to-date soybean export inspections at 790 million bushels, down 39 percent from prior year levels. The current pace represents a 495 million bushel decrease from the 1.3 billion bushels of soybeans inspected through the twenty-second week of the 2017/18 marketing year and a 642 million bushel decrease from two years prior. With 32 weeks left in the marketing year, U.S. weekly soybean exports would need to total 35 million bushels per week to reach USDA’s estimate of 1.9 billion bushels of soybeans exported in marketing year 2018/19.
In recent weeks soybean export inspections to China have accelerated, averaging 14 million bushels per week over the past three weeks and totaling 43 million bushels. However, weekly inspections and year-to-date totals remain well below prior year levels. Year-to-date soybean export inspections total 63 million bushels, 789 million bushels below prior year levels.
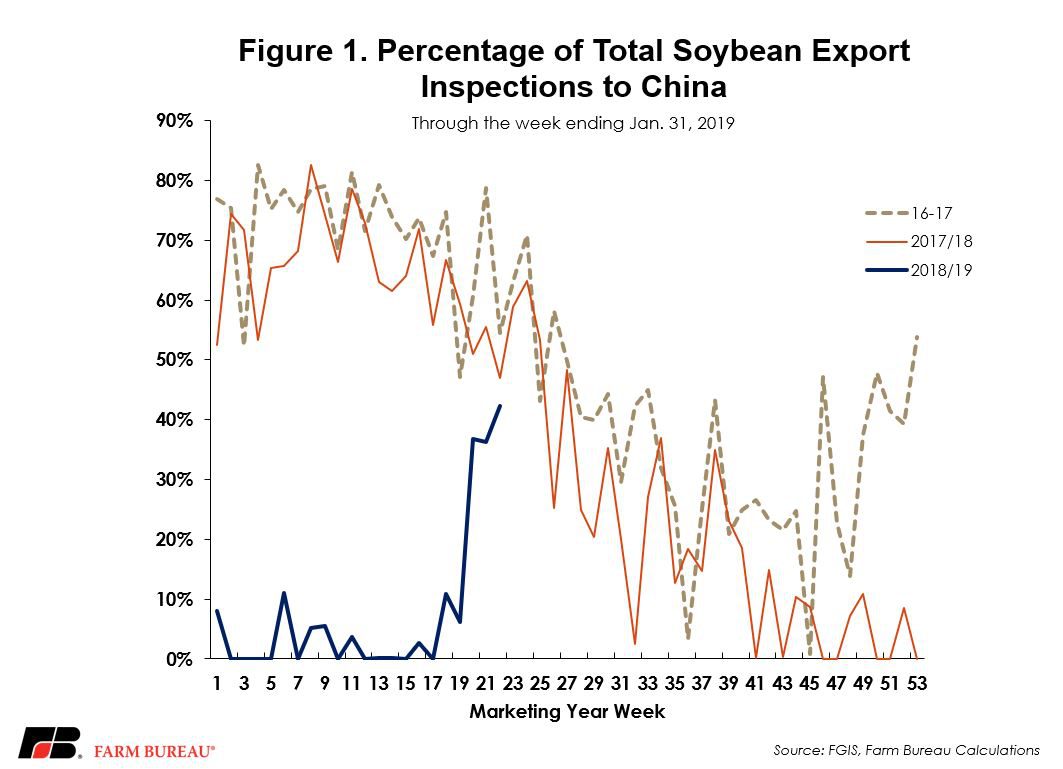
In prior marketing years, and through the end of January, export shipments to China typically represented upwards of 50 percent of weekly export inspections. Until recently, due to the impact of retaliatory tariffs, export inspections to China represented less than 10 percent of weekly exports. Now, following public reports of Chinese soybean purchases, Chinese exports represent nearly 40 percent of weekly inspections. While this is a notable improvement, and a step in the right direction, it should be noted that Chinese purchases, as a percent of total volume, remain below prior year levels. Figure 1 illustrates the percentage of total U.S. soybean export inspection to China.
Top Destinations for U.S. Soybeans
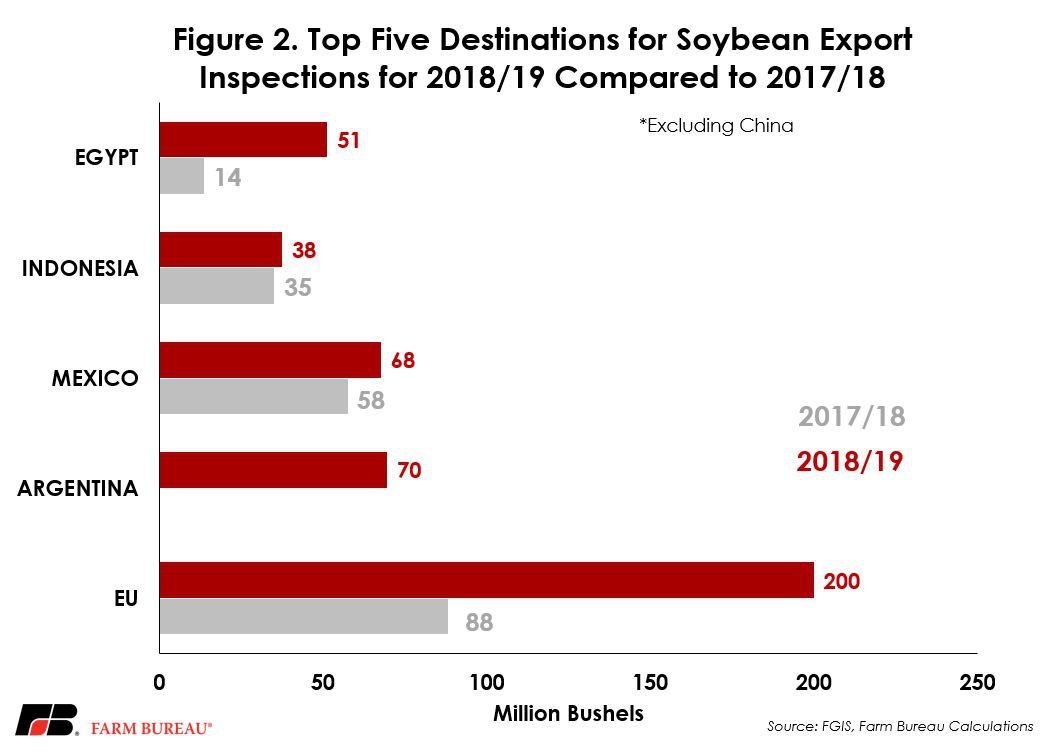
For MY 2017/18, the top three importers of U.S. soybeans were China, European Union and Mexico, with China’s exports dramatically down as other importers increased exports for the first part of the marketing year.
Through the week ending Jan. 31, soybean export inspections are up significantly in other markets such as the EU and Argentina with 112 million bushel and 70 million bushel increases, respectively. Figure 2 shows the top five destinations for U.S. soybeans – excluding China – for the current marketing year compared to the pace seen in the first 22 weeks in the previous marketing year.
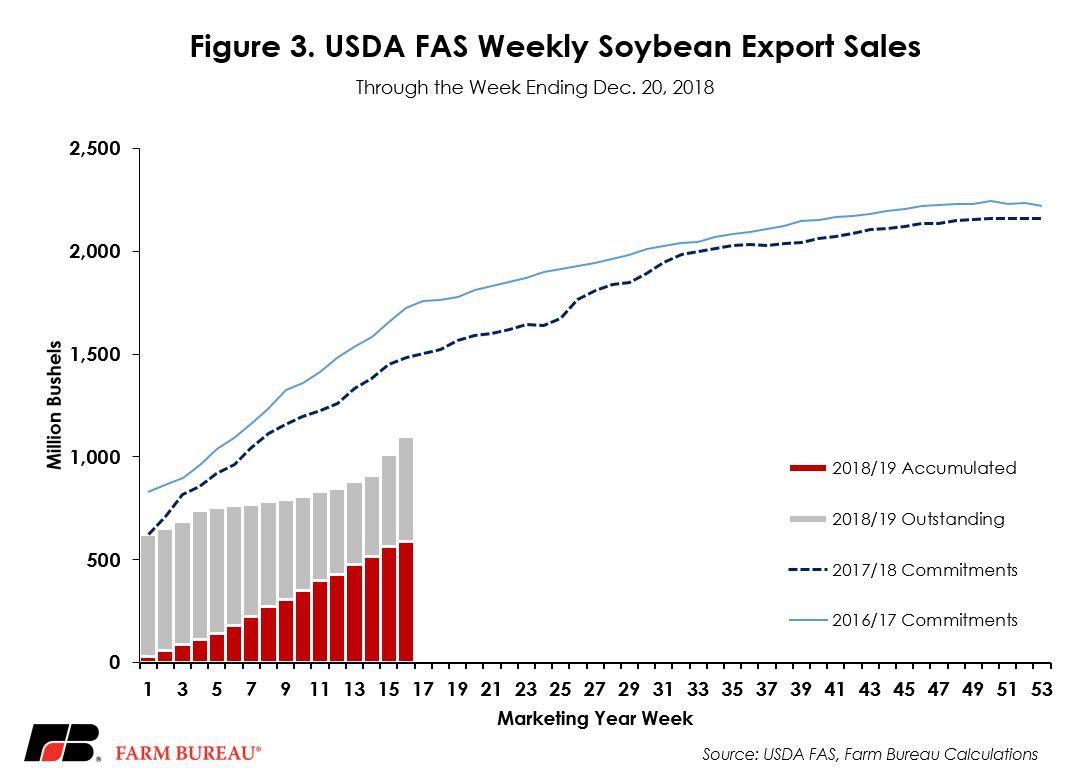
As USDA continues to work on catching up from the historic federal government shutdown, the Jan. 31 Foreign Agricultural Service’s Export Sales Report indicated total committed volume for soybean exports was 1.1 billion bushels, through Dec. 20, 2018. With accumulated soybean exports of 589 million bushels and outstanding soybean sales at 510 million bushels, total committed volume remained down from last year, representing a 384-million-bushel or 26 percent decline. Figure 3 illustrates soybean export sales for the first 16 weeks of the marketing year 2018/19.
Pace of Corn Exports
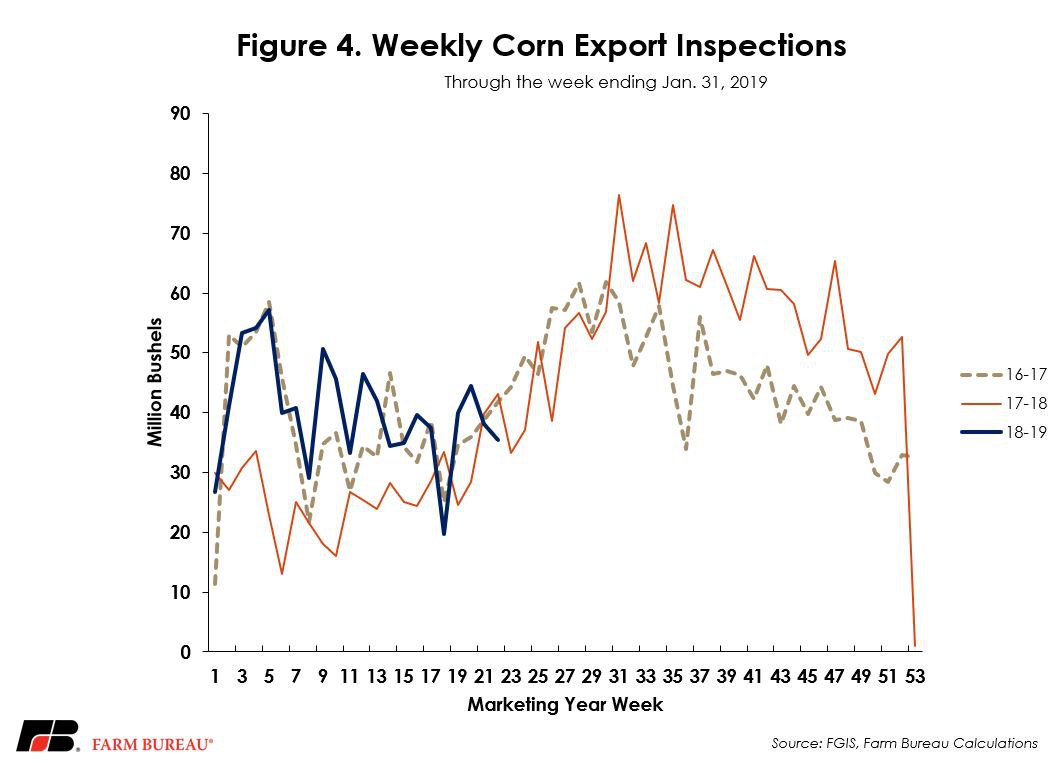
USDA’s Feb. 4 report revealed corn export inspections are up 50 percent from the same time last year with 884 million bushels inspected so far. Since last week, corn export inspections have slowed slightly with a 3 million bushel decrease. The current corn export inspection pace for the twenty-second week of the marketing year is also down slightly from previous years, representing an 8 million bushel decrease from 2017/18 and a 6 million bushel decrease for 2016/17. However, with 35 percent of USDA’s estimated 2.5 billion bushels already exported in the first 22 weeks of the marketing year, the current pace of corn exports remains on track to meet the current WASDE projections. Figure 4 outlines cumulative weekly corn export inspections through the week ending Jan. 31.
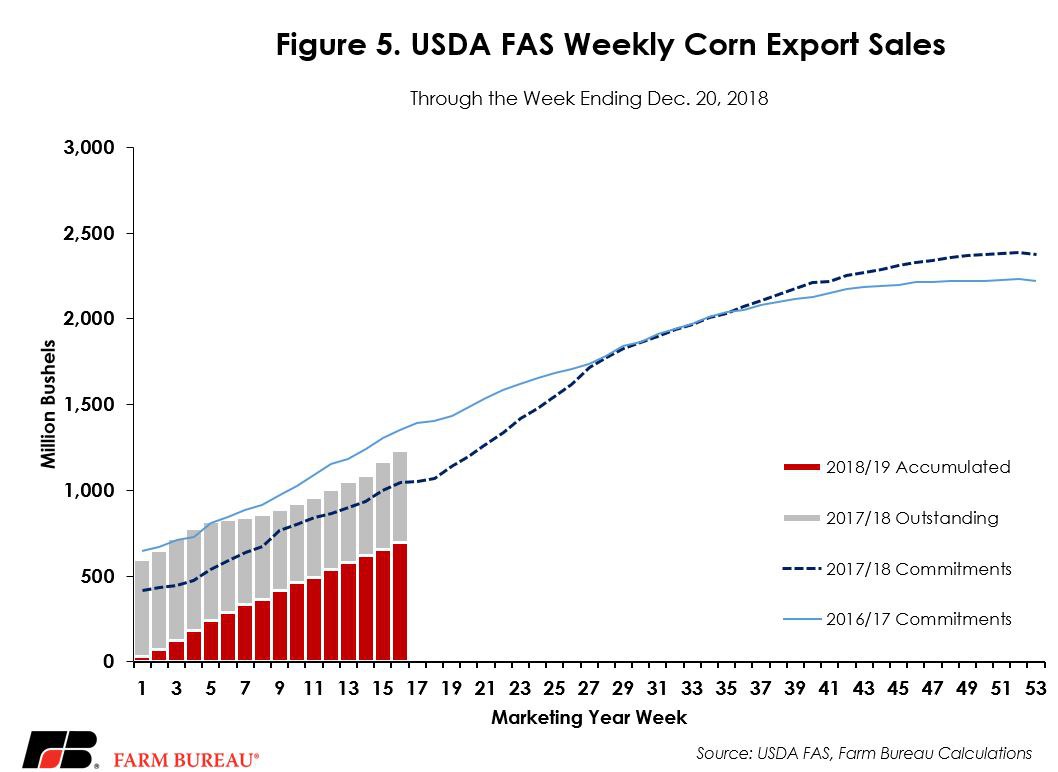
For the sixteenth week of the marketing year, USDA reports accumulated corn exports of 693 million bushels and 540 million bushels of outstanding corn sales. The total committed volume is currently 1.2 billion bushels, representing a 187-million-bushel, or 18 percent, increase from last year’s export commitments. Figure 5 outlines corn export sales for the first 16 weeks of the 2018/19 marketing year.
Top Issues
VIEW ALL