Widespread Port Congestion Threatens Farm Exports
TOPICS
Transportation
photo credit: Getty
Daniel Munch
Economist
“For want of a shipping container, the television didn’t arrive” – a relevant line from AFBF’s latest Market Intel, Inflation and the Supply Chain, describing the impacts of global supply chain shocks from lingering pandemic-induced market forces.
The world’s ocean freight network remains strained from a slate of market failures linked to shifts in consumer behavior and a global economy hesitant to return to normal. A June analysis of the conditions at California’s busiest ports, Congestion at West Coast Seaports Hinders Trade Boom, revealed risks to a significant portion of U.S. agricultural exports. In today’s article we provide an update on the conditions at those ports and others stressed by an onslaught of market shortfalls.
The shift to consumption of goods from services spurred by pandemic-related restrictions continues to pressure markets across the globe, creating a record backlog of freight containers filled with imports at America’s busiest ports. Average monthly import container rates for 2021 are already up 18% at Los Angeles, 17% at Long Beach, 23% at Virginia and 22% at Savannah ports compared to the prior three-year average. With the holiday season quickly approaching, consumer purchases of goods are expected to increase dramatically and will be manifested, partially, in increased container imports.
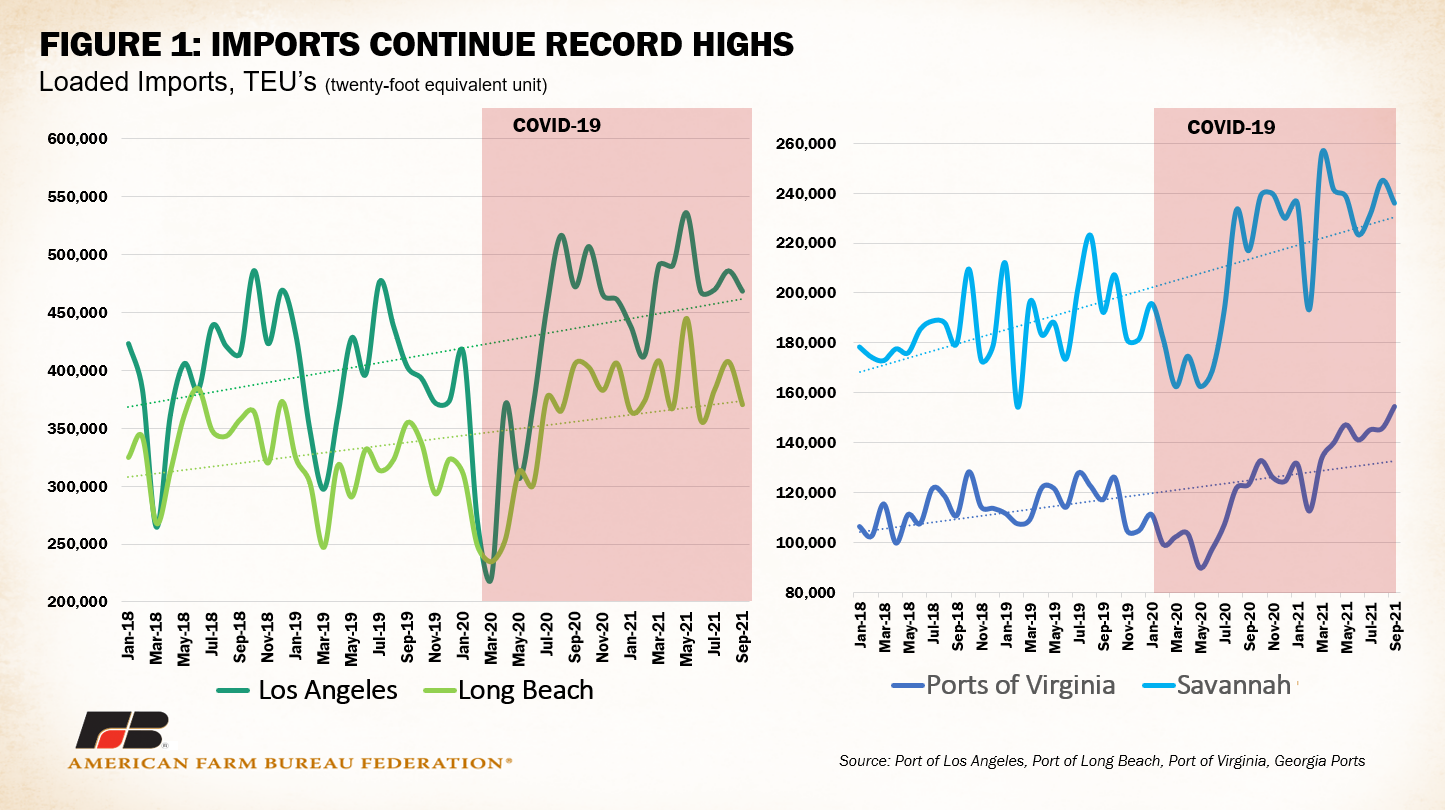
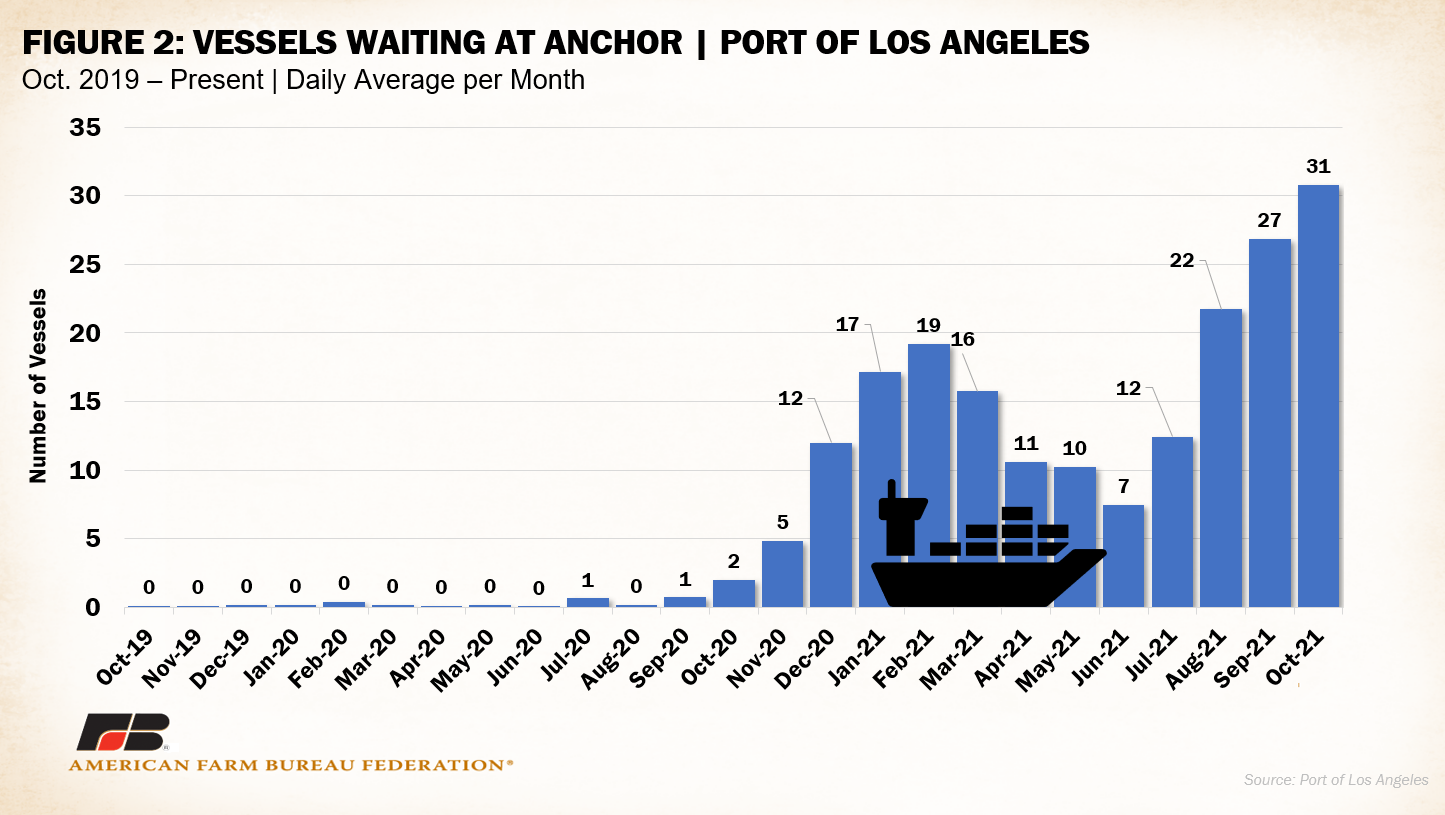
Increased demand for foreign goods results in a higher frequency of shipments, and cargo barges, at seaports. This ups the workload at ports that are structurally limited in their ability to efficiently sort through and load shipments on outbound trucks. For instance, ports only have so many terminals, cranes and workers to process cargo. The Port of Los Angeles handles 17% of all incoming containerized cargo in the U.S., including 5% of domestic agricultural imports. The number of vessels waiting at anchor offshore from LA’s terminals was near zero daily on average between 2019 and 2020 but has since jumped up to a 31-vessel daily average for October 2021, with a peak of 42 ships on Oct. 21. This doesn’t include the vessels waiting at LA’s nearby sister port of Long Beach, which handles an additional 14% of all U.S. containerized cargo and 6% of domestic agricultural imports.
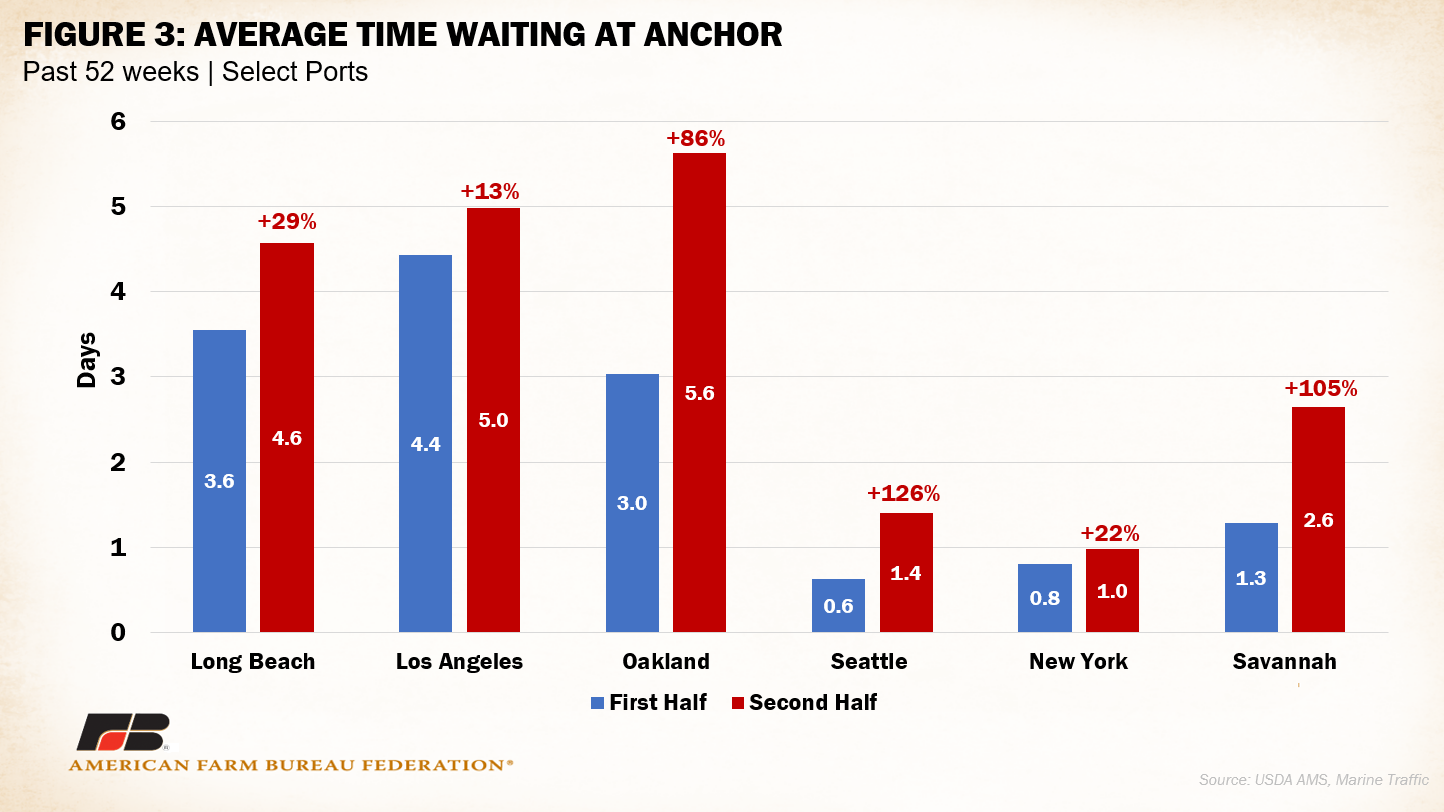
A backlog of vessels waiting at anchor creates a ripple effect throughout the supply chain. Late shipments compound delays on future orders. Another measure of port efficiency is the length of time ships are anchored before berthing. In the past year, wait times at ports across the East and West coasts have increased significantly. Figure 3 displays the change in average wait times between the first and second half of the past 52 weeks. Wait times at Seattle and Savannah have more than doubled.
Increased wait times and delays also disrupt domestic surface transportation networks, including the trucking and rail industries. Trucks scheduled to retrieve freight that is unavailable are directed elsewhere. Reports of increased reliance on truckload spot markets to move goods that arrive within unknown timeframes are widespread, contributing to increased transportation rates. At some ports, unloaded containers with no trucks to retrieve the goods are piled high. This complicates the ability for terminal cranes to quickly sort through and load orders, further exacerbating delays and further overloading the supply chain’s overall capacity.
On Oct. 13, the Biden administration sought to relieve some pressure at U.S. ports using a series of “public and private commitments to move more goods faster.” This included a push for the ports of Los Angeles and Long Beach to operate 24/7 by adding new off-peak nighttime shifts and weekend hours. This almost doubles hours that cargo can be processed from port terminals and onto highways. Correspondingly, many large companies responsible for a considerable amount of port throughput responded to by expanding their own hours of operation. The companies’ ability to expand hours and increase port efficiency is limited by persisting labor shortages across the broader economy.
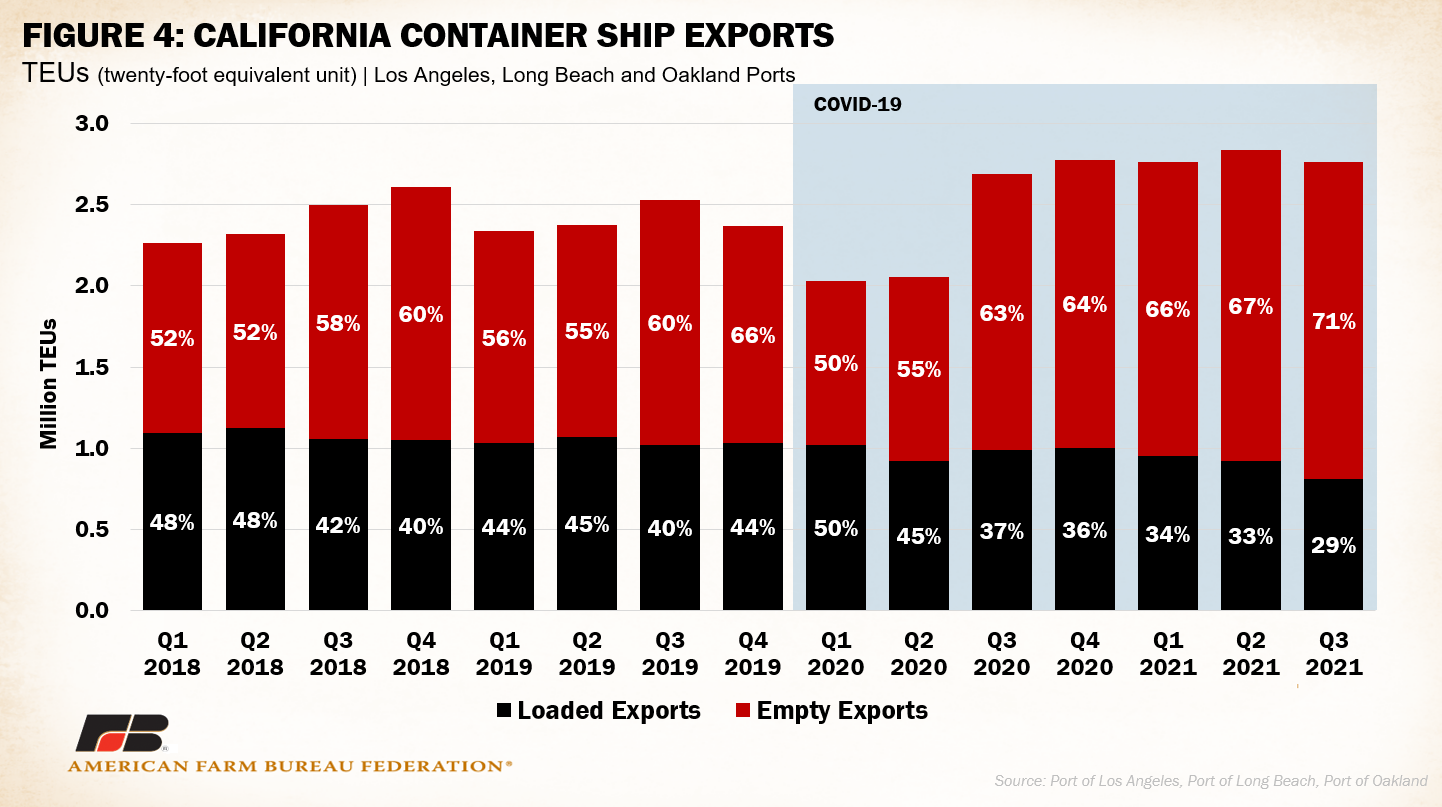
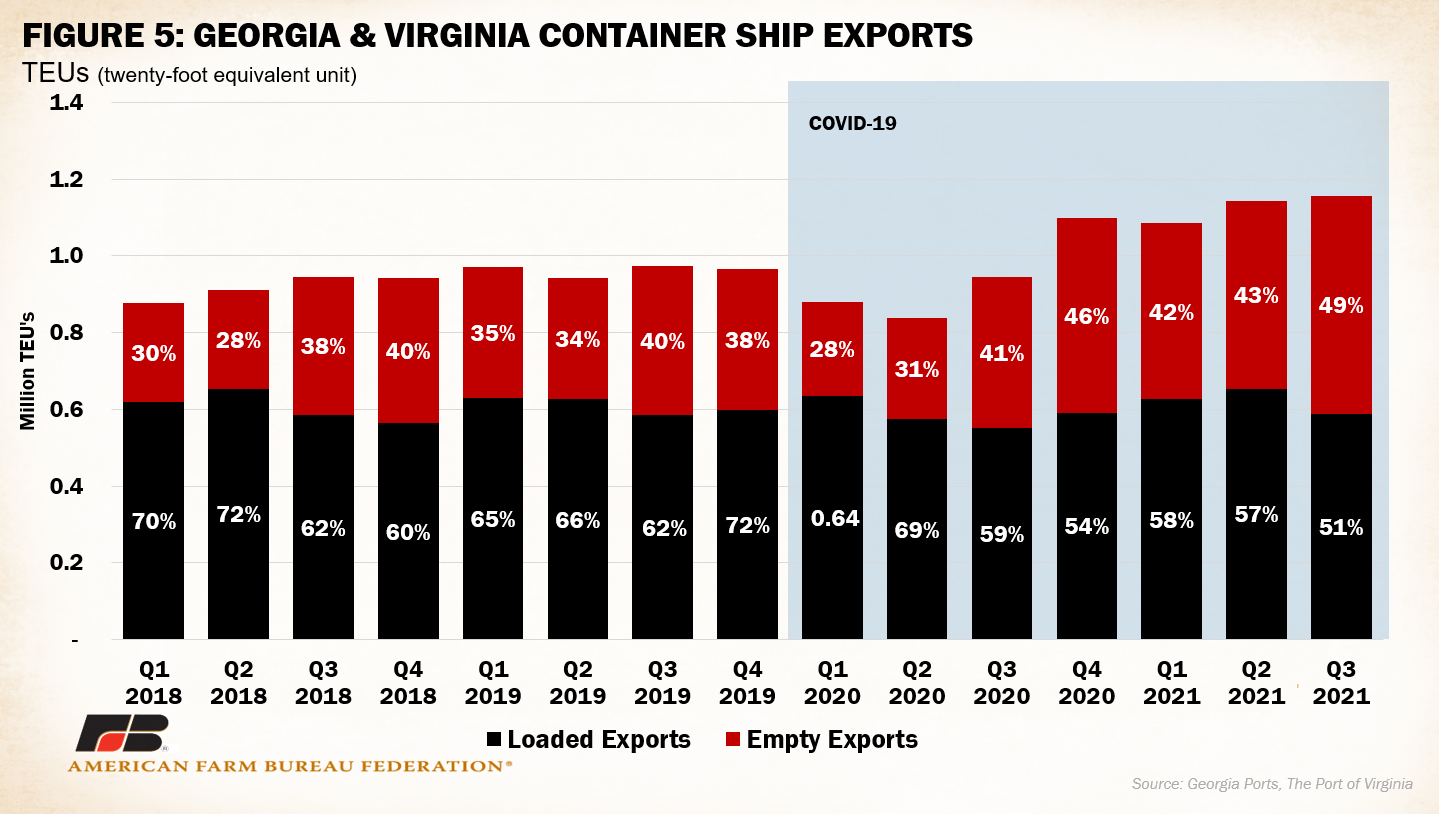
The combined bottleneck resulting from increased domestic demand for goods, infrastructurally limited seaport terminals and a shortage of workers are just a few of the forces threatening domestic manufacturers’ and producers’ ability to move product outward. As touched upon in the previous analysis, some consider it more efficient to ship empty containers rather than wait for export goods to be loaded, which has led to a significant decline in the number of containers available to agricultural exporters. Figures 4 and 5 illustrate the increased proportion of export containers that return empty from both West and East coast ports. In quarter three of 2021, 71% of exported containers from California were empty. At Georgia and Virginia ports, empty export containers reached nearly 50% of export container volume – well above prior-year rates. Though backlogs and pileups of containers have been reported at Savannah’s port, Virginia ports have generally remained spared. Increased proportions of empty export containers at less-affected ports are likely a result of the ripple-effect of delays on national supply chain efficiency. Trucks that are behind schedule due to port delays may be unable to deliver export orders- leaving export containers unfilled.
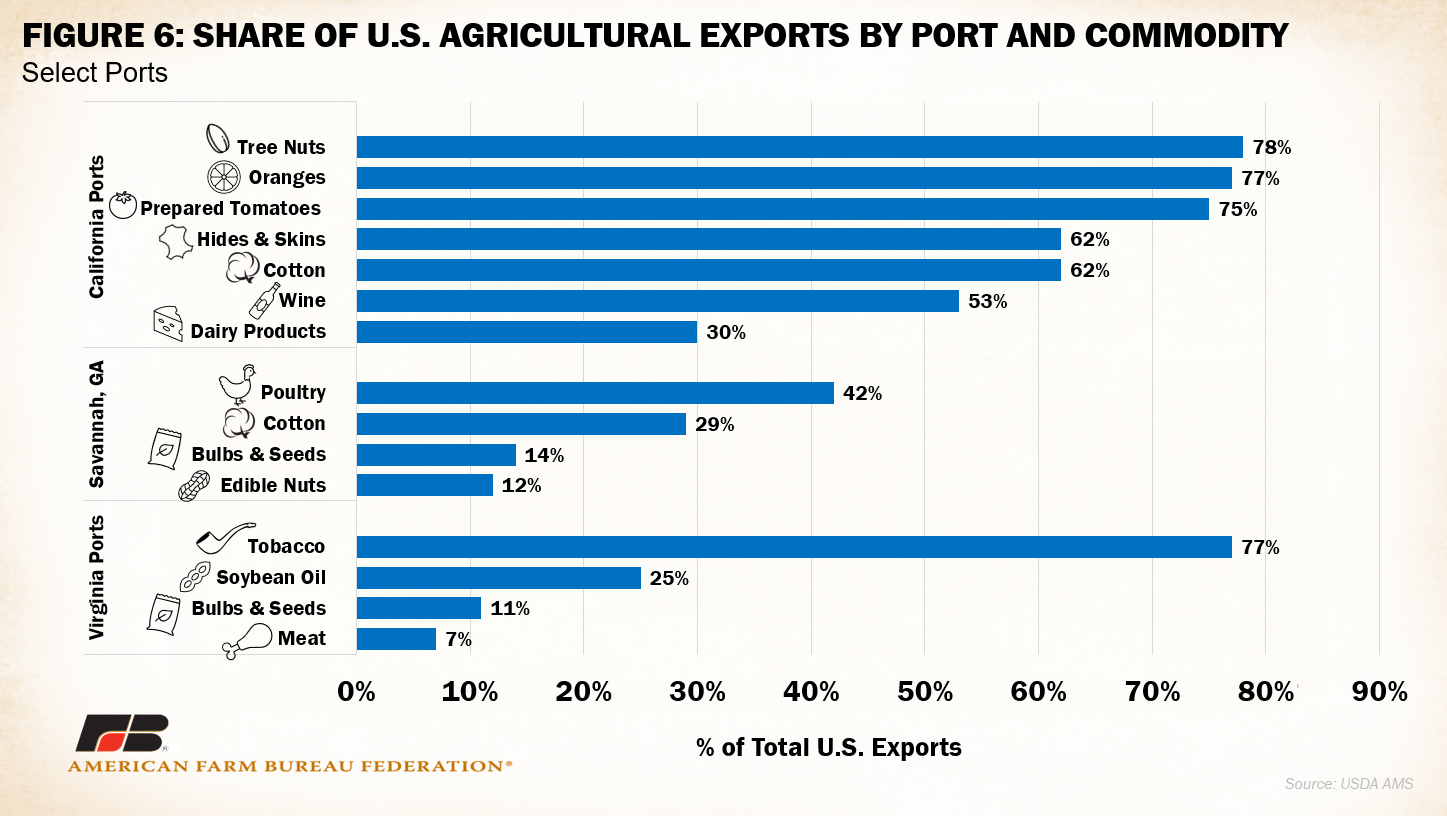
Ports dotted across the country are essential to agricultural export revenues. For instance, California ports are responsible for moving over 75% of U.S. exports of tree nuts, oranges and prepared tomatoes, more than 60% of cotton and hides and over 30% of dairy exports. The Port of Savannah moves 42% of total U.S. containerized poultry exports and an additional 30% of cotton, while Virginia ports process over 75% of tobacco exports. Continued roadblocks to transportation to and available containers at seaports hinders farmers’ and ranchers’ ability to send their products toward its final destination.
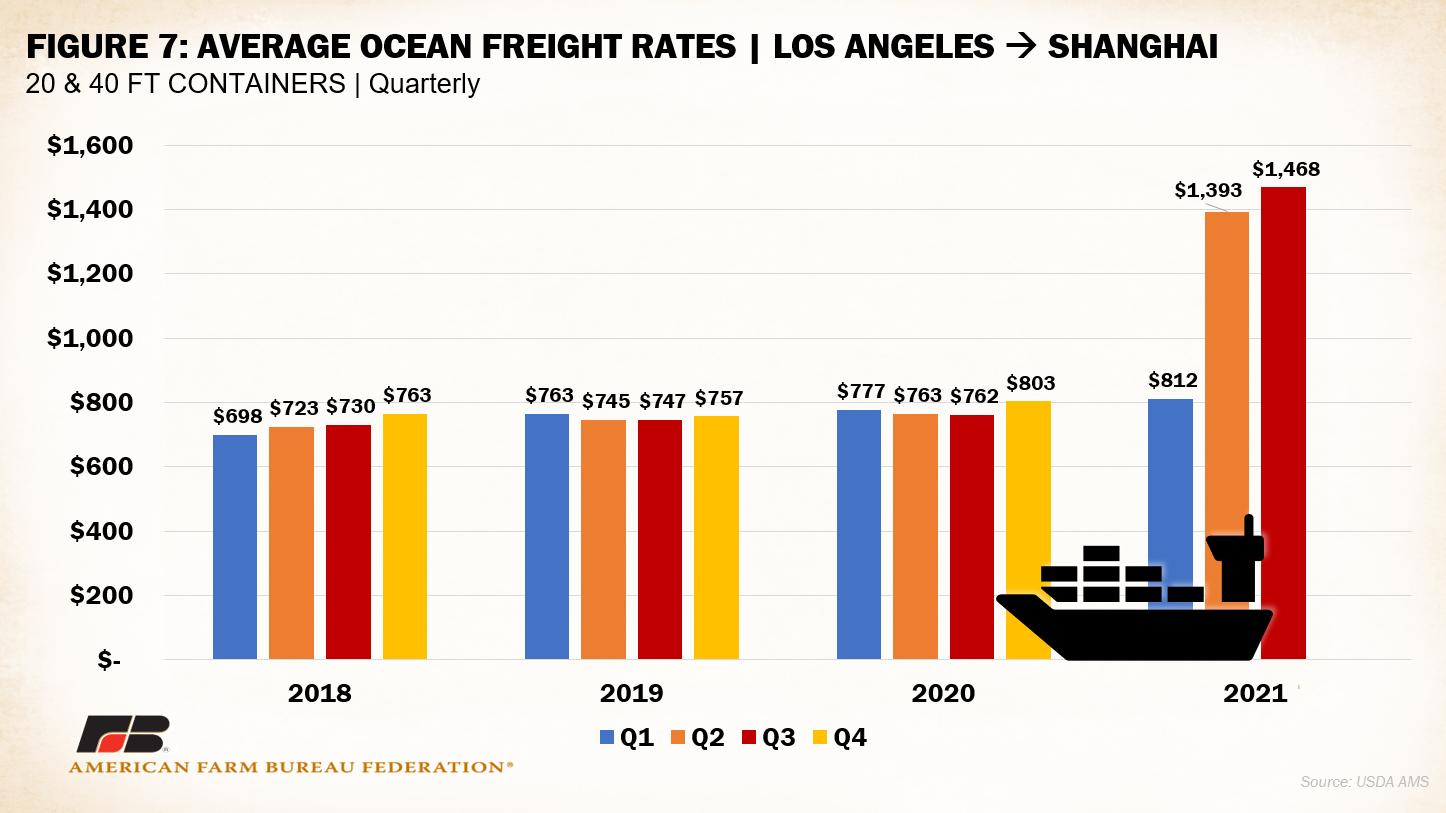
The complex nexus of supply chain disruptions has not only hindered producers’ ability to physically move product, skyrocketing freight rates reduce financial bottom lines for many still recovering from pandemic-era losses. USDA’s Agricultural Marketing Service tracks average ocean freight rates for 20- and 40-foot containers moving from Los Angeles to Shanghai, China. Average rates between the third quarter of 2020 and the third quarter of 2021 nearly doubled (92% increase), going from $803 to $1,468 a container. With farmers and ranchers already facing increased freight rates from railways and trucking, additional costs to move product overseas minimizes the benefits of access to foreign markets, an essential outlet for many U.S. farm and ranch products.
Conclusion
An economy struggling to meet shifts in consumer purchasing behavior has resulted in supply-chain backlogs across the freight transportation sector. Increased demand for imported goods has increased demand for cargo containers. When delays within the transportation system block containers from being returned for reloading in a timely manner the proportion of empty exports, unfilled with American products, grows. These inefficiencies, present at some of the most economically valuable seaports for U.S. agricultural commodities, threaten the bottom lines of farmers and ranchers who rely on foreign outlets to sell their products. The cost of purchased agricultural inputs also increases, tightening already shrunken farm-level margins and putting the solvency of many operations at risk. Efforts to improve port terminal throughput via optimized management approaches, improved access to labor and increased infrastructure investment are essential to fulfilling foreign trade obligations vital to farms and ranches across the country.
Top Issues
VIEW ALL