2019 H-2A Sets Records, While a 2020 AEWR Wage Increase Approaches
TOPICS
Market Intel
photo credit: OSU Special Collections & Archives/Commons
Veronica Nigh
Senior Economist
Q4 Info
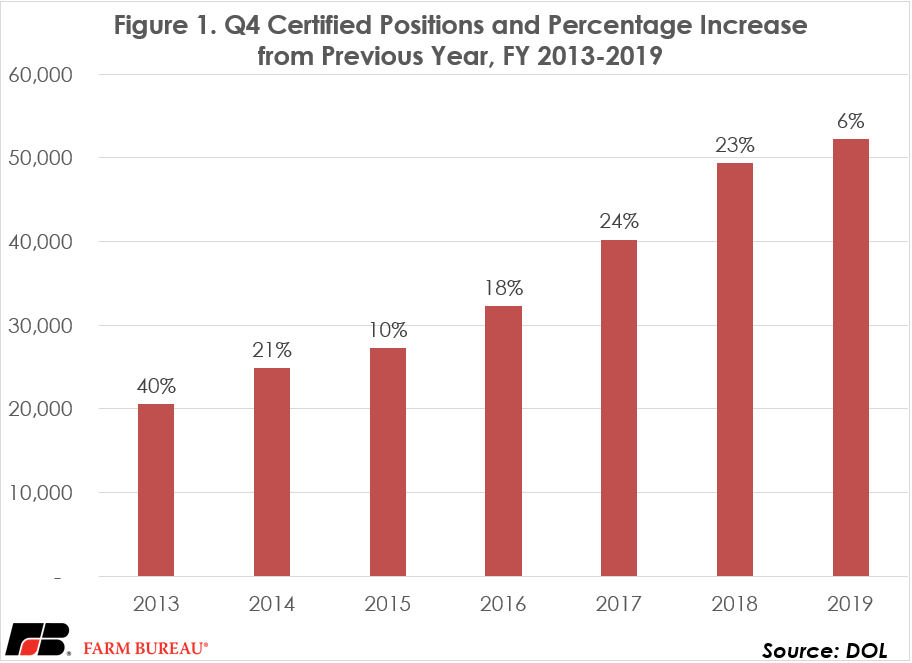
The fourth quarter of fiscal 2019 saw a 6% increase in the number of certified positions compared to Q4 2018. This is the most modest Q4 increase since DOL began making quarterly data available in 2012, as seen in figure 1. This is similar to the slow growth of 2% that was reported in the third quarter of 2019.
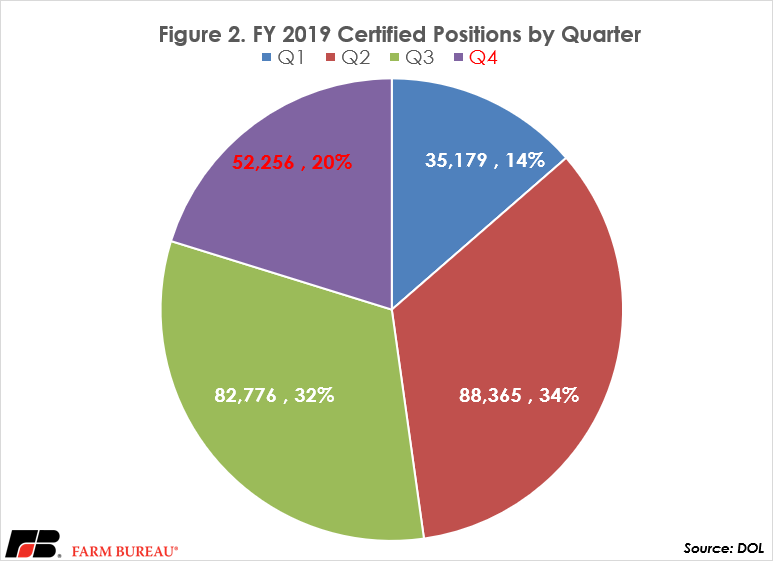
As discussed in our analysis of Q3 data, the marginal increase in the number of certified positions could be a result of poor weather limiting demand for labor or possibly an early indication of diminishing returns to labor on horticultural operations in the U.S. Historically, the fourth quarter (July-September) is the third-busiest quarter for the H-2A program, with 20% of each year’s positions certified then. Some of the requested positions are likely associated with late-season harvest of crops that were affected by poor spring planting weather, while others are associated with fall crops. Only time will reveal the true culprit.
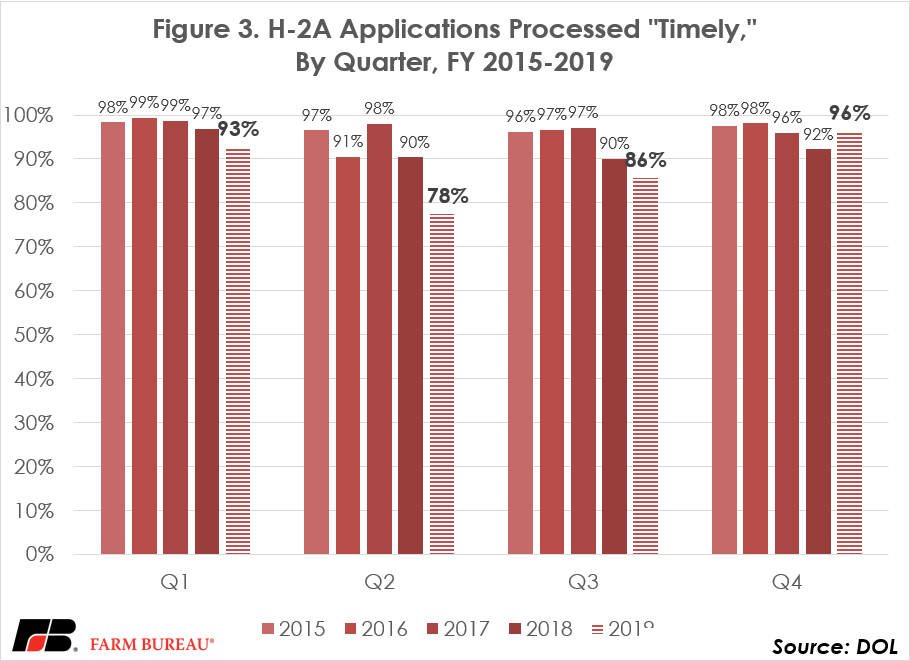
Looking beyond the number of certified positions, DOL’s quarterly data provides some additional useful insights. First, the number of applications processed in a “timely” manner has returned to a high percentage – 96% of applications in the fourth quarter. This is after the share of applications processed in a timely manner fell significantly beyond historical norms in the second and third quarters.
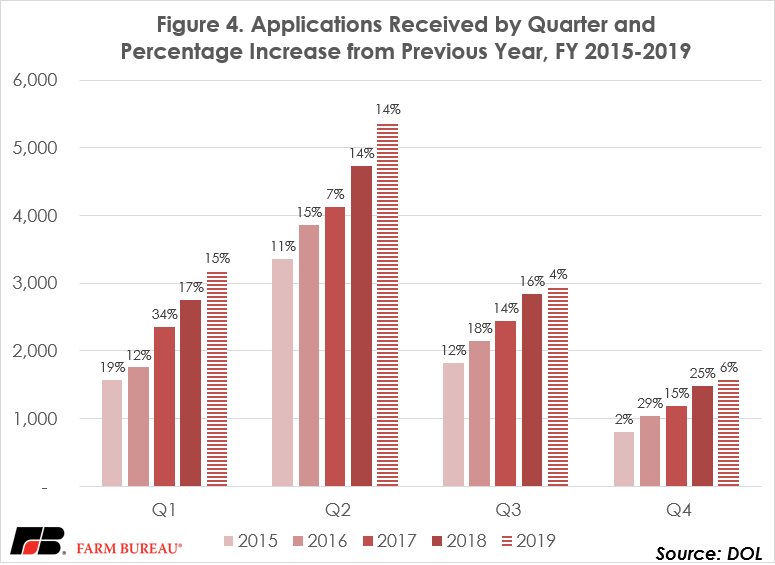
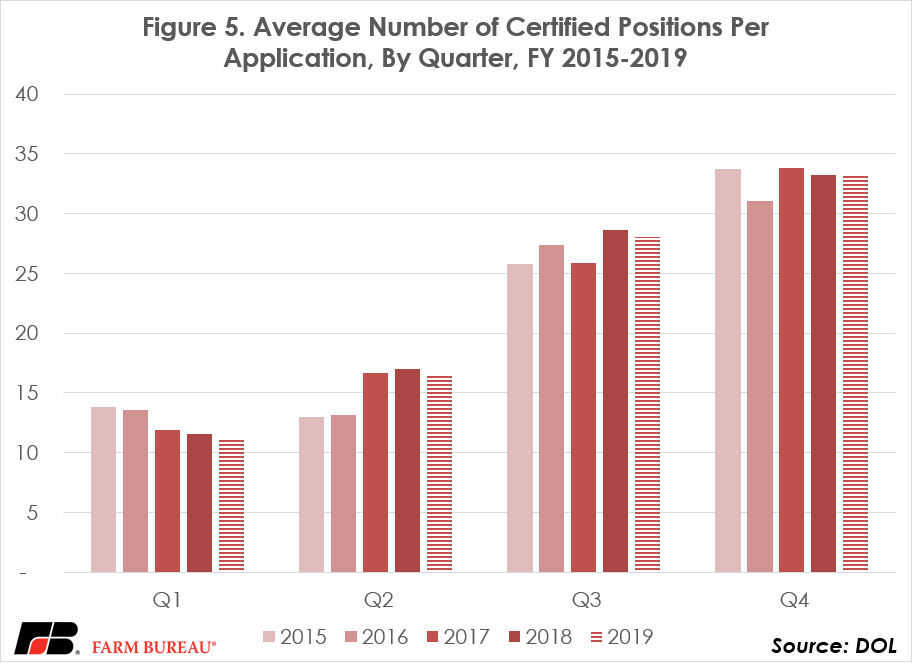
Another insight from the quarterly data is that the number of applications received is increasing, while the number of positions requested per application continues to remain steady. From this we can deduce that the increase in the number of certified positions is a result of a larger number of farms utilizing the H-2A program. If the opposite were true, the number of positions per application was increasing, while the number of applications held steady, then we’d deduce that the increase in positions was a result of existing users switching from an existing labor source to the H-2A program.
Now that fiscal 2019 is complete, it is natural to compare the year to previous years and to look forward to fiscal year 2020. Importantly, fiscal 2019 is the eighth year in a row with a record number of positions certified. The number of positions in fiscal 2019 was 1.85 times greater than the number of positions certified five years ago and 3.27 times greater than the number of positions certified 10 years ago. Meanwhile, the national wage rate applicable to the H-2A program has risen steadily as well. The national wage in 2019 was 17% greater than the 2015 wage and 31% greater than the 2010 wage.
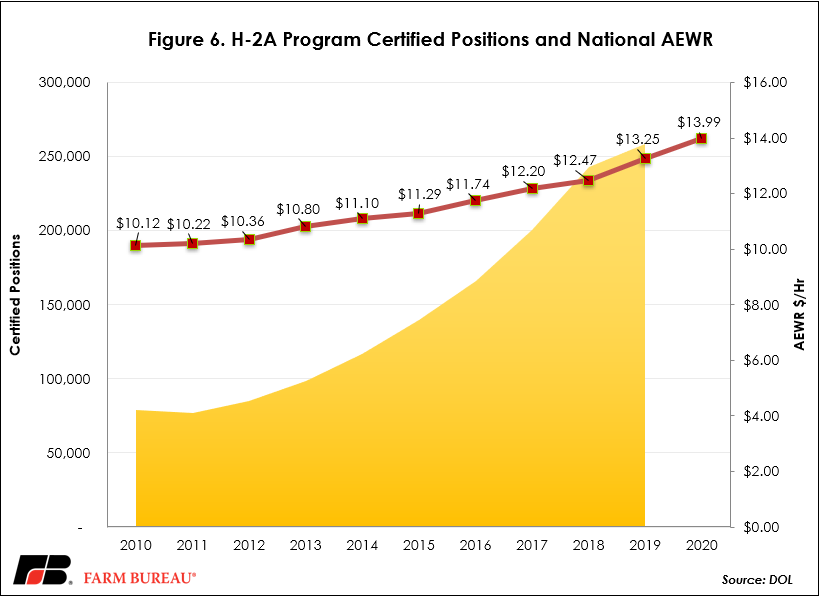
Figure 6 also includes the national average AEWR for 2020. This wage rate is derived from the November 21, 2019, Farm Labor Report. The Field and Livestock worker wage rate in the Annual Average Gross Wage Rates – Regions and United States table of the report serves as the basis for the AEWR, which will officially be notified in the Federal Register in late December. The national average gross wage rate for field and livestock workers in 2019, which will become the 2020 AEWR, is $13.99, an increase of 6% from the previous year. This 2020 wage rate is 19% higher than the 2016 rate and 37% higher than the 2011 rate.
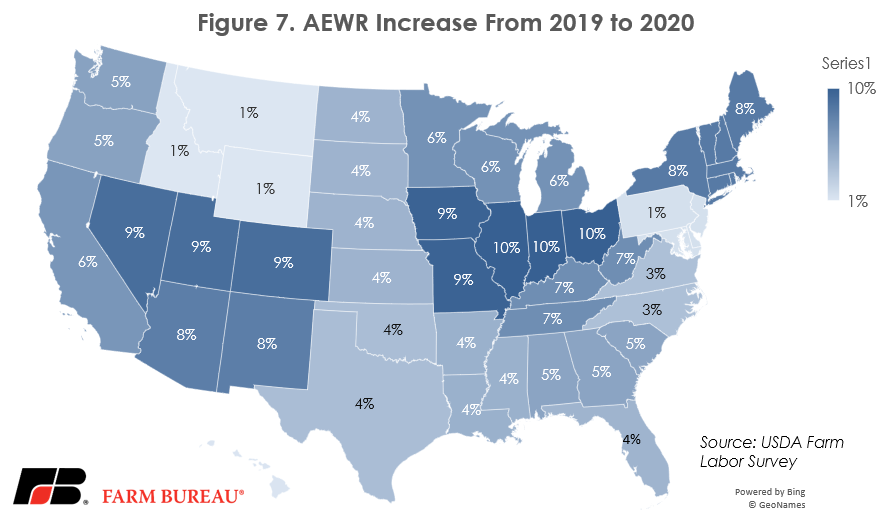
While a national wage rate can be useful to gauge direction, the actual AEWR rates are established according to the Farm Labor Survey’s Farm Labor Regions. In figures 7-9 it is evident why discussing wage rates at the regional and state level is so important. In figure 7, representing the increase in the AEWR between 2019 and 2020, the region with the smallest wage increase of 1% was Mountain 1, which consists of Idaho, Montana and Wyoming. The regional with the largest wage increase of 10% was Cornbelt 1, which includes Ohio, Indiana and Illinois.
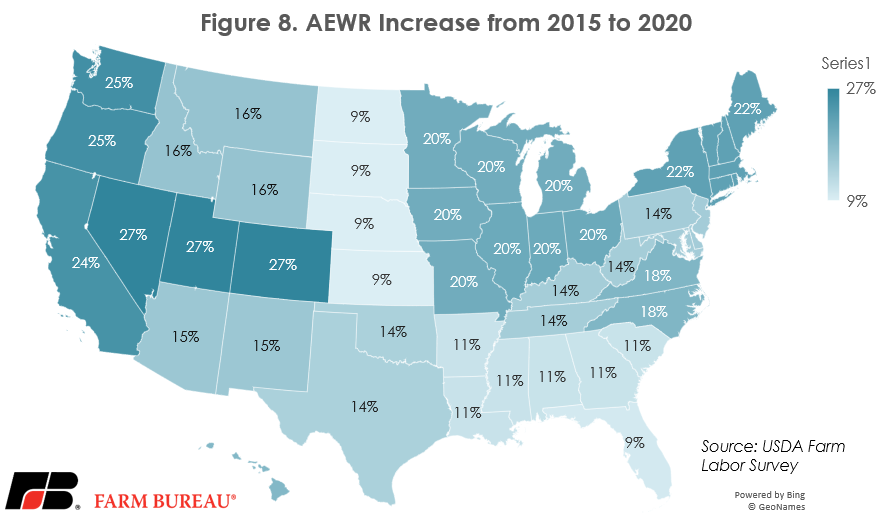
Figure 8 represents the increase in the AEWR over the last 5 years, between 2016 and 2020. The region with the smallest wage increase was the Northern Plains region which includes Kansas, Nebraska, North Dakota and South Dakota, at 9%. The region with the largest wage increases was Mountain II which includes Colorado, Nevada and Utah, at 27%.
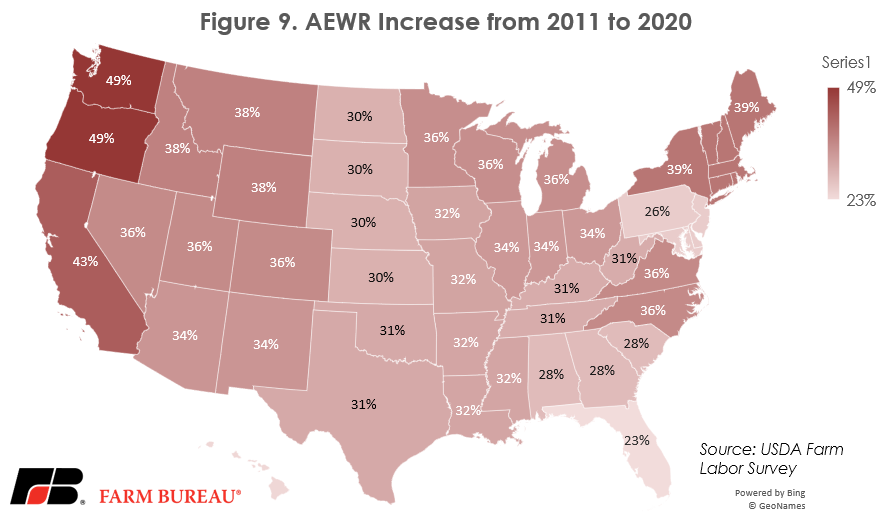
Finally, Figure 9 represents the increase in the AEWR over the last 10 years, between 2011 and 2020. Florida, which is a standalone state, not part of a region, had the smallest wage increase, 23%. The region with the largest wage increase was the Pacific region which includes Oregon and Washington, at 49%.
Summary
Clearly, the H-2A program has become an important component of on-farm manual labor, especially for horticultural operations. While fiscal 2019 ended up being a record with more than 258,000 positions certified, position growth was heavily front-loaded in the first and second quarters. Slower growth in the third and fourth quarters could be the result of poor growing conditions or an early indication that program utilization is peaking. Only time will tell. One thing that doesn’t show any signs of slowing down – the AEWRs farmers are required to pay H-2A workers.