2023 USDA Farm Income Forecast Erases 2022 Gains

photo credit: Mark Stebnicki, North Carolina Farm Bureau
Daniel Munch
Economist
USDA’s most recent Farm Sector Income Forecast, released Feb. 7, anticipates a decrease in net farm income for 2023. U.S. net farm income, a broad measure of farm profitability, is currently forecast at $136.9 billion, down 15.9% from 2022’s $162.7 billion. This $25.9 billion decline erases the $21.9 billion increase that was forecast between 2021 and 2022 but is smaller than the gain between 2020 and 2021 of $46.5 billion following the COVID-19 pandemic. When adjusted for inflation, 2023 net farm income is expected to decrease $30.5 billion (18.2%). The report expects farm and ranch production expenses to continue to increase by $18.2 billion (4.1%) in 2023 to $459.5 billion, following a record increase of $70 billion in production expenses in 2022.
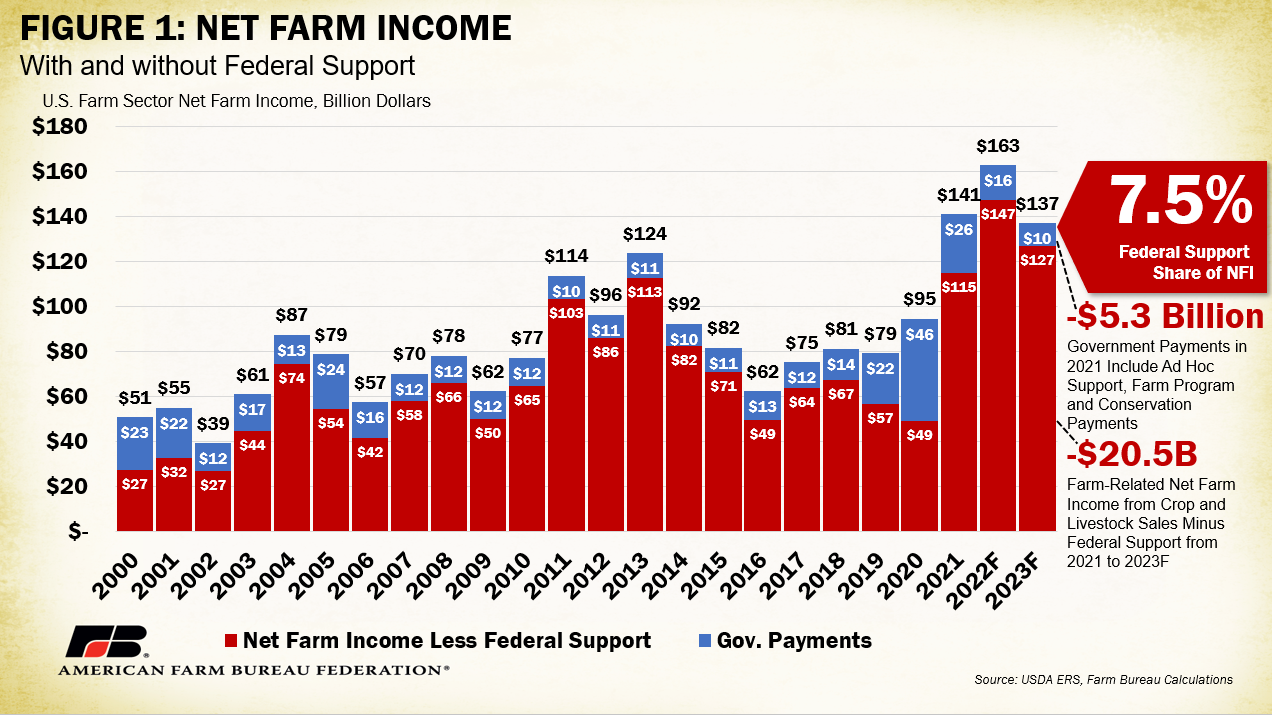
Net Farm Income Breakdown
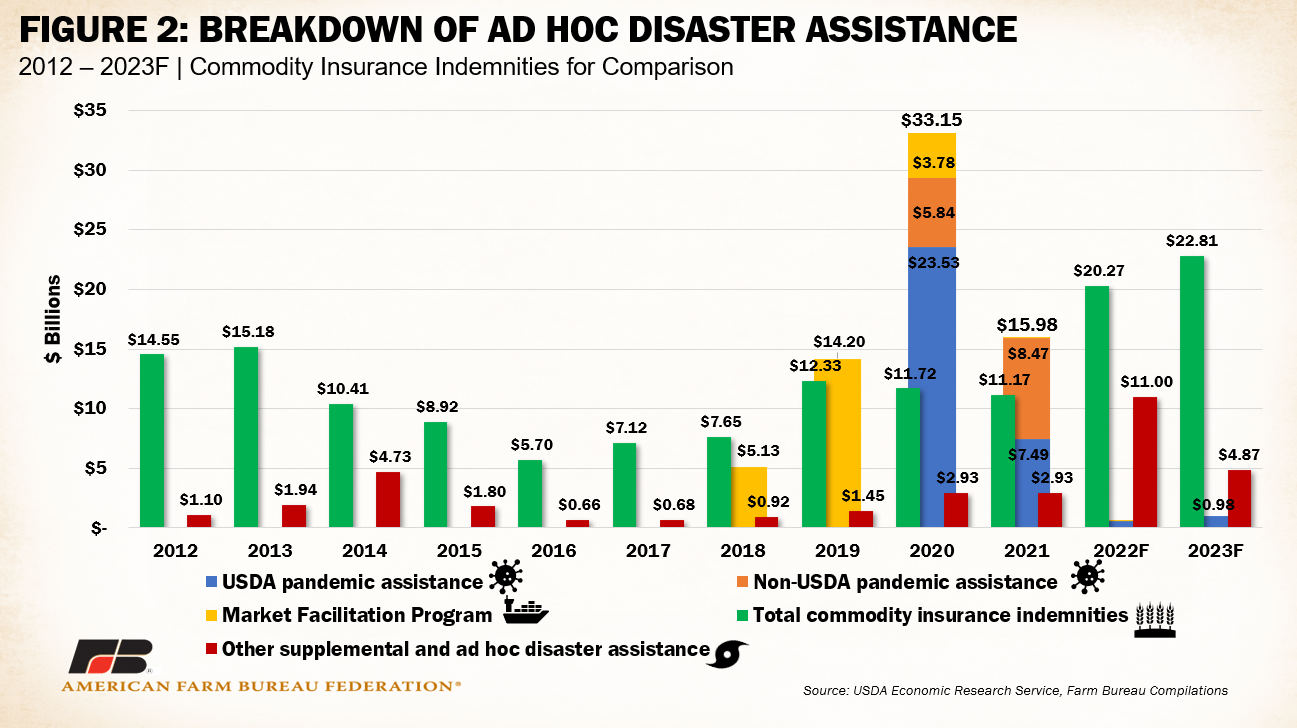
Direct government payments are forecast to decrease by $5.4 billion, or 34.4%, between 2021 and 2022 to $10.2 billion. This marks the third consecutive decrease in government payments for producers since the peak of the COVID-19 pandemic in 2020. As displayed in Figure 2, the decrease corresponds to near total reductions in both USDA pandemic assistance, which included payments from the Coronavirus Food Assistance Programs and other pandemic assistance to producers, and non-USDA pandemic assistance programs, such the Small Business Administration’s Paycheck Protection Program.
Notably, from 2022 to 2023, federal payments through USDA’s pandemic assistance initiatives are expected to increase from $540 million to nearly $1 billion. The Biden administration’s recent announcement of the Pandemic Assistance Revenue Program (PARP) adds more money to a pot that was expected to all but disappear. To be eligible for PARP, an agricultural producer must have been in business during at least part of the 2020 calendar year and have had a 15% or greater decrease in allowable gross revenue. Funding for this program contributes to an expected increase in USDA pandemic assistance. In contrast, non-USDA pandemic assistance remains at $0 between 2022 and 2023. Likewise, the Market Facilitation Program, which provided a series of direct payments to farmers and ranchers impacted by trade retaliation, ended in 2021 and will not be part of net farm income past 2022, when $1.18 billion was paid out. The “other supplemental and ad hoc disaster assistance” category includes payments from the Wildfire and Hurricane Indemnity Program (WHIP+), Quality Loss Adjustment Program and other farm bill designated-disaster programs. Most recently, this includes the Emergency Relief Program (ERP), which replaced WHIP+ for 2020 and 2021 disaster-related crop losses and has paid out over $7.3 billion to producers in Phase 1 as of Feb. 5. The activity under this program pushed payments from the ad hoc assistance category from the original February 2022 projection of $2.9 billion to $10.7 billion – a 264% increase. In 2023 payments under this category are expected to cool to $4.98 billion though many producers continue to wait for payments under Phase 2 of the ERP program, which is currently in open enrollment through June 2. In Figure 2, total commodity insurance indemnities, which are triggered in the event of revenue or yield loss for growers who have purchased crop insurance, are not direct government payments but are included for comparison (and illustrate the importance of these vital risk management options). Commodity insurance indemnities are expected to increase in 2023 by 12.5%, or $2.5 billion, moving from $20.2 billion to $22.7 billion, marking the highest payout of indemnities since the data series began in 2005. This increase is the likely result of increased crop insurance enrollment by those who received a WHIP+ payment and are required to purchase crop insurance or Noninsured Crop Disaster Assistance Program coverage (when crop insurance is not available) for the next two available crop years– a requirement of ERP also.
Livestock
The largest decrease in net farm income is tied to a projected fall in cash receipts from livestock due to lower prices for all major categories except cattle. The value of livestock production (in nominal dollars) is expected to decrease nearly 6%, or $14.7 billion, in 2023. Chicken eggs and milk are responsible for the largest percentage decreases, with cash receipts for chicken eggs projected to decrease by $4.9 billion or 24%. Highly pathogenic avian influenza has affected over 52 million birds in commercial flocks in the U.S., including over 43 million egg layers, pressuring supplies and pushing up prices. As the flock recovers, egg production increases and consumer demand fundamentals recalibrate prices lower. Milk receipts are similarly expected to decline $8.4 billion (14.6%) on expectations for higher milk production and lower corresponding prices.
Cash receipts for cattle and calves are estimated to increase by $2.1 billion or 2.4%. As described in previous iterations, drought conditions in the West and southern Plains have damaged pastures and led to higher costs for feed such as hay. This has resulted in many farmers marketing heifers that would typically be kept for breeding and herd replacement and thus a reduction in U.S. cattle inventory that will continue for years to come. Tighter cattle supplies have pulled both cash and futures prices higher, leading to continued growth in cash receipts.
Crops
On the crops side, receipts for major row crops like corn and soybeans are expected to decline while wheat and hay are expected to increase. Receipts for corn are expected to fall by 4.5% ($4.1 billion), while soybeans are expected to be down 8.1% ($5.2 billion). Wheat is expected up 4% ($0.6 billion) and hay receipts are expected to grow by $0.6 billion (6.1%). Fruits and nuts are expected to hover close to $30.8 billion in receipts while vegetables and melons are poised to fall from $21.8 billion to $19.9 billion (-8.6%). The vast majority of expected receipt declines are linked to falling prices rather than volume dynamics. Weather and climate conditions will have strong impacts on the true outcome of this year’s price outlook. Extreme drought that has pushed up hay and wheat prices could subside marginally after a winter of strong (so far) Western precipitation and snow. Record production in foreign corn and soybean players like Brazil and Argentina are competition for U.S. crops overseas, particularly in China. Uncertainty related to Mexico’s commitment to ban GMO corn for human consumption and the ongoing Ukraine-Russia conflict remain.
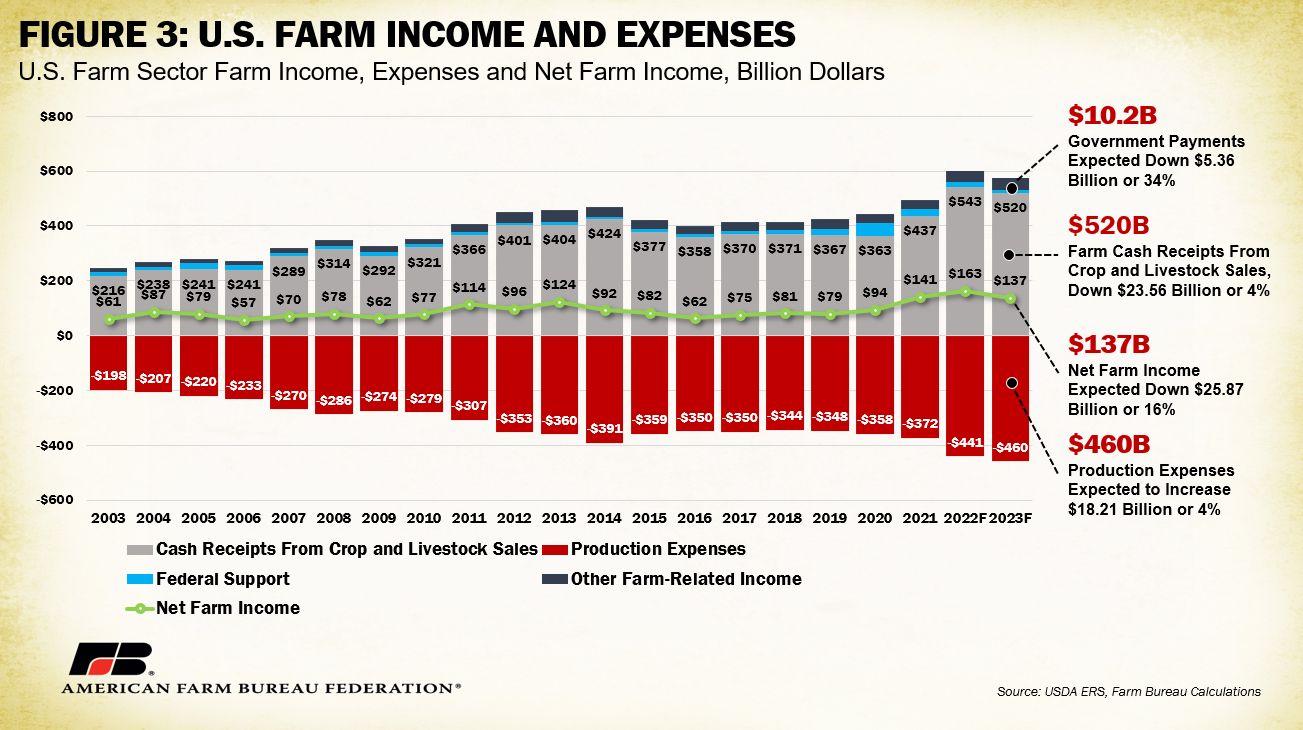
On the cost side, production expenses, including operator dwelling expenses, are forecast to increase for a sixth consecutive year, growing in 2023 by $18.2 billion, or 4.1%, to reach a record $459.5 billion. And while it’s little consolation, some major input items such as cumulative feed costs, fertilizers and fuels and oil are expected to decline from record highs. Feed costs, which represent the largest single expense category, are expected to decline $3.92 billion to $72.66 billion (-5%). Fertilizers, lime and soil conditioners are expected to decrease $1.25 billion, or 3%, from $43.42 billion to $42.17 billion. Typically, fertilizers represent about 15% of a crop farmer’s costs and any increase, regardless of magnitude, can be crushing for some producers, especially in times of declining revenue. Fuels and oils are expected to experience the largest percent decline – 17% – from 2022, moving from $20.25 billion to $17.1 billion. These drops, however, are easily outpaced by increases in other expense categories including marketing, storage and transportation, which are forecast to increase 11%. Labor costs are expected up across all subcategories with cash labor forecast to move from $39.2 billion to $42.08 billion (+7%). Inflation, currently sitting at 6.5%, has pressured interest expenses as the Federal Reserve Bank attempts to bring inflation under control through higher rates. Between 2022 and 2023, interest expenses, including operator dwellings, are expected to jump 22%, going from $27.6 billion to $33.84 billion, making it more difficult for farmers and ranchers to acquire lines of credit to purchase inputs and equipment this year. Livestock, seed, electricity, repair and maintenance are among the other categories expected to increase in price.
Other farm income, which includes things like income from custom work, machine hire, commodity insurance indemnities and rent received by operator landlords, is estimated to increase by $3.2 billion, or 8%, from $42 billion to $45.2 billion in 2023. But when all these factors are accounted for, the resulting expectations for net farm income decline become apparent, as illustrated in Figure 3.
Other Considerations
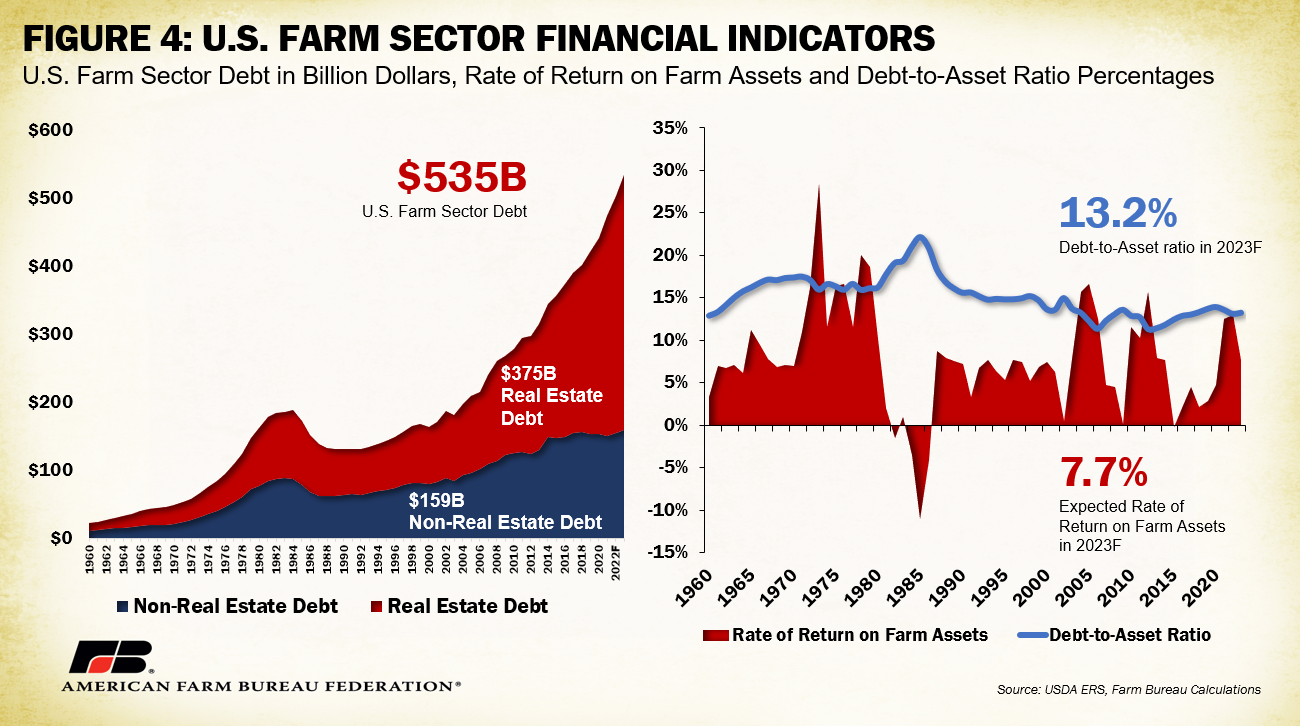
USDA’s Farm Sector Income Forecast also provides expectations of farm financial indicators that can give insight into the overall financial health of the farm economy. During 2023, U.S. farm sector debt is projected to increase $31.19 billion, or 6.2%, to a record $535 billion in nominal terms. Nearly 70% of farm debt is in the form of real estate debt, for the land to grow crops and raise livestock. Real estate debt is projected to increase $26.79 billion to a record-high $375.8 billion, largely due to an increase in land values across the country. Non-real estate debt, or debt for purchases of things like equipment, machinery, feed and livestock, is projected to increase by $4.4 billion to a record $159.1 billion. The value of assets regularly being purchased with debt is rising, which means it will continue to be important for farmers and ranchers to pay down debt and cover interest to maintain a healthy balance sheet, an endeavor that will be even more cumbersome within a high interest environment.
Based on 2023 debt and asset levels, USDA expects the debt-to-asset ratio to be 13.22% for 2023, which sits marginally below the prior five-year average (13.5%), meaning farmers are expected to hold steady on borrowing to finance the purchase of assets. Higher interest rates will likely act as a barrier for farmers to finance new assets moving forward.
Working capital, which takes into consideration current assets and liabilities, is the amount of cash and cash-convertible assets minus amounts due to creditors within 12 months. In 2023, working capital is projected to fall by $14.9 billion, or 8.9%, to $118 billion, which is the first decline since 2016, and sits at $2.5 billion below 2014 levels, when farmers and ranchers held $121 billion in working capital. Lower levels of working capital often suggests that many U.S. farmers have just enough capital to service their short-term expenses and debt, which becomes more difficult as interest rates rise. To borrow a phrase from the 46th President of the United States, it’s not a lot of “breathing room.”
Another metric that highlights the concern about farmer profitability in 2022 is the rate of return on assets. For 2023, the rate of return on assets is projected at 7.7%. This is a drop from 2021 and 2022 when returns were up over 12.5% but remains above returns experienced between 2014 and 2020. Compared to 2021 and 2022, farmers and ranchers are seeing smaller revenues or returns for the investments made in the cost of production and in assets used to produce a farm product; the opposite is true from 2014-2020. Figure 4 highlights the U.S. farm sector debt, the debt-to-asset ratio and the rate of return on farm assets.
Summary
USDA’s most recent estimates for 2023 net farm income provide a very early estimate of the farm financial picture. For 2023, USDA anticipates a decrease in net farm income, moving from $162.7 billion in 2022 to $136.9 billion in 2023, a decrease of 16%. Much of the forecasted decline in 2023 net farm income is tied to lower crop and livestock cash receipts, continued increases in production costs and a decrease in ad hoc government support, resulting in an overall decrease of forecast net farm income. It is important to highlight the early nature of this forecast. In February 2022 USDA forecast that net farm income would decline that year by 4.5%. In the September 2022 update that decline was flipped to a 5.2% increase and in the final December 2022 update this 5.2% increase was pushed to a 13.8% increase. The change in the February and December forecast was the difference between general farm economy income decline and record cash receipts. Much uncertainty remains related to the ability of farmers and ranchers to cost-effectively access inputs and deal with regional regulatory and weather-related challenges. With an early expectation of revenue declines, which more than erase gains made during 2022, it becomes all the more important for producers to have clarity on rules that impact their businesses’ ability to operate, for producers to have access to comprehensive risk management options and for producers to be given a resounding voice during formulation of vital legislation such as the farm bill, which can either complicate or streamline farmers’ and ranchers’ ability to contribute to a reliable and resilient U.S. food supply sustainably.
Top Issues
VIEW ALL