Advanced Pricing of Class I and II Milk Contributes to Disorderly Marketing Conditions

photo credit: Getty
Daniel Munch
Economist
On Aug. 23, USDA began hearing testimony on proposals to amend the Federal Milk Marketing Order system. Now in week seven of testimony, 21 submitted proposals continue to be discussed and examined by USDA and dairy industry stakeholders. Testimony on category four, which covers base Class I skim milk price adjustments, including advanced pricing dynamics, is currently being heard. Several organizations argue that the current use of advanced pricing for Class I and Class I skim milk in conjunction with the “average-of” plus 74 cents formula has contributed to disorderly marketing conditions and non-uniform pricing for dairy farmers.
Background
The Federal Milk Marketing Order system establishes provisions under which dairy processors purchase milk from dairy farmers supplying specific marketing areas. One of the primary functions of the federal order structure is the calculation of minimum uniform prices paid to farmers. USDA does this by attempting to calculate the value of raw milk used in a dairy product based on the value the dairy product garnered in the marketplace (its end use).
Currently, the FMMO system categorizes milk into one of four classes, based on what dairy products it is used to make. Each class of product has a different value in the market so that the price dairy product manufacturers pay reflects the final market value of those goods. The four class prices are currently as follows: Class I – milk used for beverages; Class II – milk used in soft products like ice cream, sour cream and cottage cheese; Class III – milk used in hard cheese and spreadable cheeses; and Class IV – milk used to produce butter or powdered dairy products. USDA uses the value of sold commodity dairy products and works backward to determine the value of raw milk in those products. The primary reason for using a classified pricing system is that it promotes raw milk price equity among handlers and farmers. The intention is to ensure handlers in a similar location and who produce similar products pay the same minimum classified price for the raw milk and that farmers producing milk in the same area receive the same price (i.e., uniform pricing).
Under classified dairy pricing, handlers participating in an order have an obligation to the pooling function of federal orders based on the Class price. It is important to note that not all handlers must participate in pooling. Only Class I handlers are required to pool their milk every month. Class II, III and IV handlers can remove their milk from the order, or “de-pool,” in certain months if they so desire. Different orders have different regulations governing how and at what pace handlers can re-pool milk on the order if they decide to not participate.
In seven of the 11 federal orders dairy farmers are paid based on the component content of their milk via what is known as multiple component pricing. In this process, the producer value of milk is determined monthly based on the cheese milk (Class III) component levels of fat, protein and other solids. The difference between the total pooled revenue from what handlers pay via the set Class price and the component value worth of producer’s milk is denoted as the producer price differential. When the component value of milk in the pool is higher than revenue pooled from paid Class prices, deductions are applied to farmers in the form of a negative producer price differential. Dairy farmers were repeatedly confronted with negative PPDs during 2020 and 2021, with average all-market PPDs reaching over -$7 per hundredweight – showing up as a massive deduction on milk checks. This often leads to handlers withdrawing milk from the pool.
The most common of the many factors that contribute to the existence of negative PPDs are: Class III milk value rising above the butter-powder (Class IV) milk value, changes in utilization rates of milk due to production changes in an order, the advanced prices for Class II skim and Class I milk lagging behind rising Class III component prices, and changes in utilization due to de-pooling by handlers deciding to not pool milk in an order for one or more months by which de-pooling leads to more de-pooling.
Advanced Pricing
Currently, the classified prices for each month are announced at two different times. First, the advanced prices are announced by the 23rd day of the preceding month. For example, September’s advanced prices are announced on or before Aug. 23. Advanced minimum prices are announced for Class I, Class I skim, Class I butterfat, and Class II skim. By the fifth day of the following month, the Class II, Class II butterfat, Class III, Class III skim, Class III butterfat, Class IV, Class IV skim, and Class IV butterfat prices are announced. These prices for September are announced on or before Oct. 5. This arrangement creates a long lag between when the advanced prices and current prices are announced for that same month and means that the advanced prices (Class II skim milk and components and Class I skim milk and butterfat) can be based on weekly data that is 25 to 40 days older, on average, than the basis for the “current” prices (Class II butterfat and all Class III and IV prices).
This means when market prices rally, announced (final) prices can be much higher than advanced prices, leading to low and negative PPDs. This creates an incentive to de-pool milk from the order to benefit from the non-pooled value of the recently elevated prices (without sharing that value with the pool), which further depresses the PPD, and undermines the FMMO principle of uniform pricing.
The impact of advanced pricing on orderly marketing of milk is not new to Federal Milk Marketing Order discussions. USDA has acknowledged the impact of lagging fluid and manufacturing Class pricing on orderly marketing of milk in previous analyses. In USDA’s proposed rule published in Federal Register Volume 64, number 63, released on April 2, 1999, they wrote:
“Since Class I handlers must compete with manufacturing plants for supply of milk, the Class I price must be related to the price of milk used for manufacturing.
“It is apparent from the price patterns of a large part of 1998 that the current two-month lag between manufacturing and fluid pricing does not establish as close a relationship between the two price levels as is desirable. Indeed, from an analysis of the differences between prices generated by a six-month declining average and the current pricing system, it is clear that the current two-month lag does not accomplish any closer relationship between manufacturing and fluid prices than would the six-month declining average.
“When manufactured dairy product prices are relatively stable the advance pricing of Class I milk works quite well. However, since 1988 the volatility in the manufactured dairy product market has caused problems with the advance pricing of Class I milk. The first problem is readily evident in class price relationships during the latter part of 1998. The frequent occurrence of price inversions during that period indicates that some alteration to both theproposed and current methods of computing and announcing Class I prices may be necessary. Class price inversion occurs when a market's regulated price for milk used in manufacturing exceeds the Class I (fluid) milk price in a given month and causes serious competitive inequities among dairy farmers and regulated handlers. Advanced pricing of Class I milk actually causes this situation when manufactured product prices are increasing rapidly.
“Since the Class I price is announced in advance, in a rapidly changing market the Class I price may not reflect the value needed to compete for the necessary raw milk supply or the Class I price may be overvalued relative to the raw milk price. Undervaluing Class I milk is a particular problem since it reduces producers' pay prices at a time when the producers should be receiving a positive price signal.”
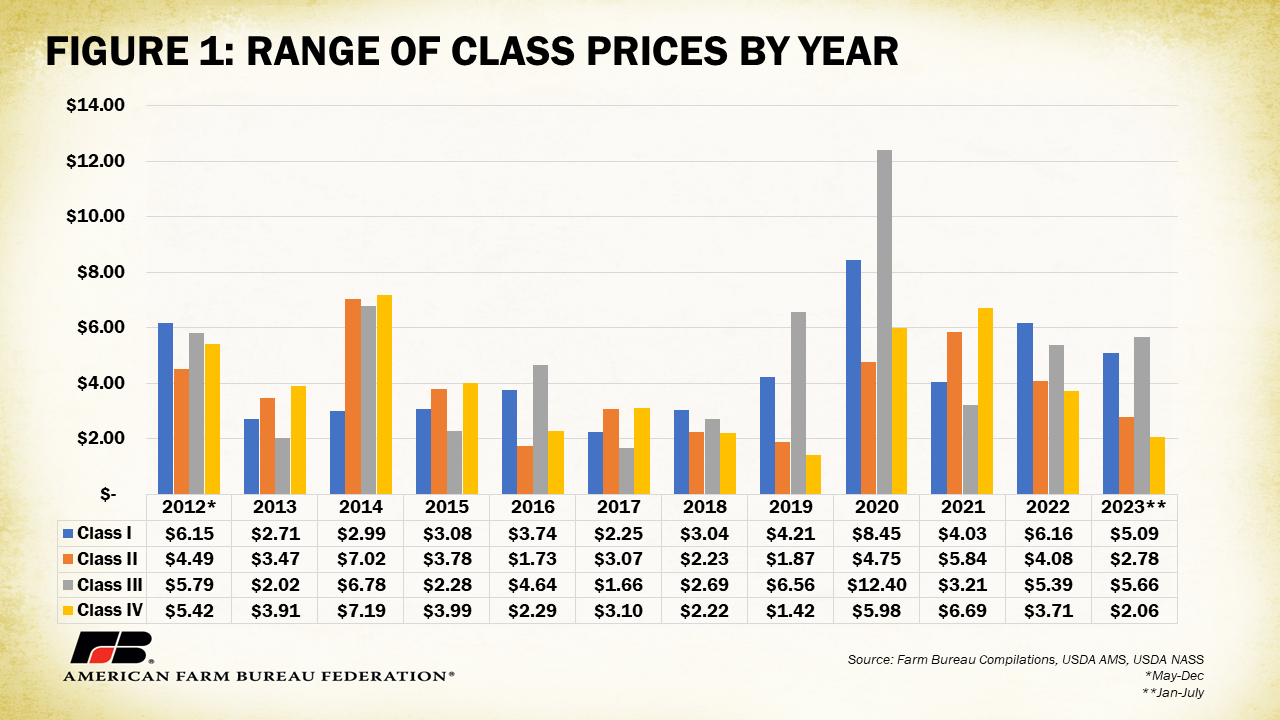
The conditions USDA refers to from over 20 years ago related to price inversions, rapidly changing markets and resulting competitive inequalities among dairy farmers have continued. A range in a price series provides insights on how volatile a price is. Larger ranges in price indicate high volatility while a smaller range would indicate lower volatility. As displayed in Figure 1, the range in Class prices within a year has exceeded $4 per hundredweight frequently since 2012. For example, the annual range in Class I prices has exceeded $4 per hundredweight in six of the past 12 years. The annual range in Class II prices has exceeded $4 per hundredweight in five of the past 12 years. The annual range in Class III prices has exceeded $4 per hundredweight in seven of the past 12 years. And the annual range in Class IV prices has exceeded $4 per hundredweight in four of the past 12 years. The average annual range in prices has exceeded 20% of the average final Class price for all Classes of milk, with Class III ranges exceeding 28% of the average final Class III price since 2012. Dairy farmers have dealt with wide and rapid spreads in prices that have contributed to income uncertainty and disruptions in their ability to manage risk.
USDA continues in the same section on the issue of de-pooling:
“Milk used in Class I in Federal order markets must be pooled, but milk for manufacturing is pooled voluntarily and will not be pooled if the returns from manufacturing exceed the blend price of the market wide pool. Thus, an inequitable situation has developed where milk for manufacturing is pooled only when associating it with a market wide pool increase in returns. Illustrative of the worsening class price inversion problem are the growing volumes of milk that, while normally associated with Federal milk orders, are not being pooled due to price inversion problems.”
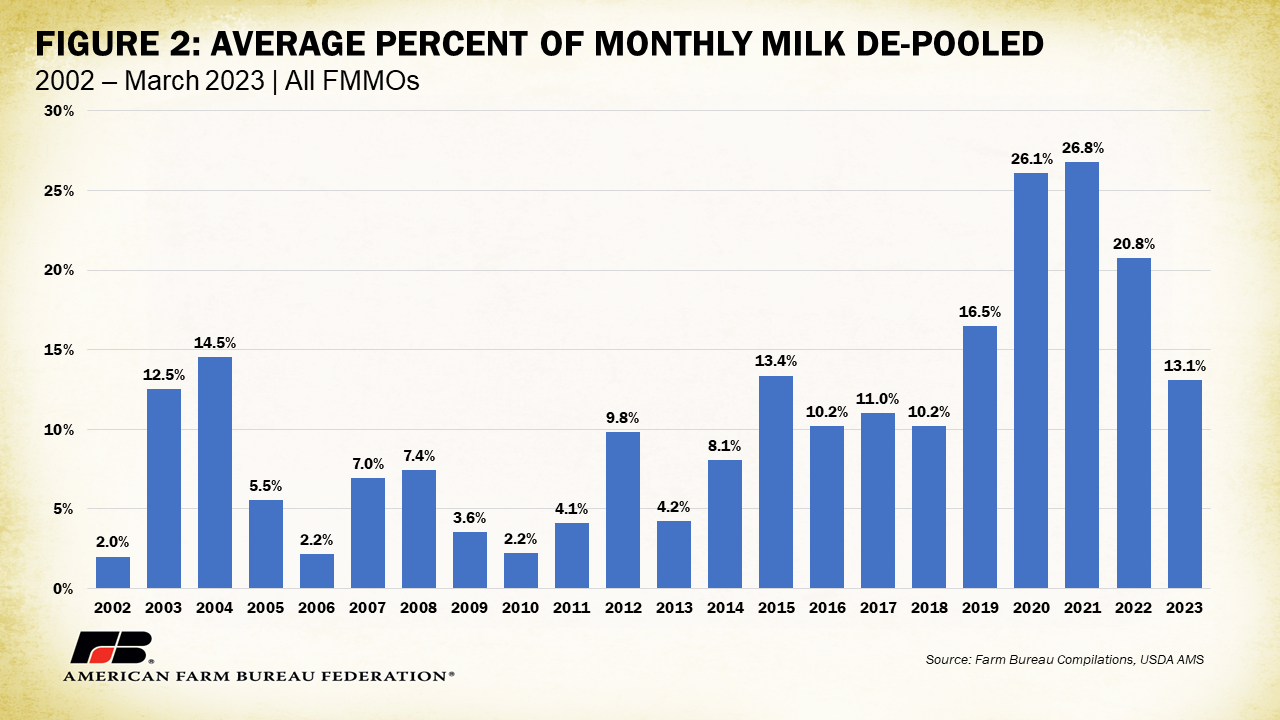
Over the past 20 years the percentage of de-pooled milk has increased. Based on data from USDA exhibit 30, between 2007 and 2012 the average monthly percent of eligible milk that was de-pooled across all orders was 5.7%; between 2013 and 2018 this percentage increased to 9.5%. Between 2018 and 2023, this figure nearly doubled to an average of 18.9% of eligible milk being de-pooled each month. Handlers are de-pooling milk at higher volumes more frequently, contributing to increased occurrences of disorderly marketing. It is important to note, a comparison of milk de-pooled in only Order 30 was analyzed to ensure the addition of California’s Order 51 in 2019 was not the driving cause of this trend.
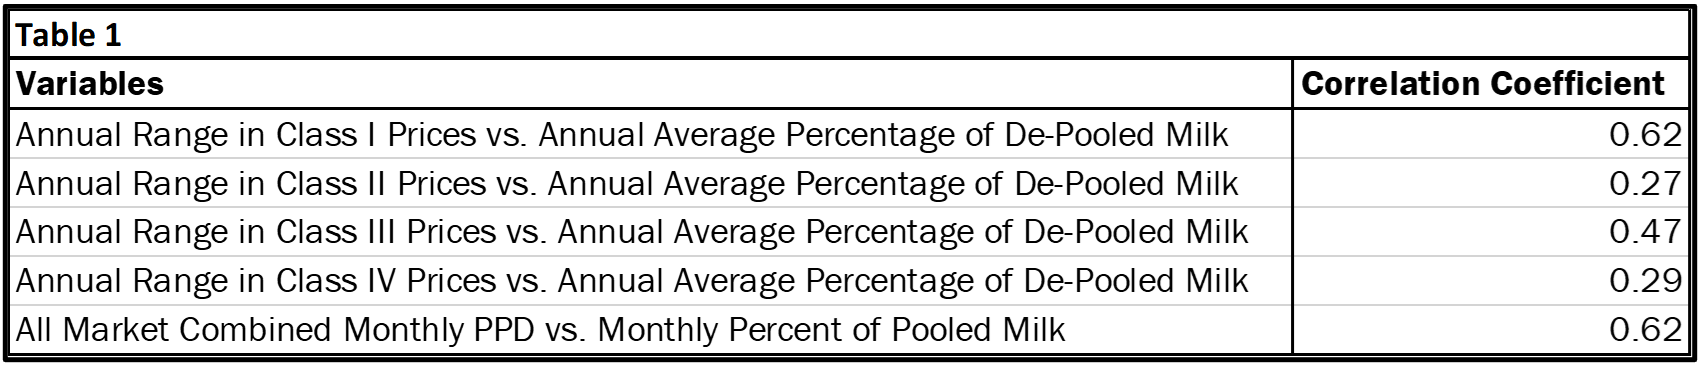
The increase in de-pooling has been correlated with the volatility in Class prices at varying levels with a higher positive correlation between wider Class I and Class III ranges and higher rates of de-pooling. More frequent de-pooling has also been positively correlated with lower and negative producer price differentials. These interactions are displayed in Table 1.
Based on AMS’ final Class pricing data from May 2012 to July 2023, the range of Class prices for each year was compared to the average monthly percentage of milk de-pooled that year using Excel’s CORREL function, which determines the correlation coefficient between two variables. The same was done comparing month-to-month percentages of pooled milk with the average all-order producer price differential. A positive correlation (between zero and one) indicates varying strengths of positive linear relationships between the two variables, while a negative correlation is reflected in a value between 0 and -1. For instance, the correlation coefficient of the annual range in Class I prices compared to rates of average annual rates of de-pooling is 0.62, indicating as the range of Class I prices was higher, the rate of de-pooling was higher. Similarly, the correlation coefficient of the monthly all market combined PPD and monthly percent of pooled milk was also 0.62, indicating as the PPD increased, the percent of monthly pooled milk also increased.
The inequitable situation that USDA described over 20 years ago has become increasingly present in today’s dairy markets. Eligible processors pool milk when market-wide pool returns are expected to be positive compared to current manufactured Class prices but are likely to de-pool milk otherwise. This causes serious competitive inequities among dairy farmers, contrary to the intention of uniform prices.
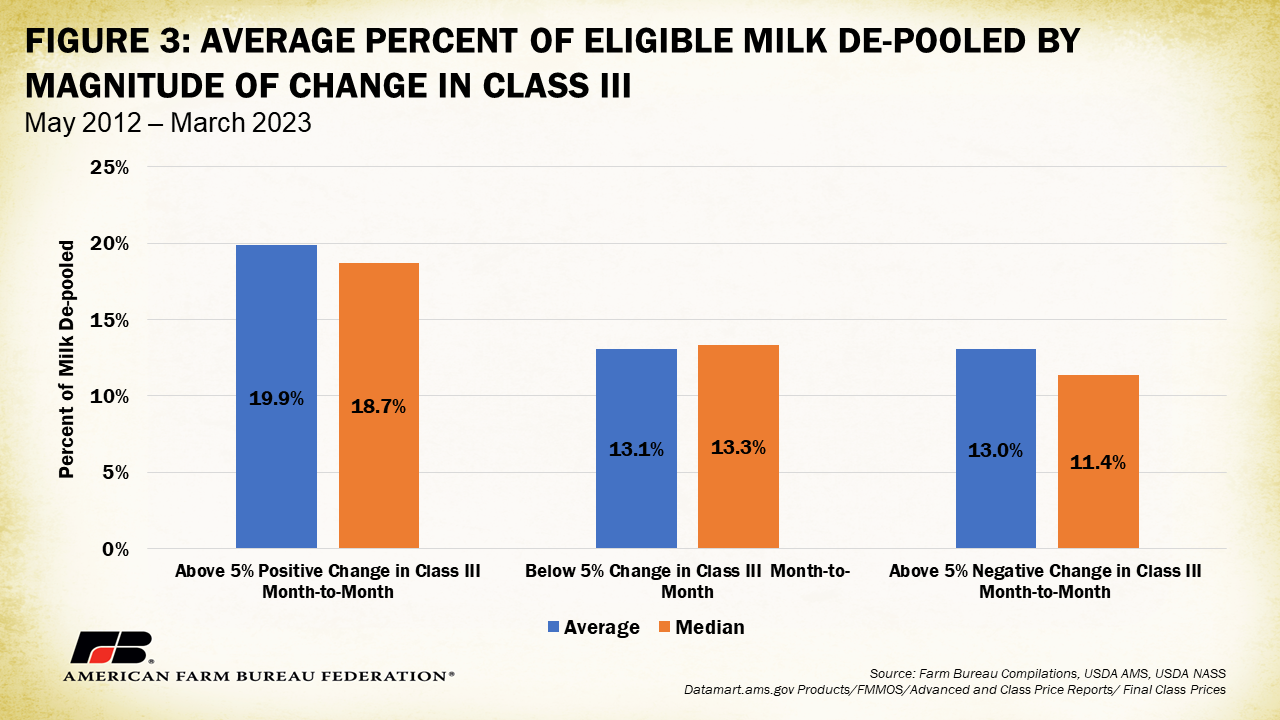
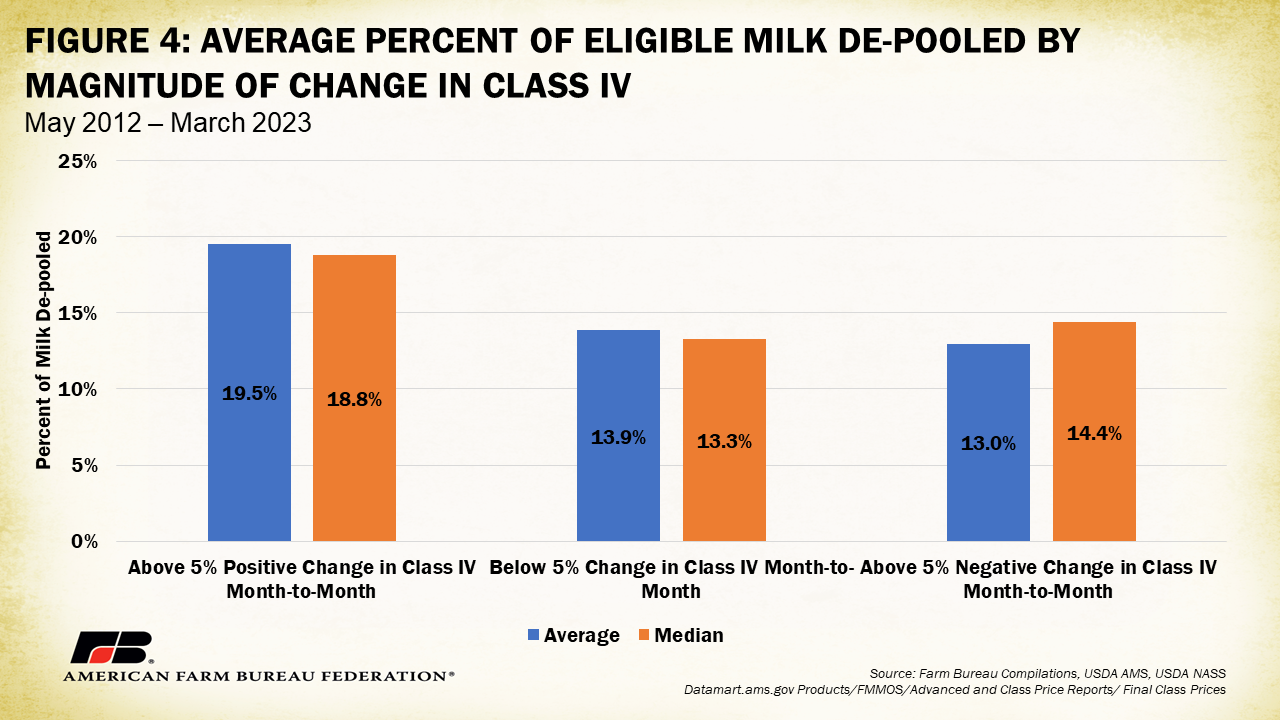
Large ranges and rapid increases in Class prices contribute to, or at least are associated with, higher rates of de-pooling. Figures 3 and 4 compare the average percent of milk de-pooled across all markets within three different identified timeframes. The first timeframe isolates months in which the Class III price (for Figure 3) and the Class IV price (for Figure 4) rose positively more than 5%. The second timeframe isolates months in which the corresponding Class price declined more than 5%. The third timeframe isolates months in which the change in the corresponding Class price was below 5%. Both the average and median percent of eligible milk de-pooled are displayed for the three different timeframes. For months where Class III prices increased more than 5% the amount of de-pooled milk from the market averaged 19.9%, while the percentage of milk de-pooled in months with more than a 5% decline or lower than a 5% change averaged 13% and 13.3%, respectively. Likewise for months where Class IV prices increased more than 5% the average amount of de-pooled milk from the market averaged 19.5%, while the percent of milk de-pooled in months with more than a 5% decline or lower than a 5% change averaged 13% and 13.9%, respectively. It is important to note that these values are averages across all orders, the impact of stricter pooling rules in certain orders is not accounted for. Since existing pooling rules limit the rate at which milk could be re-pooled it is likely that the full magnitude of Class price changes on de-pooling is more extreme than presented.
As mentioned previously, when market prices rally, announced (final) prices can be much higher than advanced prices, leading to low and negative PPDs. This creates an opportunity to de-pool milk from the order to benefit from the non-pooled value of the recently elevated prices reflected in available market information, further depressing the PPD. Producers who incur the additional costs of consistently servicing the Class I needs of the market receive a lower return than they would otherwise have received if they did not continue to service the Class I market. Prices received by dairy farmers who supplied the other milk needs of the market are not known. However, as USDA affirmed, “it is reasonable to conclude that prices received by dairy farmers were not equitable or uniform.”
After their in-depth discussion, USDA ultimately decided to reduce the time lag between advanced and announced prices by 18 days with the intention that price inversions and associated de-pooling behavior would be avoided. USDA defended their decision with several important points. Firstly, the National Dairy Product Sales Report (NDPSR), which includes statistics and pricing information used in the first step of establishing a minimum pay price are announced publicly every week. Therefore, as USDA puts it, “handlers can update formulas on a weekly basis to estimate what the Class I price will be before the price is announced.”
Let’s read through a quick example. Announced in late May, the Class I price for June 2020 was $14.24/cwt. During June there were four NDPSR releases: June 4, June 10, June 17 and June 24. Per these reports, the prices of the following products changed by the corresponding amounts between the first report and the last report.
- 40-pound cheddar blocks increased from $1.17/lb to $1.37/lb (+17%)
- 500-pound cheddar barrels increased from $1.13/lb to $1.45/lb (+28%)
- Butter increased from $1.13/lb to $1.43/lb (+28%)
- Whey increased from $0.378/lb to $0.384/lb (+1.7%)
- Nonfat dry milk decreased from $0.860/lb to $0.859/lb (-0.2%)
Announced in early July, the Class III price for June 2020 was $21.04. There were five releases of the NDPSR in July: July 1, July 8, July 15, July 22 and July 29. Per these reports, the prices of the following products changed by the corresponding amounts between the first report and the last report.
- 40-pound cheddar blocks increased from $1.61/lb to $2.53/lb (+57%)
- 500-pound cheddar barrels increased from $1.74/lb to $2.50/lb (+44%)
- Butter increased from $1.56/lb to $1.82/lb (+17%)
- Whey decreased from $0.382/lb to $0.365/lb (-4.4%)
- Nonfat dry milk increased from $0.846/lb to $0.959/lb (+13%)
The Class IV price formula does not include the commodity values of cheese in its calculation, instead relying on nonfat dry milk prices and butter prices in its formula. Given the above per-pound values, the spread between the Class III and IV price could be inferred before the announcement of monthly prices pooled manufacturers would have to pay are reported. This differs from the advanced price announced for Class I and II, which are based on different, previous values. This available information means that processors should have enough information and enough time to de-pool milk when price changes are clear and rapid. The presence and frequency of published commodity pricing data should allow handlers to estimate price changes regardless of when a price is announced. Additionally, as more products are offered on the Chicago Mercantile Exchange, handlers will have increased access to the information needed to hedge and manage risk.
USDA agreed on this matter in their 1999 decision stating:
“Also, as more NASS product price survey observations become available, basis differences from earlier traded/ issued product price surveys such as those from the Chicago Mercantile Exchange or Dairy Market News will be more predictable and, therefore, should provide for more accurate predictions of future price levels. In addition, futures markets have been established for the four dairy products in the NASS price surveys. While trading to date in these contracts has not been large, interest in these markets may increase as the industry learns to use them as effective hedges to the component values determined under this final decision. These markets also will assist handlers in estimating the Class I price.”
Summary
The Federal Milk Marketing Order system establishes provisions under which dairy processors purchase milk from dairy farmers supplying specific marketing areas. Two of the primary functions of the federal order structure are the calculation of minimum uniform prices paid to farmers and to incent orderly marketing of milk. Recent price conditions have revealed disorderly marketing is present when producers do not receive uniform prices because of frequent de-pooling. The current system of advanced pricing contributes to the frequency and magnitude of de-pooling. Given the growing number of resources for data and market information, the historic benefit of advanced pricing may no longer be necessary and its removal in the pricing of Class I and II milk may be a viable option to help modernize the FMMO system.

Top Issues
VIEW ALL