Coronavirus Trade Data: Four Months In
TOPICS
Trade
photo credit: Getty Images
Veronica Nigh
Former AFBF Senior Economist
USDA’s import and export trade data for June 2020, released Wednesday, provides important insight into the impact of the COVID-19 outbreak on U.S. farm products. While the first stay-at-home orders didn’t begin until mid-March, concerns about the virus began several weeks before, impacting businesses and consumer purchasing behavior nearly the entire month of March. Now with four months of data available, the effect on international agricultural trade is coming into focus.
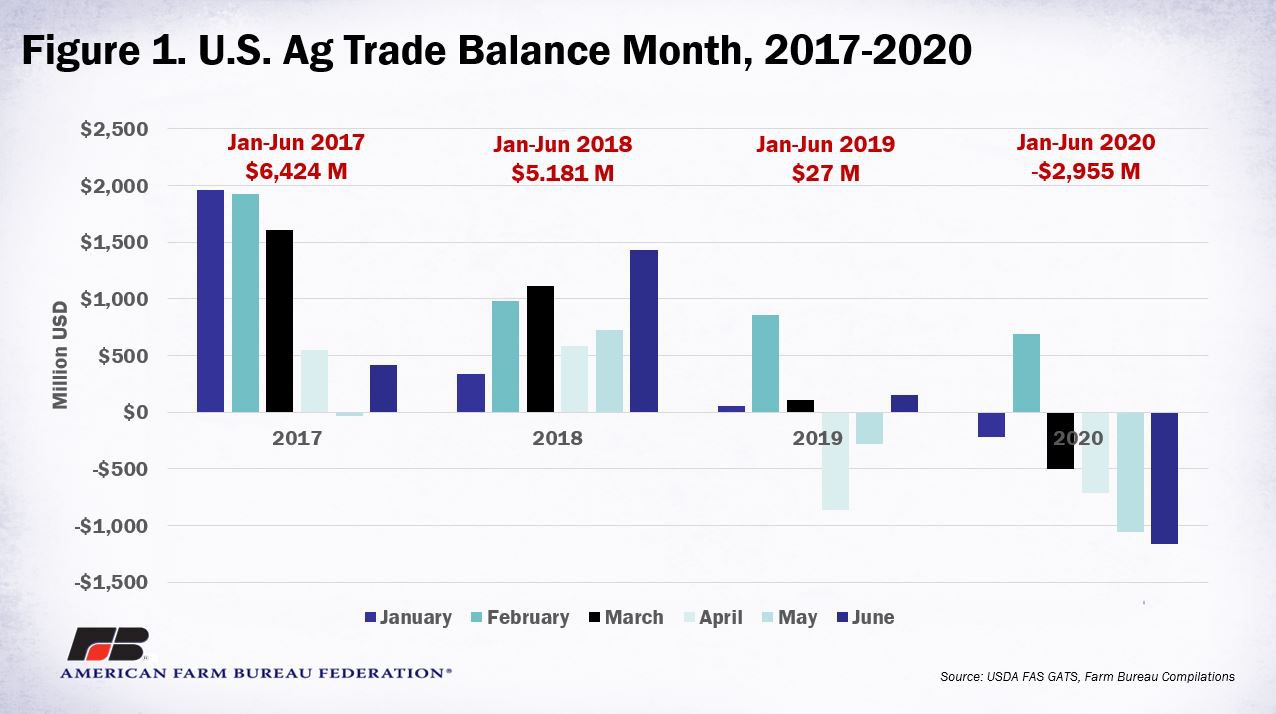
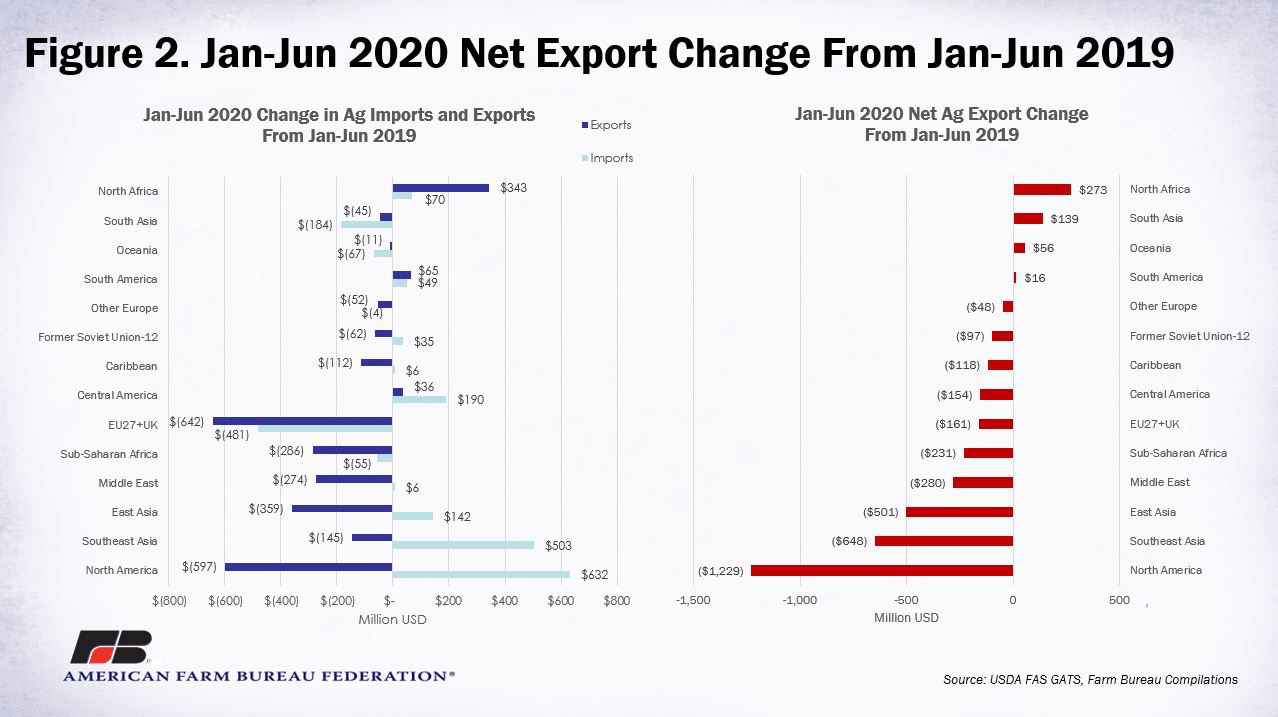
June 2020 marked the fourth month in a row, and the fifth month in 2020, that the U.S. had a negative ag trade balance. The June negative balance of more than $1.1 billion brings the total negative trade balance for the first six months of 2020 to $2.955 billion. As we see in Figure 2, this balance is down sharply from January-June 2019, when the balance was positive $27 million. The difference between the trade balance for the first six months of 2020 and that same time period in 2017 is negative nearly $9.4 billion. This is a relevant statistic because 2017 is largely regarded as the last “normal” year in agricultural trade, before the U.S. and various trade partners, including China, began trade retaliatory tariffs. the year-over-year decline from January-June 2020 was fueled by a decrease of $2.1 billion, or 3%, in exports, while imports rose $842 million, or 1%.
On a regional basis, the U.S. saw a decline in net exports in most regions, except North Africa, South Asia, Oceania and South America. In a few regions, both exports and imports in the first six months of 2020 were higher than in the same period of 2019. The most dramatic increase was the former-EU-28, labelled here as EU27+UK, which has also been hit hard by COVID-19. U.S. ag exports to this region were down $642 million, while imports from the region were also down $481 million. In East Asia, the U.S. ag trade balance in January-June 2020 was more than half-a-billion dollars below January-June 2019, chiefly due to a sharp decline in U.S. ag exports to the region, though U.S. imports from this region also increased. It is worth noting that the East Asia region includes China.
Finally, large changes in the U.S. ag trade balance with Southeast Asia and North America stand out among other regions. In both regions the U.S. ag trade balance suffered from a decline in exports and an increase in imports. For example, in North America, U.S. exports fell $597 million, while imports rose $632 million, leading to a net export loss of $1.229 billion in January-June 2020 compared to January-June 2019.
A dig into the data highlights which product areas posted the largest changes in the first six months of 2020, compared to the same months in 2019. Figure 3 does not include all product categories, but those that represent a significant share of both U.S. agricultural exports and imports. In it, we see that pork, at $922 million, has the most sizable increase in net exports over the period. This is driven by an incredible increase in exports, largely to China, as a result of the African Swine Fever outbreak there, which decimated the local pork supply. The product area with the second-largest improvement in net exports over the period was beverages, which includes wine, malt beverages and other beverages, but does not include fruit juices. This improvement was largely the result of an 8% decrease in imports, led by decreased purchases from the EU-27+UK region. There was also a strong increase in net exports of dairy products over this period. In this case, a significant increase in dairy exports outstripped a small increase in imports.
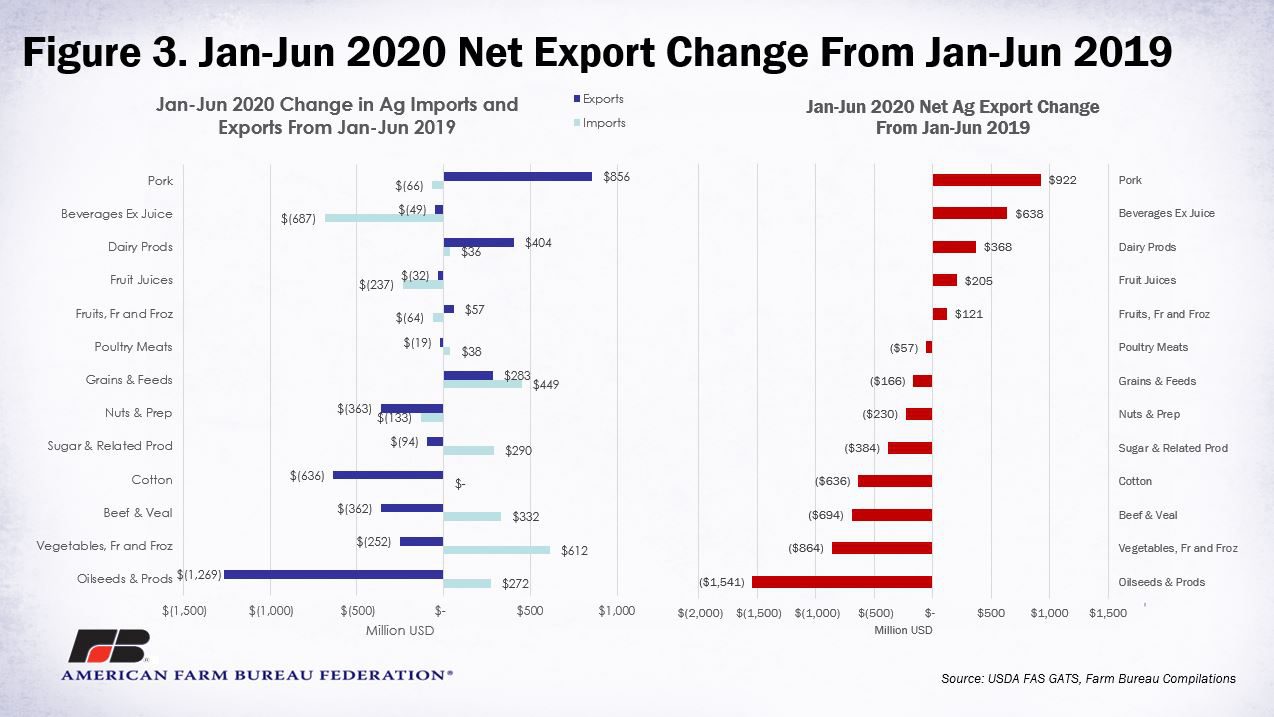
At the other end of the chart are the product areas with the largest decline in net exports in the first six months of 2020, compared to the same time period in 2019. With minimal imports, the drop in net exports of cotton is driven almost solely by sizable declines in cotton exports. Sales of cotton to the Southeast Asia region (Vietnam, Indonesia, Thailand, Malaysia, Philippines, Singapore) were down 25% and to South Asia (Pakistan, Bangladesh, India) were down 19% in January-June 2020, compared to January-June 2019. Combined, these two regions account for more than 50% of cotton exports, so a decline to these regions is strongly felt. Cotton export declines are largely attributable to COVID-19, as consumers worldwide have cut back on apparel purchases.
The beef and veal product category experienced the double whammy of an increase in imports and a decline in exports over the first six months of 2020, leading to a decline in net exports. It is worth noting that January-June 2020 beef imports were $3.349 billion, while exports over the same period were $3.197 billion. So, while the net export position eroded some, a considerable amount of trade was occurring. Both the increase in imports and decline in exports were likely driven by some of the challenges that were experienced in U.S. packing plants earlier in the year due to COVID-19.
Fresh and frozen vegetables were also hit by the double whammy of a decline in exports and increase in imports in January-June 2020, compared to the same period in 2019. The increase in imports was largely attributable to increased imports from North America. From this region, imports of fresh tomatoes increased 22%, fresh peppers increased 4%, cucumbers increased 12% and fresh squash increased 38% in January-June 2020, compared to the same period in 2019. The decline in exports was led by a 19%, or $117 million, decline in frozen potatoes, as consumers around the world have dined out less.
Finally, net exports of oilseeds and related products fell by more than $1.5 billion in the first six months of 2020, compared to the same period in 2019. This decline was predominantly led by a decrease in soybean exports to China, which were $1.457 billion lower in January-June 2020 than January-June 2019. It was widely reported that soybean exports to China were especially large during the last two weeks of July, so it is unlikely that oilseed exports will be this far off 2019 data once the July trade data is released on Sept. 3.
Conclusion
Recent trade data continues to highlight that the challenges producers are facing go beyond production. For an industry accustomed to achieving a trade surplus year after year, a trade deficit of nearly $3 billion over the first six months of 2020 is eye-popping. The longer COVID-19 impacts consumers worldwide, the more unlikely it is that exports will make up for lost sales thus far. Could 2020 be the first year in recent memory that U.S. agriculture experiences a trade deficit? Only time will tell.
Top Issues
VIEW ALL