Cow Slaughter Higher in Beef and Dairy Herds
AFBF Staff

photo credit: Right Eye Digital, Used with Permission
Federally inspected cow slaughter is released with regional aggregations weekly and data has been released through the first quarter of 2017. The U.S. is grouped into 10 regions, and USDA reports data weekly for beef and dairy cows sent to federally inspected plants. This is an indicator of changes in the cow herds, such as phases of contraction or expansion and changes to herd turnover rates.
Through the 12 weeks of 2017, cow slaughter has been up, beef cow slaughter is up 9 percent, while dairy cow slaughter is up 4 percent. This is unsurprising on the beef side, cattle prices have entered into a second year of lower prices. However, the January 1 cattle report confirmed expansion was still in the minds of producers, showing beef cows were up 3 percent from a year ago and beef replacements were 1 percent higher. There are several factors at play. The first is low prices in the fall encouraged hold back on animals that would have been culled last year. Since then, cull cow prices have moved higher relative to the fall and producers have shipped those animals to take advantage of higher prices. But, more importantly, cattle producers are returning to more normal cull rates compared to relatively low cull rates seen in the last couple years of rapid herd expansion. With lower year over year prices, 2017 is likely a year of transition, moving away from the expansionary phase seen in the last few years. Because of the timing, it’s premature to start calling for contraction just yet. However, this beef cow slaughter is one to watch over the next several months to clue into next year’s expectations.
Dairy cow slaughter, on the other hand, has increased in the face of year-over-year higher prices. Last year the U.S. all-milk price averaged $15.70 per cwt, while this year the first quarter is estimated to average in the mid to low $18s per cwt. That’s about a 16 percent increase, but still below the five-year average of $18.90 per cwt. Dairy farmers have been under significant financial stress over the last two years, and for some this price increase may be coming too late.
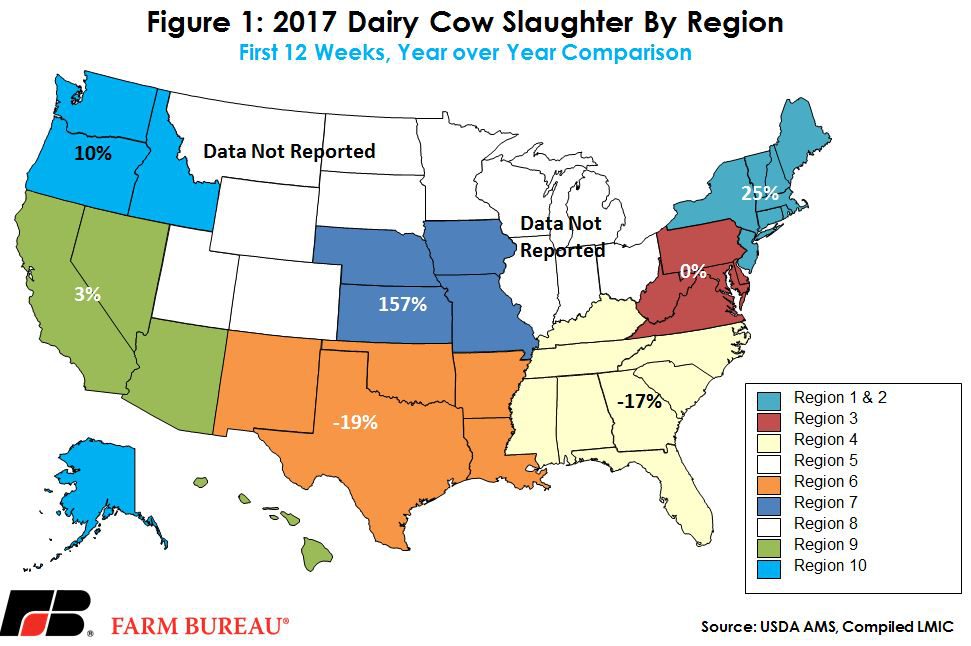
These numbers can be interesting to look at regionally because they point to small nuances on a local level. For example, since December 2016, Region 7 has nearly tripled the number of dairy cows slaughtered. It’s important to keep in mind that this data represents where the cows are slaughtered as opposed to where they were on the farm. In this case, a slaughter plant has increased the number of cows it’s slaughtering by about 1,000 head per week, at least in part leading to the impressive increase of 157 percent over last year for the first quarter.
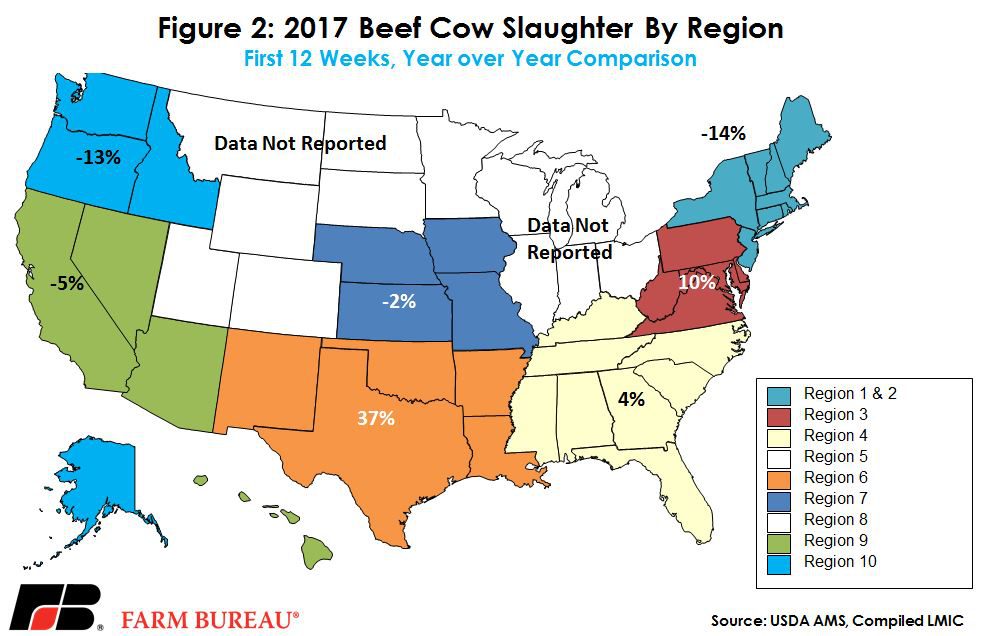
There have been some interesting shifts in the first 12 weeks of this year, and in most regions, dairy and beef cow slaughter are moving in opposite directions. The most dramatic example is in the Northeast (Region 1 & 2 combined) where dairy cow slaughter has been up 25 percent compared to last year and beef cow slaughter has been down 14 percent. Region 6 has also seen large shifts; dairy slaughter is down 19 percent, while beef cow slaughter is up 37 percent. The cost of production, plant locations, and live imports can play a big role in these regional differences, and there isn’t always a story like the one above that provides an explanation. Figures 1 and 2 show the regional differences in slaughter compared to a year ago through the first 12 weeks of 2017.
Top Issues
VIEW ALL